Long-form features with original infographics, regional comparisons and the evidence behind every number. Each graphic comes with its data table, its source and its limits.
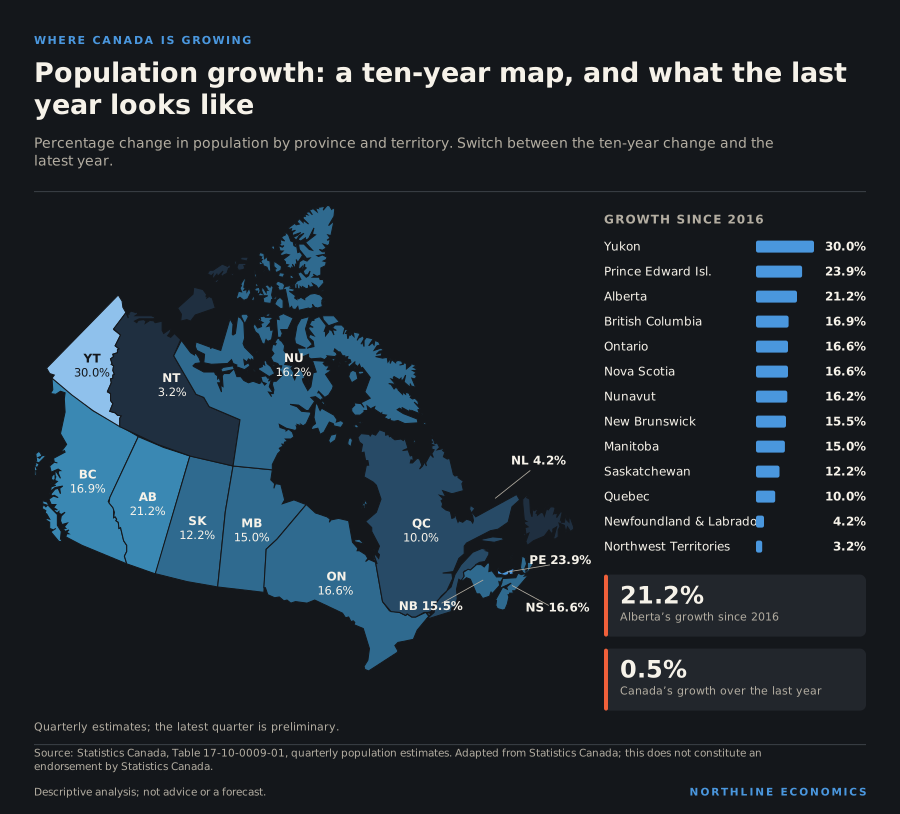
Immigrants arrive, temporary residents come and go, and Canadians move between provinces. Each flow has its own rhythm, and in the last three years they have pulled in different directions.
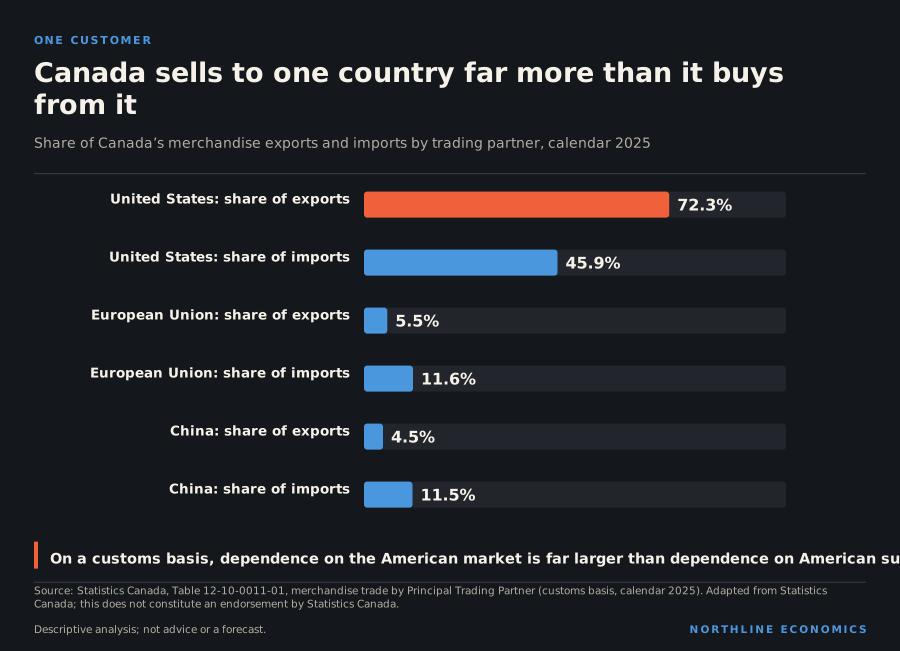
On a customs basis, the United States takes most of what Canada sells and supplies less than half of what Canada buys. That imbalance, and what is in the shipments, is the shape of Canadian trade.
Updated November 6, 202625 min read
Provinces and Cities · Calgary CMA, Edmonton CMA, Toronto CMA
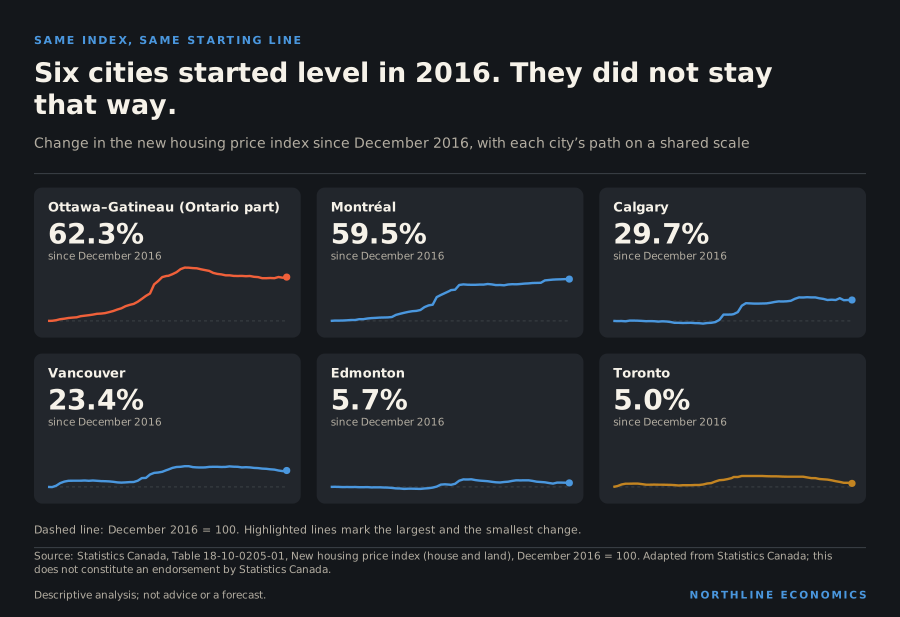
Statistics Canada starts every city’s new-home price index at 100 in December 2016. Nearly ten years on, two cities are up by more than half and two have barely moved.
Updated November 6, 202616 min read
Industries · Alberta, Saskatchewan, Newfoundland and Labrador
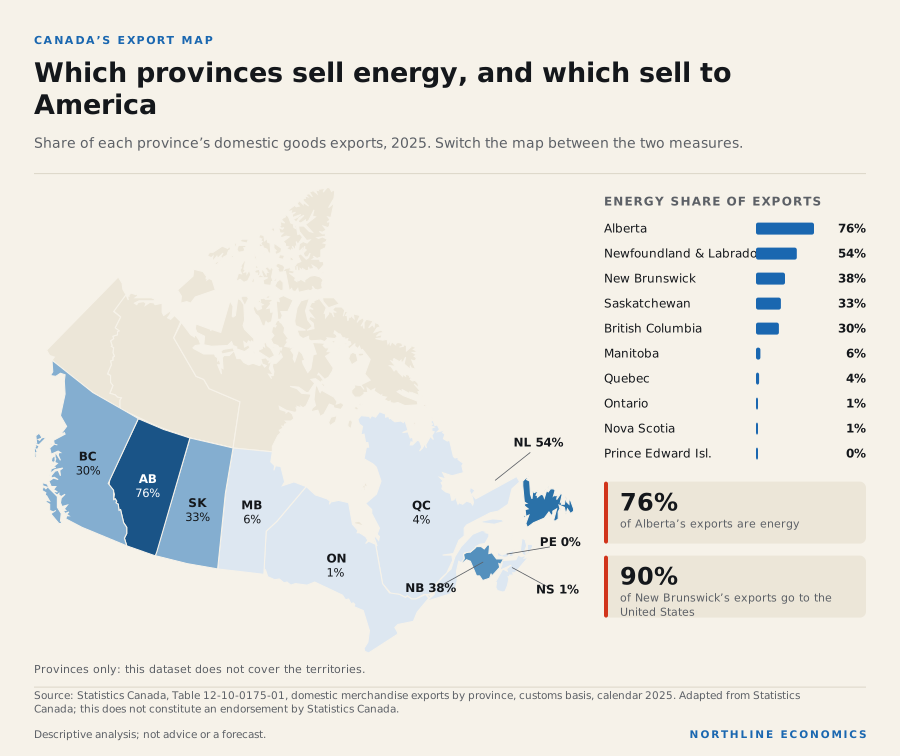
In 2025 Ontario sold the most. Alberta sold the energy. New Brunswick sold almost everything to one customer. Three ways of being an export economy, in one map.
Updated November 6, 202618 min read
Provinces and Cities · Calgary CMA, Edmonton CMA, Toronto CMA
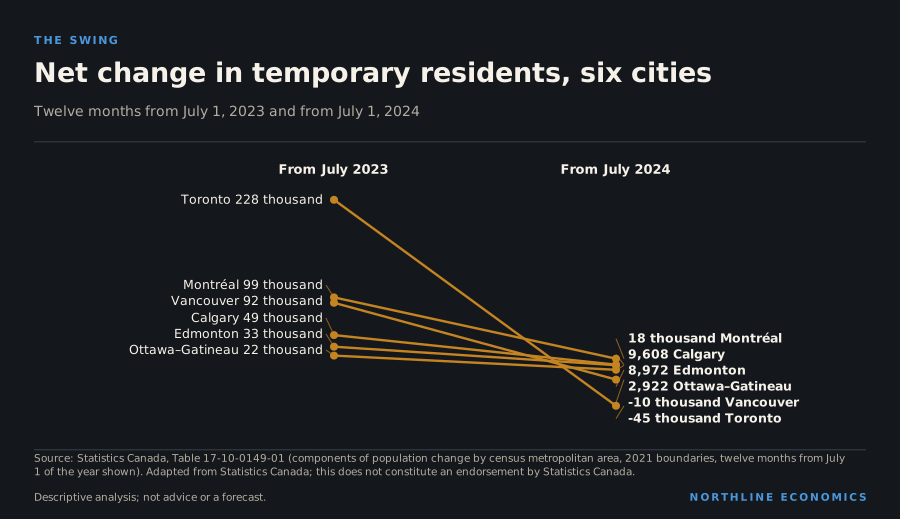
Six large cities were all growing quickly in 2023 and 2024. In the year to July 2025, Edmonton and Calgary kept growing while Toronto and Vancouver stopped. One flow explains most of the slowdown…
Updated November 6, 202613 min read
Industries · Alberta, Saskatchewan, Newfoundland and Labrador
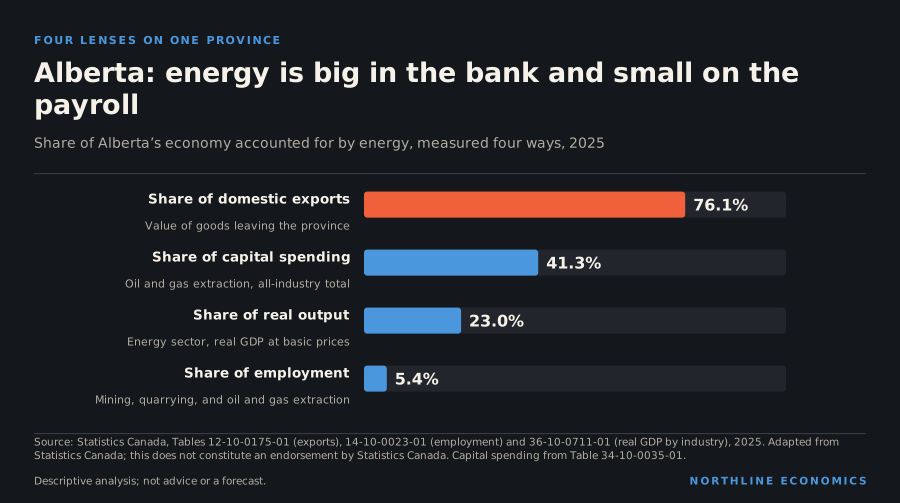
In 2025 energy was most of what Alberta sold abroad, more than a fifth of its output and two-fifths of its capital spending, but the industry’s own payroll was a small share of its jobs. Four ways of…
Updated November 6, 202613 min read
Provinces and Cities · British Columbia, Alberta, Saskatchewan
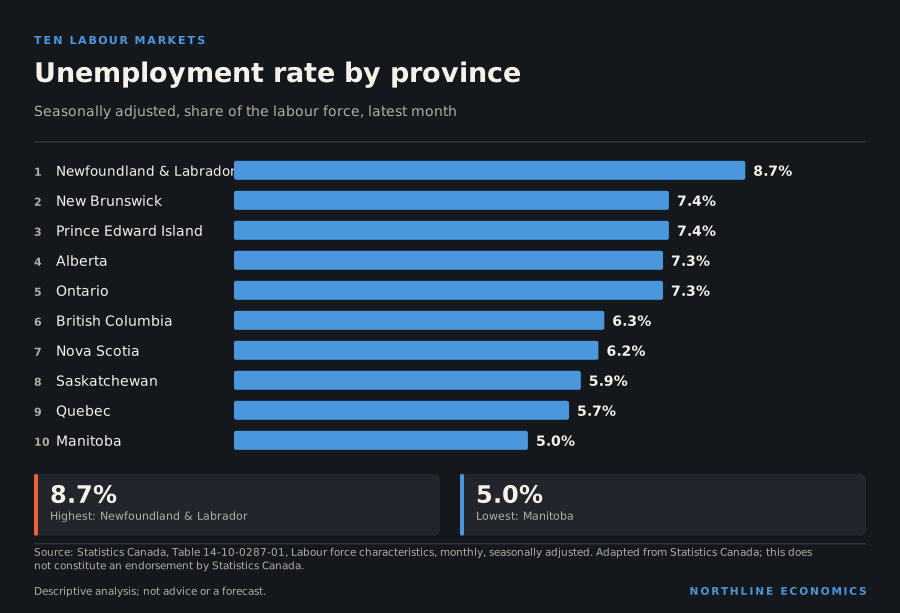
Unemployment rates range by only a few points across the provinces, but employment, vacancies and earnings tell different stories about the same places.
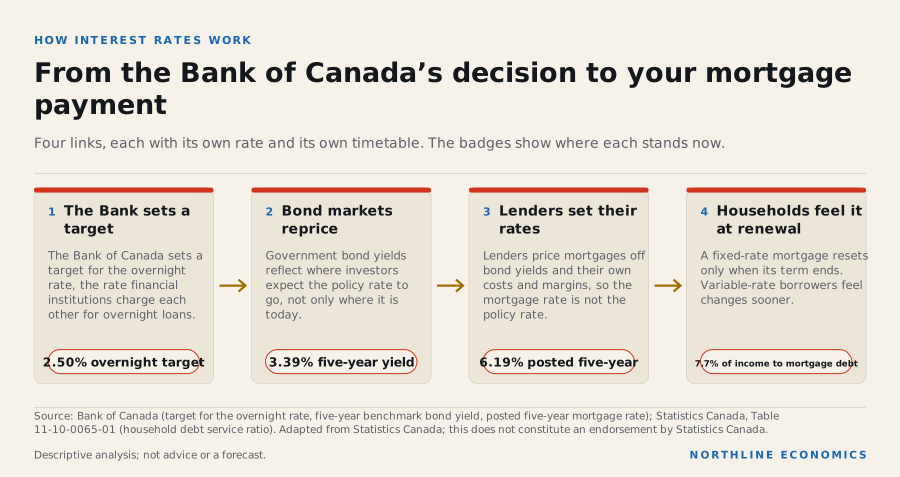
The policy rate was 2.50% on 5 November 2026. The posted five-year mortgage rate was 6.19% in the week of 28 October 2026. This note follows the chain between those two numbers and shows where the household feels it.
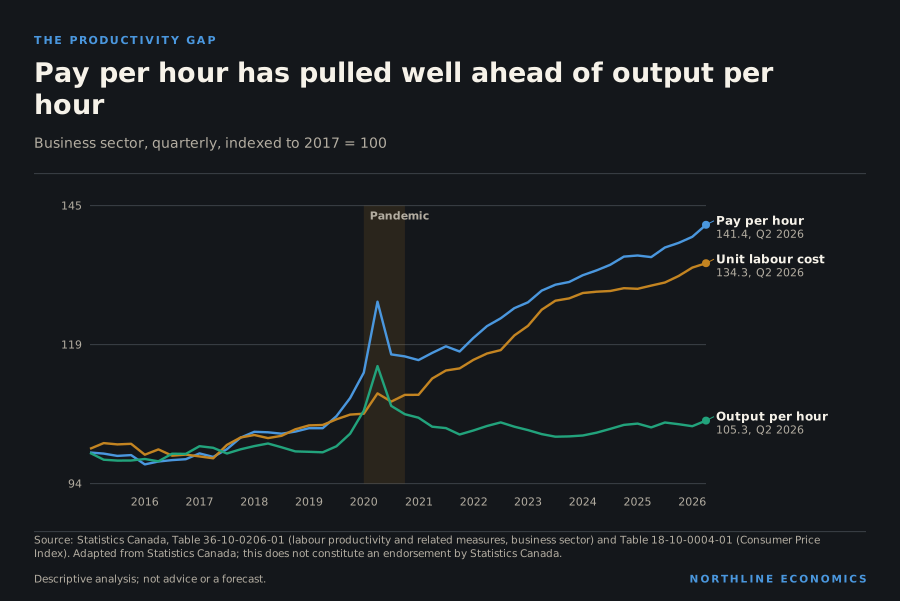
Since 2017 compensation per hour in Canada’s business sector has risen to 141.4 on a 2017 = 100 scale by Q2 2026, while output per hour has reached 105.3. What the gap between the two means, and what it cannot tell you.
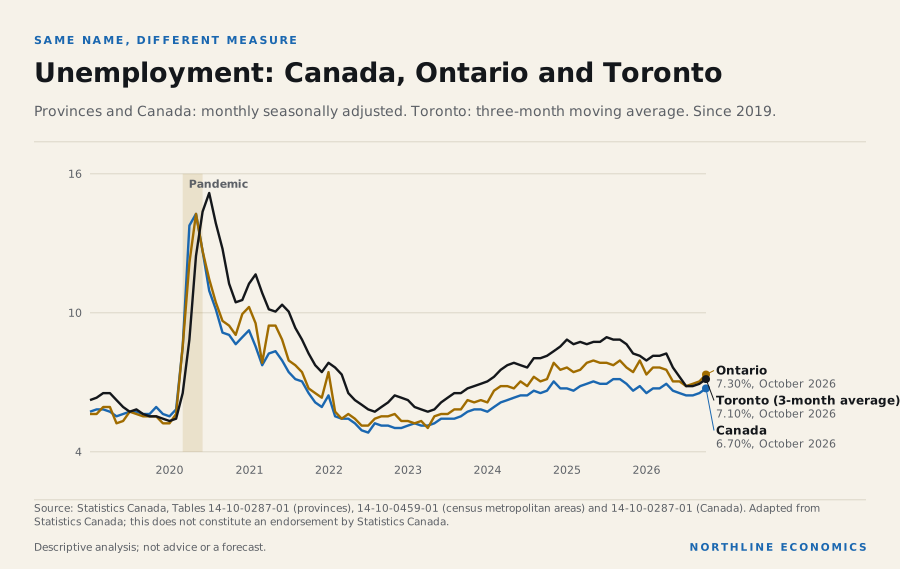
A city, its province and the country are not measured the same way. This note shows four concrete cases in Statistics Canada tables, with the data, and explains why Northline never draws a chart that mixes geographic…
Explore all research
Notes, report sections and province and city analyses in one searchable list.
No research matches. Clear the search or filters.
Need research on your own question?
Northline takes on research scoped to one decision: where to locate, how a sector or supplier base is exposed, or how two regions compare. Each engagement is agreed in writing before work starts. Consulting and advisory firms can also work with Northline as a research partner.