GlobalCanadaCities

Atlas · YYZ · Ontario

Toronto

7,108,874 people, July 2025. Metropolitan area measures, beside the 13 other cities Northline covers.

Map of Canada with provincial boundaries. The 14 cities Northline covers are listed in the text.

Unemployment rateToronto among 14 cities

Measure
2021202220232024202520264.0%6.0%8.0%10.0%12.0%7.1%Edmonton7.1%Toronto6.7%Vancouver6.6%Calgary

Pin up to four cities

    Three-month moving average, seasonally adjusted. Statistics Canada, Labour Force Survey.

    Table view
    Latest value for each city.
    CityLatestPeriod
    London8.1%Oct 2026
    Hamilton7.6%Oct 2026
    Toronto7.1%Oct 2026
    Ottawa–Gatineau7.1%Oct 2026
    Edmonton7.1%Oct 2026
    Kitchener–Waterloo7.1%Oct 2026
    Montréal6.9%Oct 2026
    Vancouver6.7%Oct 2026
    Calgary6.6%Oct 2026
    Saskatoon5.9%Oct 2026
    Regina5.9%Oct 2026
    Halifax5.4%Oct 2026
    Winnipeg5.0%Oct 2026
    Québec4.5%Oct 2026

    Vital signs

    Toronto in eight numbers

    Vital signs for Toronto
    MeasureLatestPeriod and rank among 14 citiesContextTrend
    Unemployment rate7.1%Oct 2026, third highest of 14Ontario 7.3%, Canada 6.7% (monthly measures)
    Employment rate62.2%Oct 2026, tenth highest of 14
    Consumer prices, 12-month change2.1%Sep 2026, lowest of 11Ontario 2.5%, Canada 3.1%
    Population7,108,874July 2025
    Population growth0.0%Year to July 2025, lowest of 14
    Housing starts, last 12 months23,355To Sep 2026, fourth highest of 14
    Average two-bedroom rentC$2,045October 2025, second highest of 14
    Rental vacancy rate3.0%October 2025, ninth highest of 14

    City figures are metropolitan-area measures. National and provincial unemployment rates are monthly, so they are close to but not the same measure as the three-month city averages.

    What it is built on

    Jobs by industry

    1. Professional and technical services13.8% vs 11.4%
    2. Health care and social assistance11.1% vs 13.5%
    3. Retail trade10.5% vs 11.6%
    4. Manufacturing9.5% vs 8.4%
    5. Finance and insurance9.3% vs 6.3%
    6. Educational services7.4% vs 8.3%
    7. Transportation and warehousing5.0% vs 4.4%
    8. Public administration4.5% vs 7.1%
    9. Company management0.7% vs 0.4%

    Share of jobs by place of work, 2021 Census. The tick marks the 14 cities combined. Total jobs counted: 2,664,205.

    See Toronto’s skyline in the Field

    Rates and housing here

    Where the ripple reaches Toronto

    A reading path through recorded links, not a forecast. Effects along a chain are never added or multiplied.

    Follow the ripple

    Where to go next

    ServicesGet a full profileA sourced profile of Toronto for a lender, board or council. StudioOpen in StudioA workspace prepared from these measures, with the gaps stated.
    YYZ · Toronto CMA · city dashboard

    The Toronto economy: a tariff shock, a population stall and a housing reset

    Toronto's population was unchanged in the year to July 2025 after a record gain a year earlier, and Ontario's independent fiscal watchdog says the province went through a technical recession from late 2025 to early 2026. It does not cover wages by city or resale prices; the page lists what is missing.

    Analyze Toronto in Intelligence Studio

    Opens a workspace prepared from the published Toronto measures above, with the gaps stated.

    Toronto versus Calgary in Studio → · Choose other places to compare →

    30 secondsRead the vital signs above; each measure links to its chart or section. Go to the indicators
    5 minutesRead the findings at the top, then the sourced story of what drives this economy. Go to the outlook
    20 minutesRead the local-economy section, then work through the charts and the relationships that reach the city. Go to the charts
    Toronto at a glance

    What are the main things to know about Toronto's economy right now?

    Toronto is the largest of the six labour markets, with falling new-home prices, the biggest construction pipeline and flat population growth

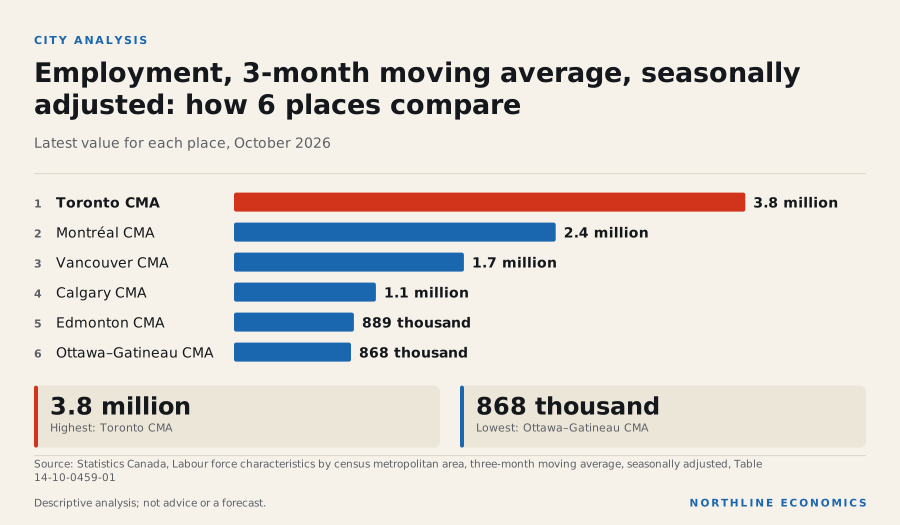
    Graphic: Employment, 3-month moving average, seasonally adjusted: how 6 plac…Employment, 3-month moving average, seasonally adjusted: how 6 places compare. Toronto CMA 3.8 million;…

    Toronto among the six largest metros

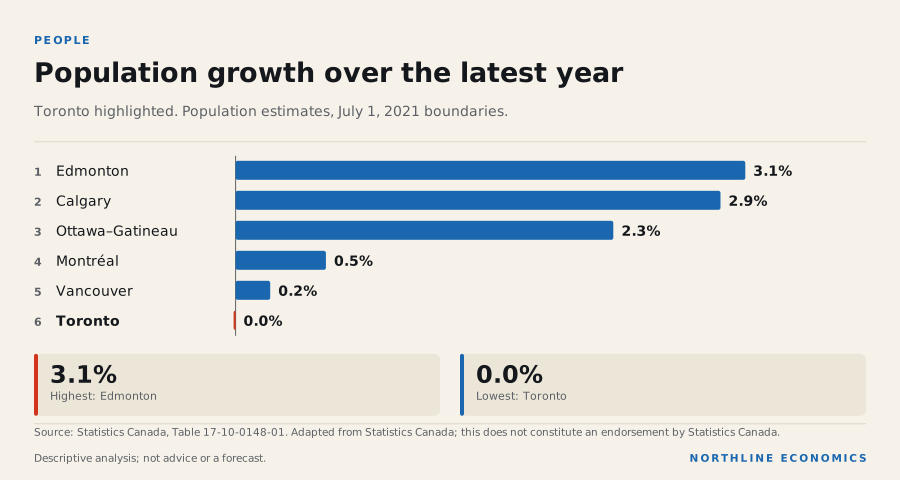
    Toronto's population of 7.1 million did not grow in the year to July 2025: the change was 0.0%, the weakest of the six. The reason shows in the migration series. Net moves to the rest of Ontario were -65 thousand, net non-permanent residents -45 thousand and net interprovincial migration -13 thousand persons in the twelve months from July 2024, the largest outflows of the six, while immigrants numbered 115 thousand, the largest inflow.

    Population growth over the latest yearPopulation growth over the latest year. Edmonton 3.1%; Calgary 2.9%; Ottawa–Gatineau 2.3%; Montréal 0.5%; Vancouver 0.2%; Toronto 0.0%.PEOPLEPopulation growth over the latest yearToronto highlighted. Population estimates, July 1, 2021 boundaries.1Edmonton3.1%2Calgary2.9%3Ottawa–Gatineau2.3%4Montréal0.5%5Vancouver0.2%6Toronto0.0%3.1%Highest: Edmonton0.0%Lowest: TorontoSource: Statistics Canada, Table 17-10-0148-01. Adapted from Statistics Canada; this does not constitute an endorsement by Statistics Canada.NORTHLINE ECONOMICSDescriptive analysis; not advice or a forecast.
    The data behind this graphic
    Population growth over the latest year
    ItemValue
    Edmonton3.1%
    Calgary2.9%
    Ottawa–Gatineau2.3%
    Montréal0.5%
    Vancouver0.2%
    Toronto0.0%

    Download this graphic (SVG, with source)

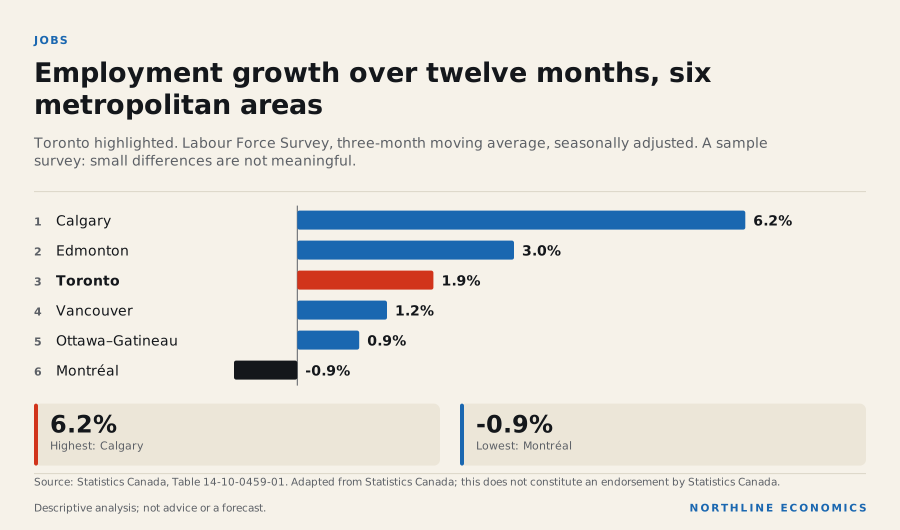
    The labour market is improving from a high base of unemployment. The unemployment rate was 7.1% in October 2026, down from 8.6% a year earlier, the largest fall of the six, ahead of Edmonton's and Calgary's, and employment is 1.9% above a year ago, third of six. The employment rate of 62.2% is fourth of six.

    Employment growth over twelve months, six metropolitan areasEmployment growth over twelve months, six metropolitan areas. Calgary 6.2%; Edmonton 3.0%; Toronto 1.9%; Vancouver 1.2%; Ottawa–Gatineau 0.9%; Montréal -0.9%.JOBSEmployment growth over twelve months, sixmetropolitan areasToronto highlighted. Labour Force Survey, three-month moving average, seasonally adjusted. A samplesurvey: small differences are not meaningful.1Calgary6.2%2Edmonton3.0%3Toronto1.9%4Vancouver1.2%5Ottawa–Gatineau0.9%6Montréal-0.9%6.2%Highest: Calgary-0.9%Lowest: MontréalSource: Statistics Canada, Table 14-10-0459-01. Adapted from Statistics Canada; this does not constitute an endorsement by Statistics Canada.NORTHLINE ECONOMICSDescriptive analysis; not advice or a forecast.
    The data behind this graphic
    Employment growth over twelve months, six metropolitan areas
    ItemValue
    Calgary6.2%
    Edmonton3.0%
    Toronto1.9%
    Vancouver1.2%
    Ottawa–Gatineau0.9%
    Montréal-0.9%

    Download this graphic (SVG, with source)

    Housing: prices falling, supply still arriving

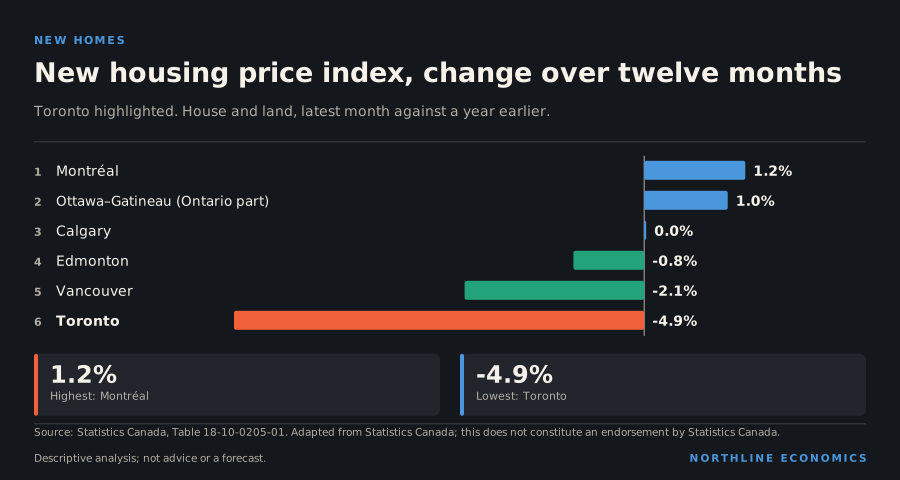
    New-home prices changed -4.9% in the twelve months to September 2026, the largest fall of the six, yet 88,108 homes were under construction, the most of the six and more than Vancouver's 61,680, and builders started 1,440 homes that month. Two-bedroom rents in purpose-built buildings averaged C$2,045 in the October 2025 survey, second highest after Vancouver, with a vacancy rate of 3.0%. Consumer prices rose 2.1% in the twelve months to September 2026, the lowest of the six.

    New housing price index, change over twelve monthsNew housing price index, change over twelve months. Montréal 1.2%; Ottawa–Gatineau (Ontario part) 1.0%; Calgary 0.0%; Edmonton -0.8%; Vancouver -2.1%; Toronto -4.9%.NEW HOMESNew housing price index, change over twelve monthsToronto highlighted. House and land, latest month against a year earlier.1Montréal1.2%2Ottawa–Gatineau (Ontario part)1.0%3Calgary0.0%4Edmonton-0.8%5Vancouver-2.1%6Toronto-4.9%1.2%Highest: Montréal-4.9%Lowest: TorontoSource: Statistics Canada, Table 18-10-0205-01. Adapted from Statistics Canada; this does not constitute an endorsement by Statistics Canada.NORTHLINE ECONOMICSDescriptive analysis; not advice or a forecast.
    The data behind this graphic
    New housing price index, change over twelve months
    ItemValue
    Montréal1.2%
    Ottawa–Gatineau (Ontario part)1.0%
    Calgary0.0%
    Edmonton-0.8%
    Vancouver-2.1%
    Toronto-4.9%

    Download this graphic (SVG, with source)

    Output

    Gross domestic product at basic prices was C$522.4 billion in 2022, the largest of the six, 28.9% above five years earlier in current dollars. Manufacturing shipments in August 2026 were 11.6% above a year earlier.

    What it means for decisions

    For a builder or lender, falling new-home prices with a very large pipeline under construction is the central fact; the data cannot say how many of the units are for sale, for rent or already sold. For a business, the customer base did not grow in the year to July 2025, and the labour market has improved since. For a household, rents are second highest of the six and inflation is the lowest.

    What the data cannot say: they do not show resale prices, wages, the type of units under construction or the reasons for the fall in non-permanent residents; the survey is a sample. Nothing here is a forecast.

    1. Jobs: 3.8 million people are employed, the largest of the six large metros, 1.9% more than a year ago; unemployment is 7.1%. The employment rate, 62.2%, is 4th of 6 among the six. Labour
    1. Prices: inflation is 2.1%, 6th of 6 among the six metros. The city index is held here for all items only. Prices
    1. People: the population changed 0.0% in the year to July 2025, 6th of 6 among the six metros. Over the later four quarters to 1 July 2026 Ontario grew 0.3% against 1.5% in Alberta. Population
    1. Housing: new-home prices changed -4.9% in the twelve months to September 2026 and -8.5% since February 2022, with 88,108 homes under construction. CMHC says Toronto still needs to raise annual starts by at least 50%. Housing
    1. Industry: manufacturing shipments were C$12.7 billion in August 2026, the largest of the six metros, up 11.6% on a year earlier. Petroleum products are only 2.5% of them. Industry
    1. Connections: oil prices and Toronto employment are associated to about the same degree as in Calgary (r = 0.37), which shows how little that test can tell. Connections

    Prepared with AI assistance.

    Follow the relationships

    Upcoming releases

    Sources for this section (11 datasets, 1 documents)

    Data

    Documents cited

    Each dataset is used under its licence; attribution and series-level detail are in each chart’s “About this data” panel. Limitations: Metropolitan labour series are sample-survey estimates, three-month averages, and move more than provincial ones. Output is annual, in current dollars and about four years old; migration series cover the twelve months from July 1 of the year shown; both are updated once a year, and the figures for 2024-25 were published before Statistics Canada revised its non-permanent resident estimates back to July 2021 in September 2026. Rankings compare only these six metropolitan areas. No wages, resale prices, commercial real estate or investment records are held for the metropolitan areas.

    0.5 · Output and economic size

    How large is the Toronto economy, and how fast has it grown?

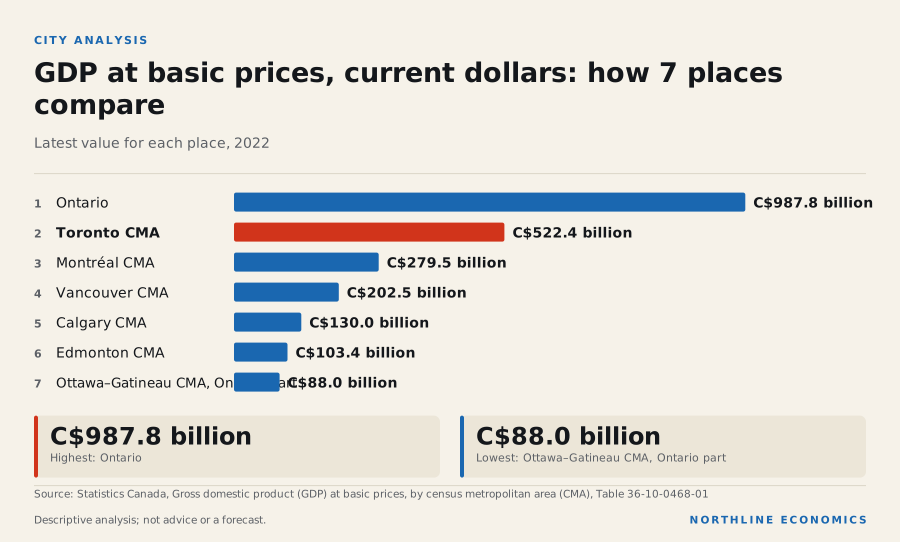
    Toronto's economy was worth C$522.4 billion in 2022, 52.9% of Ontario's output, and ranked 1st of 6 by size among the six large metropolitan areas

    Graphic: GDP at basic prices, current dollars: how 7 places compareGDP at basic prices, current dollars: how 7 places compare. Ontario C$987.8 billion; Toronto CMA C$522.4…

    What happened

    At basic prices and in current dollars, the Toronto economy produced C$522.4 billion of output in 2022, the latest reference year in Statistics Canada's table, equal to 52.9% of Ontario's total of C$987.8 billion. Among the six large metropolitan areas it ranked 1st of 6 by size.

    Measured in current dollars, output was 85.0% higher in 2022 than in 2009 and 18.1% higher than in 2019. Ontario as a whole was 77.2% higher than in 2009 and 18.5% higher than in 2019. Over the same period since 2009 the other metropolitan areas grew 72.4% in Calgary, 54.6% in Edmonton, 98.1% in Vancouver, 75.3% in Montréal and 61.1% in Ottawa–Gatineau (Ontario part).

    GDP at basic prices by metropolitan area, indexed

    Annual, current dollars (so prices and population growth are included); 2009 = 100. Statistics Canada table 36-10-0468-01; the reference year lags the present by about three and a half years. Ottawa–Gatineau is published in an Ontario and a Quebec part and is not shown.

    Chart loads when it comes into view.

    Latest values: Toronto 522,400,000,000 (2022); Calgary 130,000,000,000 (2022); Edmonton 103,400,000,000 (2022); Vancouver 202,500,000,000 (2022); and 2 more in the data table.

    Why it happened

    Not assessed. The table is in current dollars, so these changes include price increases, and it is not divided by population, so the figures do not separate growth in the number of people from growth in output per person. This section reports the data; attributed explanations of the differences are in the economic story and local-economy sections of this page.

    Why it matters

    GDP at basic prices is the broadest measure of local production that Statistics Canada publishes for metropolitan areas. It shows how large the local economy is and how its share of the provincial total compares, but not who earns the income, what is produced, or how the economy is doing now.

    History

    The series starts in 2009 and ends in 2022. A fall in output in any year in between would show in the chart; no year-by-year explanation is offered here.

    Across geographies

    Historical context

    The six series are comparable with each other because they come from one table with one definition and one price basis. The metropolitan totals sum, together with the areas outside metropolitan areas, to the provincial totals in the same table, which is why the provincial share above is exact for the reference year; the Statistics Canada footnote notes that there may be a lag between the metropolitan figures and the latest available provincial measures.

    Evidence: Statistics Canada: Table 36-10-0468-01: Gross domestic product (GDP) at basic prices, by census metropolitan area (CMA)

    What it influences

    Not assessed. No relationship in the recorded graph links metropolitan output to another variable.

    Risks

    The table ends in 2022 and describes nothing since; it cannot show the effects of recent changes in interest rates, trade policy, population or commodity prices on Toronto.

    What to watch

    Statistics Canada's next release of table 36-10-0468-01. No release date for it is in the calendar this site holds, and none is assumed.

    Prepared with AI assistance.

    Follow the relationships

    Sources for this section (1 datasets, 1 documents)

    Data

    Documents cited

    Each dataset is used under its licence; attribution and series-level detail are in each chart’s “About this data” panel. Limitations: Annual, current dollars, GDP at basic prices; the latest reference year lags the present by almost four years. Not adjusted for inflation or population. Industry detail is not part of the table. Metropolitan areas follow Statistics Canada 2021 boundaries.

    0.5 · The Toronto economy: a tariff shock, a population stall and a housing reset

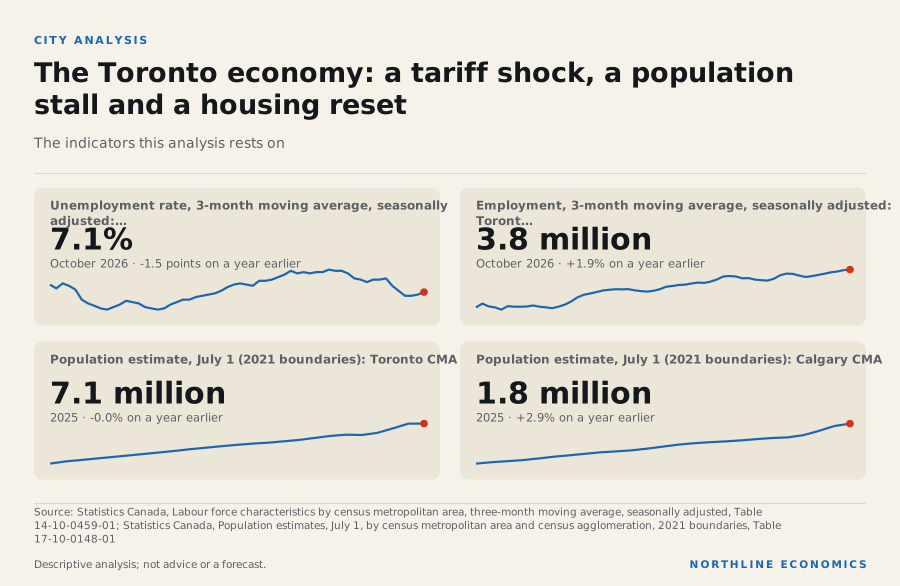
    What explains the slowdown in Toronto's economy, and which parts of it are cyclical, policy-driven or structural?

    Toronto's population was unchanged in the year to July 2025 after a record gain a year earlier, and Ontario's independent fiscal watchdog says the province went through a technical recession from late 2025 to early 2026

    Graphic: The Toronto economy: a tariff shock, a population stall and a housi…The Toronto economy: a tariff shock, a population stall and a housing reset. Unemployment rate, 3-month…

    What happened

    Toronto's unemployment rate was 7.1% in October 2026 and employment was 3.8 million, 1.9% on a year earlier. The metropolitan population changed 0.0% in the year to July 2025, against 2.9% in Calgary and 3.1% in Edmonton. Housing starts over the twelve months to September 2026 were 23,355. The average two-bedroom rent in purpose-built rental apartments was C$2,045 in the October 2025 survey, with a vacancy rate of 3.0%, up from 2.5% the year before.

    Why it happened

    Historical context

    The Financial Accountability Office of Ontario says Ontario's real GDP growth slowed from 1.6 per cent in 2024 to 1.3 per cent in 2025 as US tariffs hindered Ontario's exports and machinery and equipment investment while residential investment continued to fall, and that resilient household spending and stronger non-residential and government capital investment helped support growth. Statistics Canada's revised market-price series at 2017 constant prices, released on 5 November 2026, shows Ontario's growth at 1.8% in 2025.

    Evidence: Financial Accountability Office of Ontario: Economic and Budget Outlook, Summer 2026

    Historical context

    A later FAO report says Ontario experienced a modest technical recession from the fourth quarter of 2025 to the first quarter of 2026, and that several challenges have caused the economy to struggle over the past year, including US tariffs, a declining population and elevated geopolitical uncertainty.

    Evidence: Financial Accountability Office of Ontario: Ontario Economic Monitor: January to June 2026

    Historical context

    The City of Toronto's 2025 employment survey, which counts jobs inside the city boundary rather than the metropolitan area, reports that goods-producing industries declined by 4.6 per cent, that film production, construction and manufacturing were the most negatively affected industries, and that the majority of goods-producing employment is tariff-exposed.

    Evidence: City of Toronto, City Planning: Toronto Employment Survey Bulletin 2025

    Historical context

    Statistics Canada reports that the Toronto area's population was virtually unchanged from July 2024 to July 2025 after record growth a year earlier, that the gains from births and immigrants were offset by deaths, a net loss of non-permanent residents, net emigration and net losses to other provinces and to the rest of Ontario, and that the net loss in non-permanent residents was by far the main contributor to the slowdown. The same components are in the population section: immigrants were 115 thousand and the net change in non-permanent residents -45 thousand in the twelve months from July 2024, against 228 thousand a year earlier.

    Evidence: Statistics Canada: The Daily: Canada's population estimates: Subprovincial areas, 2025

    Historical context

    The FAO says Ontario's population decreased by 0.7 per cent in the first quarter of 2026 compared with a year earlier, the first decrease on records back to 1951, and attributes it to a significant outflow of non-permanent residents and fewer new permanent residents. Statistics Canada has since revised its non-permanent resident estimates, and its current series shows no fall from a year earlier in that quarter; it shows Ontario up 0.3% over the four quarters to 1 July 2026.

    Evidence: Financial Accountability Office of Ontario: Ontario Economic Monitor: October 2025 to March 2026; Statistics Canada: The Daily: Canada's population estimates, second quarter 2026

    Why it matters

    Historical context

    CMHC's fall 2026 Housing Supply Report says that in the City of Toronto only 156 condominium units were started in the first half of 2026 against an average of 7,000 a year over the previous decade, that new condominium construction collapsed amid weak presales, poor investor demand and high resale supply, and that purpose-built rental starts rose 82 per cent from 2025, the only category in which starts grew, with support from government financing programs, municipal incentives and the conversion of some proposed condominium projects to rental.

    Evidence: Canada Mortgage and Housing Corporation: Fall 2026 Housing Supply Report

    Historical context

    CMHC's rental reports say the Greater Toronto Area's vacancy rate rose, driven by declining international migration, competition from rented condominium apartments and a softer economy, and that asking rents for available units are continuing to decline in Toronto, Vancouver and Calgary.

    Evidence: Canada Mortgage and Housing Corporation: Rental Market Report 2025: major centres (web edition); CMHC: 2026 Mid-Year Rental Market Update

    Historical context

    CMHC adds that the easing is more noticeable in larger markets such as Toronto and Vancouver, which are more affected by slower population growth and a larger supply of condominiums in secondary rental markets.

    Evidence: CMHC: Summer Update: 2026 Housing Market Outlook

    Opinion

    Read together, these statements describe a city whose recent housing demand was tied to migration that has reversed and whose pipeline is shifting from owned to rented homes; Northline's data show the rent and vacancy changes but not how many of the people who left were renters.

    History

    Toronto's unemployment rate has ranged from 5.3% (January 2020) to 15.1% (July 2020) over ten years.

    Historical context

    Statistics Canada's single-month estimates, not the three-month average above, put Toronto's unemployment rate at 7.4 per cent in October 2026, up from 7.2 per cent in September and 6.7 per cent in August, and below a recent high of 9.0 per cent in July 2025. Over ten years Toronto's population grew 17.6%.

    Evidence: Statistics Canada: Labour Force Survey, October 2026, Table 8: labour force characteristics by Montréal, Toronto and Vancouver census metropolitan areas, monthly, seasonally adjusted; Statistics Canada: Labour Force Survey, August 2026

    Across geographies

    Among the six large metropolitan areas Toronto's latest population change ranks 6th of 6.

    Historical context

    For Ontario as a whole the FAO reports that the unemployment rate fell from 7.5 per cent in the first quarter of 2026 to 7.2 per cent in the second, the lowest in nearly two years, and that the second-quarter employment gains were largest in health care, finance, insurance and real estate, and manufacturing, partly offset by losses in wholesale and retail trade and construction.

    Evidence: Financial Accountability Office of Ontario: Ontario Economic Monitor: January to June 2026

    Historical context

    CMHC says historically low levels of construction will be most visible in Ontario and British Columbia, particularly in the condominium market, and that those two provinces are likely to see the weakest home-price growth because of slower population growth, affordability challenges and higher supply.

    Evidence: CMHC: Summer Update: 2026 Housing Market Outlook

    What it influences

    Historical context

    The Government of Ontario's 2026 budget says its ten-year capital plan totals more than 210 billion dollars, including about 63 billion dollars for public transit, and lists the Ontario Line, the Scarborough Subway Extension, the Eglinton Crosstown West Extension and the Yonge North Subway Extension as part of the largest subway expansion in Canadian history. These are plans; the budget does not report their construction status.

    Evidence: Government of Ontario, Ministry of Finance: 2026 Ontario Budget: Ontario's Economic and Fiscal Outlook in Brief

    Risks

    Historical context

    In its March 2026 budget the Province said global trade tensions and the associated uncertainty were the main risks to Ontario's outlook, and modelled a slower-growth scenario in which the United States withdraws from the Canada-United States-Mexico Agreement.

    Evidence: Government of Ontario, Ministry of Finance: 2026 Ontario Budget, Chapter 2: Economic Performance and Outlook

    Historical context

    The Bank of Canada's third-quarter business survey, which is national, says results collected after the breakdown in Canada-US trade negotiations on August 21 suggest that new US tariffs and Canadian counter-tariffs are weighing on firms' outlooks.

    Evidence: Bank of Canada: Business Outlook Survey - Third Quarter of 2026

    Historical context

    City of Toronto planning staff say that for Toronto the trends imply moderate employment gains but also the risk that population growth will continue to outpace job creation.

    Evidence: City of Toronto, City Planning: Toronto Employment Survey Bulletin 2025

    What to watch

    Historical context

    In its fall outlook of 29 October 2026 the Government of Ontario projects real GDP growth of 0.5 per cent in 2026 and 1.5 per cent in 2027, down from 1.0 per cent for 2026 in its March budget. The FAO's September projection, made before that outlook, was 0.6 per cent in 2026 and 1.5 per cent in 2027; the FAO said its gap with the budget reflected more current data showing a technical recession. Both now project a 2026-27 deficit of 16.9 billion dollars; the Province expects a small surplus in 2029-30, while the FAO does not project a balanced budget over its outlook. These are the publishers' projections, not Northline's. Statistics Canada's monthly Labour Force Survey, CMHC's monthly starts and the next population estimates (release calendar) will show which view is closer.

    Evidence: Government of Ontario, Ministry of Finance: 2026 Ontario Economic Outlook and Fiscal Review: Backgrounder: Economic and Fiscal Overview; Government of Ontario, Ministry of Finance: 2026 Ontario Budget: Ontario's Economic and Fiscal Outlook in Brief; Financial Accountability Office of Ontario: Economic and Budget Outlook, Summer 2026

    Prepared with AI assistance.

    Follow the relationships

    Upcoming releases

    Sources for this section (8 datasets, 16 documents)

    Data

    Documents cited

    Each dataset is used under its licence; attribution and series-level detail are in each chart’s “About this data” panel. Limitations: Every explanation here is a statement by the named organisation. City of Toronto statements describe the municipal boundary, CMHC's rental statements the Greater Toronto Area, and Ontario statements the province; each is said where it is used. Metropolitan wages, GDP by industry and productivity are not held, so those parts of the story are not told. Forecasts are the publishers' and are not Northline forecasts.
    0.6 · Toronto's local economy: a finance, services and tech core, a manufacturing and logistics belt around it, and a build-out now meeting a housing and migration reset

    Who and what are the local drivers of the Toronto economy, which large projects are under way, and where do the sources describe only the City, the Greater Toronto Area or Ontario?

    Toronto's jobs are concentrated in offices (the City counts half of its jobs as office work) while the wider region's manufacturing, airport and goods-movement belt carries the tariff exposure; the condominium pipeline, the migration inflow and the auto sector are the three places the sources show strain

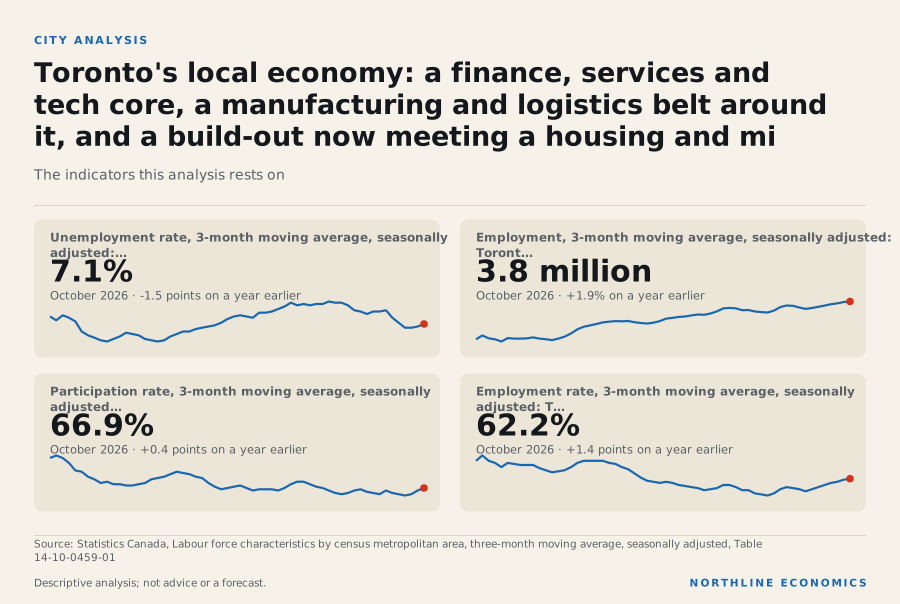
    Graphic: Toronto's local economy: a finance, services and tech core, a manuf…Toronto's local economy: a finance, services and tech core, a manufacturing and logistics belt around it,…

    What happened

    In the 2021 Census, 2.7 million jobs were located in the Toronto metropolitan area. Professional, scientific and technical services accounted for 13.8% of them, health care and social assistance 11.1% and retail trade 10.5%. Finance and insurance was 9.3%, manufacturing 9.5%, transportation and warehousing 5.0%, construction 3.7% and public administration 4.6%.

    Today the unemployment rate (three-month average) is 7.1% for October 2026, employment is 3.8 million, the participation rate is 66.9% and the employment rate is 62.2%. Among the six large areas Toronto's unemployment rate is level with Edmonton's and Ottawa-Gatineau's as the highest, at 7.1%; the others are Montréal 6.9%, Vancouver 6.7% and Calgary 6.6%. Census shares are a 2021 snapshot of where people work, not a list of employers; the rest of this section uses organisations' own statements to say what sits behind them.

    Why it happened

    Finance, professional services and offices

    Historical context

    The City of Toronto's 2025 employment survey, which counts jobs inside the city boundary, says half of all jobs in the city are in four sectors: health care and social assistance, finance and insurance, professional, scientific and technical services, and wholesale and retail trade. It counts 813,120 office jobs, or 50.1 per cent of the city's total.

    Evidence: City of Toronto, City Planning: Toronto Employment Survey Bulletin 2025

    Historical context

    Toronto Global, a regional investment-attraction agency, says all five of Canada's largest banks are headquartered in the Toronto Region and that 41 international banks have their Canadian head offices there; it also says the region has 10,000 financial service businesses employing over 270,000 workers. These are promotional figures for a region Toronto Global does not define on the page, and the sector definition is the agency's own.

    Evidence: Toronto Global: Financial Services (Toronto Region)

    Historical context

    The same agency calls Toronto the second-largest financial centre in North America, after New York; no independent ranking is cited.

    Evidence: Toronto Global: Toronto Region Quick Facts

    Technology and artificial intelligence

    Historical context

    Toronto Global says the region's tech industry is powered by over 285,000 skilled workers and that over 40 per cent of Canada's artificial intelligence firms are in the region. It cites the CBRE Scoring Tech Talent Report for tech job growth of 14.7 per cent between 2021 and 2024, third-highest in North America.

    Evidence: Toronto Global: Technology (Toronto Region); Toronto Global: Artificial Intelligence (Toronto Region)

    Historical context

    The agency's own pages rank the region differently: third-largest tech sector behind the Bay Area and New York City (quick-facts page), third-largest pool of tech workers after the San Francisco Bay Area and New York (technology page, citing the 2023 report), and third as a talent market behind only the San Francisco Bay Area and Seattle (AI page, citing the 2024 report). The reports themselves are not cited, and the pages do not reconcile the difference.

    Evidence: Toronto Global: Toronto Region Quick Facts; Toronto Global: Technology (Toronto Region); Toronto Global: Artificial Intelligence (Toronto Region)

    Opinion

    Hypothesis, not tested here: a large tech and AI workforce would plausibly support demand for office space and high-wage services. No source held gives Toronto-CMA tech employment, wages or output, so the size of that effect is unknown.

    Manufacturing and autos in the wider region

    Historical context

    A summary of a Deloitte report commissioned by the Greater Toronto Airports Authority says the single largest industry by employment in the Pearson Economic Zone, which spans parts of five municipalities, is manufacturing with nearly 92,500 jobs. The zone is a commissioned, not independent, estimate and is not the Toronto CMA.

    Evidence: Greater Toronto Airports Authority (summary of a Deloitte report it commissioned, filed on the Environmental Registry of Ontario): Canada's Economic Runway: Toronto Pearson Economic Zone

    Historical context

    Toronto Global says Ontario and the Toronto Region have the third-highest number of manufacturing business locations in North America and that Ontario is the only state or province in North America with five automakers' assembly plants.

    Evidence: Toronto Global: Advanced Manufacturing (Toronto Region)

    Historical context

    The Prime Minister said on 21 October 2026 that more than 120,000 people work in making cars and trucks in Ontario, that Ontario builds more than one million vehicles a year, and that Canada's auto exports to the United States have declined by more than 10 per cent. He announced a joint federal-Ontario action plan worth 9 billion dollars, including more than 5 billion for steel mills in Hamilton and Sault Ste. Marie and two and a half billion for auto assembly lines. These are a government's statements of intent.

    Evidence: Prime Minister of Canada: Prime Minister Carney and Premier Ford launch new action plan to protect workers from tariffs and strengthen Ontario industries

    Historical context

    In October 2025 the federal Department of Finance cut the import-remission quotas of General Motors by 24.2 per cent and Stellantis by 50 per cent, citing GM's reduced production in Oshawa and Ingersoll and Stellantis' cancelled plans for its Brampton plant.

    Evidence: Department of Finance Canada: Canada takes decisive action to protect auto industry and workers

    Historical context

    Ontario's 2026 budget names Windsor, St. Thomas, Oshawa, Brampton and Oakville as places under workforce and community pressure. Several of these lie outside the City of Toronto and the sources do not say which are in the Toronto CMA.

    Evidence: Government of Ontario: 2026 Ontario Budget, Chapter 1A

    Historical context

    Inside the city boundary, goods-producing employment fell 4.6 per cent in 2025, and 12.8 per cent of employment is in tariff-exposed sectors (down from 13.4 per cent). Manufacturing shipments in the Toronto CMA changed +11.6% in the twelve months to August 2026.

    Evidence: City of Toronto, City Planning: Toronto Employment Survey Bulletin 2025

    Pearson airport, the port and goods movement

    Historical context

    The Greater Toronto Airports Authority reports that Toronto Pearson's passenger volume rose 1.1 per cent to 47.3 million in 2025, with domestic growth partly offset by a marginal decrease in international traffic, and says it is watching tariff pressures that create economic uncertainty.

    Evidence: Greater Toronto Airports Authority: GTAA reports 2025 annual results

    Historical context

    The commissioned Deloitte summary says the Pearson Economic Zone added 100,000 jobs from 2016 to 2024, has vacancy below 1 per cent, generates 7 per cent of Ontario's GDP, and faces a chronic shortage of industrial and commercial land. The airport expects 65 million passengers a year by the early 2030s.

    Evidence: Greater Toronto Airports Authority (summary of a Deloitte report it commissioned, filed on the Environmental Registry of Ontario): Canada's Economic Runway: Toronto Pearson Economic Zone

    Historical context

    The Toronto Port Authority says the Port of Toronto handled more than 2.16 million tonnes of cargo in 2025 on 167 vessels, mainly bulk imports, and that marine shipping generates over 670 directly related jobs (an impact study figure the page dates to 2023).

    Evidence: Toronto Port Authority: About the Port of Toronto

    Opinion

    Gap: no source cited gives the Port of Hamilton's or Toronto Pearson's own figures, or rail intermodal (CN, CPKC) volumes, so the goods-movement picture rests on a commissioned report and one port.

    City economic strategy and Toronto Global

    Historical context

    The City says Council adopted a 10-year economic action plan, Sidewalks to Skylines, in November 2024, with 73 actions, 29 of them leading actions; further actions arising from the Mayor's tariff response and an inclusive-development framework have been integrated into it. It names economic polarization as a key challenge.

    Evidence: City of Toronto: Sidewalks to Skylines: A 10-Year Action Plan for Toronto’s Economy

    Historical context

    A July 2025 City report recommended a strategy to advance productivity and protect manufacturing and industrial jobs, a time-limited enhancement of an employment-growth incentive, and priority review of industrial and manufacturing applications. The sources cited do not say whether the strategy was delivered.

    Evidence: City of Toronto: Mayor’s Economic Action Plan in Response to US Tariffs – Update to Council

    Historical context

    Toronto Global describes itself as the first point of contact for international businesses expanding into the region and says it has given concierge services to almost 350 companies. The sources cited do not give its funding, targets or results.

    Evidence: Toronto Global: Toronto Global (home page)

    Why it matters

    Office market

    Historical context

    The City's June 2026 development report says downtown office vacancy fell from 13.6 to 11.6 per cent between the fourth quarters of 2024 and 2025, against 1 per cent in 2019. It attributes the rise since 2019 to hybrid work and large new office completions, and says return-to-office mandates from major financial institutions and governments have renewed demand. Office transactions in 2025 were down 60 per cent from 2023, and proposed non-residential floor area fell by more than a million square metres from 2024.

    Evidence: City of Toronto, City Planning: Toronto Development Pipeline 2025 (profile TORONTO)

    Historical context

    The employment survey counts 664,650 downtown jobs, 40.9 per cent of the city's total, and lists the Ontario Public Service, the major banks and Rogers among employers announcing return-to-office mandates.

    Evidence: City of Toronto, City Planning: Toronto Employment Survey Bulletin 2025

    Immigration and reliance on non-permanent residents

    Historical context

    Statistics Canada reports that the Toronto area's population was virtually unchanged from July 2024 to July 2025 and that the net loss of non-permanent residents was by far the main contributor to the slowdown. Immigrants were 115 thousand and the net change in non-permanent residents -45 thousand in the twelve months from July 2024, against 228 thousand a year earlier.

    Evidence: Statistics Canada: The Daily: Canada's population estimates: Subprovincial areas, 2025

    Historical context

    The Financial Accountability Office of Ontario says Ontario's population was 0.7 per cent lower in the first quarter of 2026 than a year earlier, the first decrease on records back to 1951, because of an outflow of non-permanent residents and fewer new permanent residents. Statistics Canada has since revised its non-permanent resident estimates, and its current series shows no fall from a year earlier in that quarter; it shows Ontario up 0.3% over the four quarters to 1 July 2026.

    Evidence: Financial Accountability Office of Ontario: Ontario Economic Monitor: October 2025 to March 2026; Statistics Canada: The Daily: Canada's population estimates, second quarter 2026

    Historical context

    Immigration, Refugees and Citizenship Canada's plan of November 2025 set new temporary-resident arrivals of 385,000 in 2026 and a temporary population below 5% of the total by the end of 2027. Its 2027-2029 plan, released on 5 November 2026, sets 370,000 new temporary-resident arrivals and 380,000 permanent-resident admissions a year. These targets are national.

    Evidence: Immigration, Refugees and Citizenship Canada: Supplementary Information for the 2026-2028 Immigration Levels Plan; Immigration, Refugees and Citizenship Canada: Supplementary Information for the 2027-2029 Immigration Levels Plan

    Opinion

    Hypothesis, not tested here: if temporary-resident inflows stay at these levels, the migration-driven demand that supported rental and retail activity would not return to 2023-24 levels. The sources do not give Toronto's share of the national targets.

    Housing affordability and the condominium downturn

    Historical context

    The City says new condominium sales averaged almost 13,800 units a year from 2013 to 2022, against just 689 in 2025, and that condominium starts in 2025 were 79 per cent below their ten-year average while purpose-built rental starts were 62 per cent above. It describes the new-condo market as at a standstill, with prices "still too high to buy and not high enough to build".

    Evidence: City of Toronto, City Planning: Toronto Development Pipeline 2025 (profile TORONTO)

    Historical context

    CMHC counts only 156 condominium starts in the City of Toronto in the first half of 2026, against an average of 7,000 a year over the previous decade (see the housing section); the City's report and CMHC measure different periods and areas and are not reconciled here. Over twelve months the Toronto CMA started 23,355 homes and new-home prices changed -4.9% in the twelve months to September 2026.

    Evidence: Canada Mortgage and Housing Corporation: Fall 2026 Housing Supply Report

    Historical context

    The Toronto Regional Real Estate Board, an industry association, reports that GTA home sales in October 2026 were down 7.9 per cent from a year earlier, its benchmark price index was down 4.3 per cent and the average price was 1,024,108 dollars, down 2.7 per cent. This covers the whole GTA, not the City.

    Evidence: Toronto Regional Real Estate Board (industry association): Market Watch, October 2026

    Historical context

    In July 2026 the Bank of Canada's Governing Council said a recovery in housing activity could stall given the large inventory of condos in Toronto and Vancouver, low population growth and affordability challenges, and the Bank's May 2026 Financial Stability Report says mortgage stress is most acute among Toronto-area borrowers who took out a mortgage in 2022–23. Its October 2026 Monetary Policy Report says housing activity remains weak.

    Evidence: Bank of Canada: Summary of Governing Council deliberations: Fixed announcement date of July 15, 2026; Bank of Canada: Financial Stability Report 2026: Households (22 May 2026); Bank of Canada: Monetary Policy Report, October 2026: Current conditions

    History

    Historical context

    Statistics Canada's single-month estimates put Toronto's unemployment rate at 7.4 per cent in October 2026, up from 7.2 per cent in September and 6.7 per cent in August, and below a recent high of 9.0 per cent in July 2025. Those monthly figures and the three-month average above are different measures.

    Evidence: Statistics Canada: Labour Force Survey, October 2026, Table 8: labour force characteristics by Montréal, Toronto and Vancouver census metropolitan areas, monthly, seasonally adjusted; Statistics Canada: Labour Force Survey, August 2026

    Historical context

    For Ontario in October 2026 the agency reports that employment was little changed for a third consecutive month and that the unemployment rate rose to 7.3 per cent in the month but was lower than a year earlier.

    Evidence: Statistics Canada: Labour Force Survey, October 2026 (The Daily)

    Across geographies

    Labour data for Hamilton and Kitchener-Cambridge-Waterloo are in their own reports; Oshawa and the other Greater Golden Horseshoe areas are not held, so the wider-region claims rest on the sources named in each paragraph. Toronto Global's "Toronto Region", the airport's economic zone, the real estate board's GTA and the City differ from the CMA and from one another.

    What it influences

    Transit and infrastructure megaprojects

    Historical context

    Metrolinx says Line 5 Eglinton, a 19-kilometre line from Mount Dennis to Kennedy, is open to the public; the TTC began an introductory service period on 8 February 2026 and had not yet announced full service in the pages cited.

    Evidence: Metrolinx: Line 5 Eglinton now open; Toronto Transit Commission: TTC to begin phased start to service on Line 5 Eglinton

    Historical context

    Metrolinx says construction of the 15.6-kilometre Ontario Line is under way, with tunnelling for the downtown segment beginning in April 2026, and lists ridership of 388,000 daily boardings without saying whether that is a forecast. Infrastructure Ontario lists a 9 billion dollar contract for trains, systems and 30 years of operation and maintenance and a 6 billion dollar southern civil contract. These are contract values, not a total project cost, and they come from 2022 award pages.

    Evidence: Metrolinx: Ontario Line (project page); Infrastructure Ontario: Ontario Line - Rolling Stock, Systems, Operations and Maintenance; Infrastructure Ontario: Ontario Line - Southern Civil, Stations and Tunnel project

    Historical context

    The Eglinton Crosstown West Extension is 9.2 kilometres from Mount Dennis to Renforth Drive; Metrolinx says construction is under way, the second tunnelling contract was complete in August 2026, and options to extend to Pearson are being explored with the airport authority.

    Evidence: Metrolinx: Eglinton Crosstown West Extension (project page)

    Opinion

    No source held measures the output or job effect of these projects, and the Metrolinx pages give projections without stating their basis; none are quoted as results.

    Employers expanding and contracting

    Historical context

    Inside the City, the survey shows office employment growing by 23,870 jobs while goods-producing industries, led by film production, construction and manufacturing, shrank. Outside it, the sources describe General Motors and Stellantis reducing production at Oshawa, Ingersoll and Brampton. No source held ranks Toronto's largest employers or lists announced hiring or layoffs by firm.

    Evidence: City of Toronto, City Planning: Toronto Employment Survey Bulletin 2025; Department of Finance Canada: Canada takes decisive action to protect auto industry and workers

    Structural challenges

    Historical context

    City planning staff warn that population growth could continue to outpace job creation, pressing on the unemployment rate and per-capita income.

    Evidence: City of Toronto, City Planning: Toronto Employment Survey Bulletin 2025

    Historical context

    Other stated constraints are a shortage of industrial and commercial land near the airport and economic polarization, which the City calls a key challenge.

    Evidence: Greater Toronto Airports Authority (summary of a Deloitte report it commissioned, filed on the Environmental Registry of Ontario): Canada's Economic Runway: Toronto Pearson Economic Zone; City of Toronto: Sidewalks to Skylines: A 10-Year Action Plan for Toronto’s Economy

    Opinion

    Reading the sources together, Toronto's recent growth rested on three things that have each weakened at once: migration inflows, condominium construction, and cross-border auto and metals trade. The sources do not measure how far these overlap, so no causal chain is claimed.

    Risks

    Historical context

    For Ontario the FAO says growth slowed as US tariffs hindered exports and machinery investment, and that the province's manufacturing sector faces significant pressure; see the story section. The Bank of Canada's national survey adds that some firms are reducing investment in Canada or shifting it abroad, especially in steel and autos where tariffs favour US expansion projects.

    Evidence: Financial Accountability Office of Ontario: Economic and Budget Outlook, Summer 2026; Bank of Canada: Business Outlook Survey - Third Quarter of 2026

    What to watch

    Medium- and long-term prospects, as the sources frame them, depend on identifiable things. The airport's early-2030s passenger expectation depends on land and terminal investment. The Ontario Line and the Crosstown extension depend on construction milestones that Metrolinx reports; the sources cited give no current opening date. Office demand depends on how return-to-office mandates compare with new supply, which the City expects to be limited in 2027 to 2029. The labour market depends on the federal-provincial auto and steel measures and on the course of US tariffs. The 2027-2029 Immigration Levels Plan, released on 5 November 2026, sets the national targets for the next three years, and Statistics Canada's monthly labour survey, CMHC starts and the next population estimates will show which way these go.

    Not covered by the sources cited, and so not described here: Toronto-CMA wages by industry, a Toronto largest-employer ranking, Toronto Global's funding and results, the City's manufacturing strategy outcome, CN and CPKC intermodal volumes, Port of Hamilton volumes, Pearson's own annual economic-impact study, Ontario Line total cost and opening date, and Oshawa labour data.

    Prepared with AI assistance.

    Follow the relationships

    Upcoming releases

    Sources for this section (7 datasets, 37 documents)

    Data

    Documents cited

    Each dataset is used under its licence; attribution and series-level detail are in each chart’s “About this data” panel. Limitations: Every explanation here is a statement by the named organisation. Boundaries differ and are said where used: City of Toronto (municipal boundary), the Toronto census metropolitan area (CMA), the Greater Toronto Area (CMHC and the real estate board), the Toronto Region (Toronto Global's promotional term), the Pearson Economic Zone (five municipalities) and Ontario. Toronto Global, the Greater Toronto Airports Authority (including a Deloitte report it commissioned) and the Toronto Region Real Estate Board are promoters or trade bodies and are labelled as such. Toronto Pearson's own site and the Port of Hamilton page are not cited, and no official source cited gives a Toronto-CMA wage series, a largest-employer ranking, Oshawa labour data, Toronto Global's funding or results, or a current Ontario Line total cost and opening date. Census industry shares are for 2021 and describe jobs by place of work. Forecasts are the publishers' and are not Northline forecasts.
    1 · Labour market

    Is Toronto's labour market keeping pace with the other large metropolitan areas?

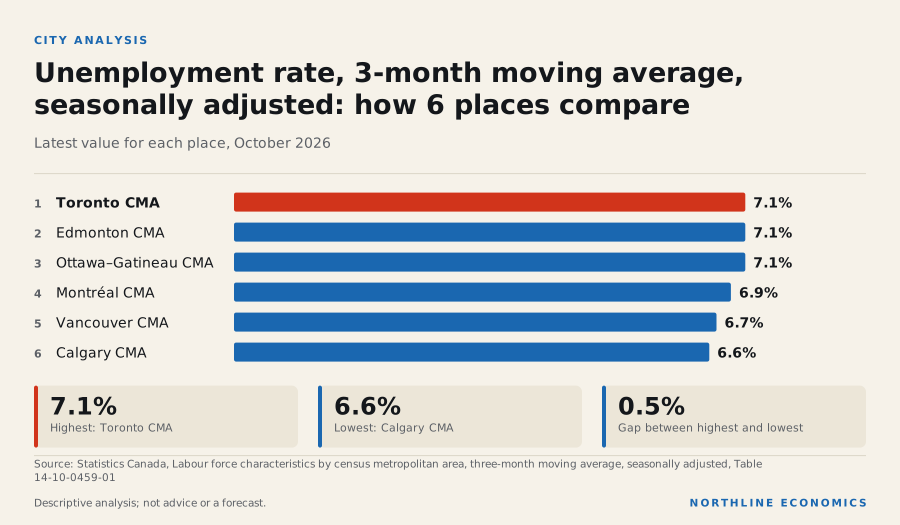
    In October 2026, Toronto had 3.8 million workers, employment was up 1.9% on a year earlier and unemployment was 7.1%, with 62.2% of adults employed

    Graphic: Unemployment rate, 3-month moving average, seasonally adjusted: how…Unemployment rate, 3-month moving average, seasonally adjusted: how 6 places compare. Toronto CMA 7.1%;…

    What happened

    Toronto's seasonally adjusted unemployment rate (three-month average) was 7.1% in October 2026, from 8.6% a year earlier. Calgary's was 6.6%, Edmonton's 7.1%, Vancouver's 6.7%, Montréal's 6.9% and Ottawa–Gatineau's 7.1%. Employment of 3.8 million is 1.9% higher than a year ago, against 6.2% in Calgary, 1.2% in Vancouver and -0.9% in Montréal.

    Unemployment rate by metropolitan area

    Percent, three-month moving average, seasonally adjusted. Census metropolitan areas only; do not compare with provincial monthly rates (different smoothing).

    Chart loads when it comes into view.

    Latest values: Toronto 7.1 (2026-10); Calgary 6.6 (2026-10); Edmonton 7.1 (2026-10); Vancouver 6.7 (2026-10); and 2 more in the data table.

    Employment by metropolitan area, indexed

    Three-month moving average, seasonally adjusted; start of period = 100.

    Chart loads when it comes into view.

    Latest values: Toronto 3,792,000 (2026-10); Calgary 1,053,000 (2026-10); Edmonton 889,000 (2026-10); Vancouver 1,705,000 (2026-10); and 2 more in the data table.

    The participation rate is 66.9% and the employment rate 62.2% (4th of 6 among the six areas, against 66.7% in Calgary and 63.4% in Vancouver).

    Participation rate by metropolitan area

    Percent, three-month moving average, seasonally adjusted.

    Chart loads when it comes into view.

    Latest values: Toronto 66.9 (2026-10); Calgary 71.4 (2026-10); Edmonton 68.7 (2026-10); Vancouver 68 (2026-10); and 2 more in the data table.

    By industry, Statistics Canada's annual Labour Force Survey estimates (table 14-10-0468-01, annual averages, not seasonally adjusted) put average employment in Toronto at 3.7 million in 2025, a change of 1.8% on the year before and of 10.5% since 2019. Goods-producing industries account for 15.8% of employed persons and services-producing industries for 84.2%; among the individual groups, professional, scientific and technical services 14.4%, wholesale and retail trade 13.6%, finance, insurance, real estate, rental and leasing 12.2% and manufacturing 9.3% of employment. The table counts people by the industry of their main job and by where they live, so it is a measure of employment, not of output, wages or the number of businesses. Estimates for a single industry group in one metropolitan area come from a small survey sample and are less steady than the total: Statistics Canada suppresses some cells, and the table is annual, so a one-year move in a small group should not be read as a trend. No sampling-error range is held with these series, so none is quoted; the monthly metropolitan rates above are three-month averages and are noisier than the annual figures. Wages for the metropolitan area are not held here; the Statistics Canada wage tables used cover provinces and Canada.

    Employment in Toronto: goods and services, indexed

    Annual average of employed persons, Labour Force Survey (Statistics Canada table 14-10-0468-01); first year shown = 100. Goods-producing and services-producing sectors against all industries. Annual estimates, not seasonally adjusted.

    Chart loads when it comes into view.

    Latest values: All industries 3,737,000 (2025); Goods-producing sector 590,200 (2025); Services-producing sector 3,147,000 (2025).

    Employment by industry group in fourteen metropolitan areas, 2025

    Share of employed persons living in each metropolitan area who work in each group (annual average, Labour Force Survey; the survey classifies jobs by the industry of the person’s main job, not by where the employer sits). Single-sector estimates for one metropolitan area rest on small samples; a city is left out of a chart where Statistics Canada suppresses the estimate. Shares are computed by this project from Statistics Canada table 14-10-0468-01.

    Chart loads when it comes into view.

    Top values: Kitchener–Cambridge–Waterloo 25.3%; Edmonton 20.8%; Calgary 20%.

    Why it happened

    The data show where Toronto stands, not why. Two comparisons are informative. Since the end of 2019 employment is up 10.9% in Toronto, 27.1% in Calgary and 11.8% in Vancouver. Toronto's employment rate is below Calgary's and Vancouver's even though its job count has grown; the data held here cannot say why.

    Historical context

    Statistics Canada reports that in October employment fell in Alberta and Prince Edward Island, rose in British Columbia and Newfoundland and Labrador, and was little changed in Ontario. That is the provincial picture for Ontario and not a statement about Toronto.

    Evidence: Statistics Canada: Labour Force Survey, October 2026 (The Daily)

    Why it matters

    Toronto's labour market is the largest of the six metropolitan areas in the data. Its employment rate ranks 4th of 6; how many residents work matters for household income and local demand.

    History

    Over ten years Toronto's unemployment rate has averaged 7.5%, with a high of 15.1% in July 2020 and a low of 5.3% in January 2020.

    Across geographies

    Toronto's rate minus Calgary's is 0.5 percentage points. As context, on a different definition (monthly, province-wide), Ontario's unemployment rate is 7.3% and Canada's 6.7%; these must not be read against the metropolitan three-month averages.

    What it influences

    Jobs matter for household income and housing demand in the Toronto region. The relationship explorer lists the national and provincial links that reach the city, each with its evidence class.

    Risks

    Not assessed: the exposure of Toronto's employment to particular industries or to US demand. The annual industry employment shown above describes the mix of jobs, not exposure.

    What to watch

    Statistics Canada's Labour Force Survey (release dates in the calendar).

    Prepared with AI assistance.

    Follow the relationships

    Upcoming releases

    Sources for this section (3 datasets, 1 documents)

    Data

    Documents cited

    Each dataset is used under its licence; attribution and series-level detail are in each chart’s “About this data” panel. Limitations: Metropolitan rates are three-month moving averages from the Labour Force Survey and are noisier than national figures. They are not comparable with provincial or national monthly rates and are never charted with them. Wages and demographic breakdowns for the Toronto metropolitan area are not included; annual employment by industry group (Labour Force Survey, annual averages, with suppressed cells and small-sample variability) is held, but it is not seasonally adjusted and is not output or wages.

    2 · Prices and inflation

    Is inflation in Toronto higher or lower than in the other large cities?

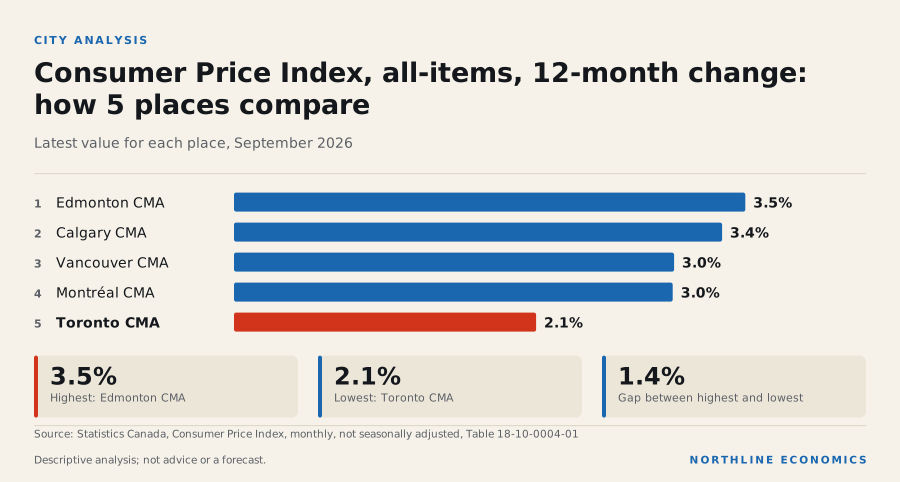
    Toronto's inflation rate was 2.1% in September 2026, 6th of 6 among the six large metros and below the Canadian rate of 3.1%

    Graphic: Consumer Price Index, all-items, 12-month change: how 5 places compareConsumer Price Index, all-items, 12-month change: how 5 places compare. Edmonton CMA 3.5%; Calgary CMA…

    What happened

    Toronto's consumer prices were 2.1% higher in September 2026 than a year earlier, against 3.4% in Calgary, 3.5% in Edmonton, 3.0% in Vancouver and 3.0% in Montréal, and 3.1% for Canada. Toronto's rate is 6th of 6 among the six metropolitan areas.

    Consumer price inflation by city

    12-month change in the all-items CPI (derived). Ottawa–Gatineau is the Ontario part only.

    Chart loads when it comes into view.

    Latest values: Toronto 2.08 (2026-09); Calgary 3.36 (2026-09); Edmonton 3.52 (2026-09); Vancouver 3.03 (2026-09); and 2 more in the data table.

    Why it happened

    Historical context

    Statistics Canada reports that national headline inflation accelerated in September, driven by gasoline and fuel oil, and that excluding energy inflation was highest in Nova Scotia. Only the all-items index is held here for the city, so this report cannot say whether Toronto's lower rate reflects less weight on energy, falling shelter costs or something else. Statistics Canada does note that shelter inflation was held down by falling mortgage interest cost and homeowners' replacement cost nationally, which is a national statement.

    Evidence: Statistics Canada: The Daily: Consumer Price Index, September 2026

    Why it matters

    Toronto's rate is below the national rate. The CPI measures changes in prices, not their level, so a low rate of change says nothing about how expensive the city is.

    History

    Toronto's rate has averaged 2.7% over ten years and peaked at 7.5% in July 2022.

    Across geographies

    Toronto's rate minus Canada's is -1.0 percentage points. All five other metropolitan areas have higher rates than Toronto.

    What it influences

    Inflation bears on wage bargaining, the policy rate and mortgage renewals; those links are national and not measured for Toronto.

    Risks

    The risks that published sources attribute to Toronto specifically are in the local-economy section of this page; the national risks are energy prices and tariffs (see the Canada report).

    What to watch

    Statistics Canada's monthly Consumer Price Index release (calendar).

    Prepared with AI assistance.

    Follow the relationships

    Upcoming releases

    Sources for this section (1 datasets, 1 documents)

    Data

    Documents cited

    Each dataset is used under its licence; attribution and series-level detail are in each chart’s “About this data” panel. Limitations: The city CPI is held here for all items only. The table used publishes shelter and its parts for cities, but not food or gasoline, and the shelter series are not held here, so the drivers of the difference with other cities are not measured. For Ottawa–Gatineau the CPI covers the Ontario part only.

    3 · Population and growth

    Is Toronto still growing, and how does that compare with the other large cities?

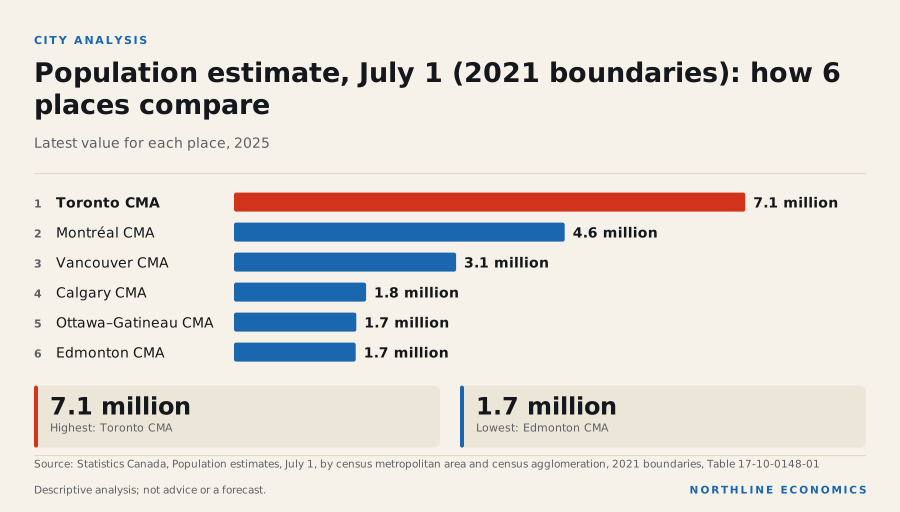
    Toronto's population changed 0.0% in the year to July 2025, ranked 6th of 6 among the six large metropolitan areas, against 3.1% in Edmonton

    Graphic: Population estimate, July 1 (2021 boundaries): how 6 places comparePopulation estimate, July 1 (2021 boundaries): how 6 places compare. Toronto CMA 7.1 million; Montréal CMA…

    What happened

    The Toronto metropolitan area had 7.1 million residents on July 1, 2025, a change of 0.0% from a year earlier. Over five years it grew 9.5%, against 20.1% in Calgary and 15.8% in Edmonton. In the latest year the rates were 2.9% in Calgary, 3.1% in Edmonton, 2.3% in Ottawa–Gatineau, 0.5% in Montréal and 0.2% in Vancouver.

    Population by metropolitan area, indexed

    July 1 estimates, 2021 boundaries; start of period = 100.

    Chart loads when it comes into view.

    Latest values: Toronto 7,109,000 (2025); Calgary 1,836,000 (2025); Edmonton 1,692,000 (2025); Vancouver 3,088,000 (2025); and 2 more in the data table.

    Why it happened

    Historical context

    Statistics Canada reports that from July 1, 2025, to July 1, 2026, national population growth continued to slow to its lowest since 1944/1945, that the number of non-permanent residents fell by the largest annual amount on record with study-permit holders accounting for most of the decline, and that Ontario, Quebec and British Columbia, which receive the largest shares of international migrants, grew slowest among the provinces. The 20-to-29 age group shrank, consistent with fewer international students.

    Evidence: Statistics Canada: The Daily: Canada's population estimates, second quarter 2026

    This is the provincial and national explanation for the year to July 2026; the metropolitan population estimates end in July 2025, before that year's record fall in non-permanent residents, so they cannot show it. The components of the metropolitan change are shown below.

    Historical context

    Statistics Canada's January 2026 release on subprovincial estimates reports that the population growth rate from July 2024 to July 2025 was lower for all 41 census metropolitan areas than in the previous year. It reports that Toronto's net loss in non-permanent residents was by far the main contributor to the slowdown in its growth; the components below show the same figures.

    Evidence: Statistics Canada: The Daily: Canada's population estimates: Subprovincial areas, 2025

    In the demographic year that began in July 2024, the Toronto metropolitan area recorded 64 thousand births and 41 thousand deaths, 115 thousand immigrants, a net change of -45 thousand non-permanent residents, net interprovincial migration of -13 thousand and net intraprovincial migration (movement to and from the rest of the province) of -65 thousand. The year before, immigrants numbered 128 thousand and the net change in non-permanent residents was 228 thousand. Net non-permanent residents averaged 85 thousand a year over the latest five demographic years.

    Where Toronto's population change came from

    Persons over the twelve months from July 1 of the year shown (so 2024 is July 2024 to June 2025), 2021 boundaries. Net movements: negative = net outflow. Statistics Canada table 17-10-0149-01.

    Chart loads when it comes into view.

    Latest values: Immigrants 115,300 (2024); Net non-permanent residents -44,790 (2024); Net interprovincial migration -12,700 (2024); Net intraprovincial migration -64,790 (2024).

    Why it matters

    Population growth adds workers and households, which can add to demand for housing and services. A population that is not growing bears on the demand side of the housing section below.

    History

    Over ten years Toronto's population grew 17.6%.

    Across geographies

    Ontario's population grew 0.3% over the four quarters to 1 July 2026, against 1.5% in Alberta; Ontario's net change in non-permanent residents over the same four quarters was -86 thousand. These are provincial figures.

    What it influences

    Hypothesis, not established

    The 2026 fall in non-permanent residents could reduce demand for rental and starter housing in cities that host many international students. The metropolitan change in non-permanent residents to June 2025 is shown among the components above; it does not cover the 2026 fall.

    Evidence: Statistics Canada: The Daily: Canada's population estimates, second quarter 2026

    Risks

    Not assessed: the effect of the federal immigration levels plan on Toronto specifically.

    What to watch

    Statistics Canada's quarterly provincial and annual metropolitan population estimates and the federal levels plan.

    Historical context

    Immigration, Refugees and Citizenship Canada released details of the 2027-2029 Immigration Levels Plan on 5 November 2026 and says its notional figures for 2028 and 2029 will be confirmed or adjusted each year.

    Evidence: Immigration, Refugees and Citizenship Canada: Supplementary Information for the 2027-2029 Immigration Levels Plan

    Prepared with AI assistance.

    Follow the relationships

    Sources for this section (4 datasets, 3 documents)

    Data

    Documents cited

    Each dataset is used under its licence; attribution and series-level detail are in each chart’s “About this data” panel. Limitations: City population is an annual July 1 estimate on 2021 boundaries and ends a year before the latest provincial figures. Components of change come from a separate table (17-10-0149-01) whose demographic year runs from July 1 to June 30; each is labelled by the year in which that year starts, so the latest covers July 2024 to June 2025. They describe how much each component contributed and do not explain why. Births and deaths are not netted here; net emigration, returning emigrants and the table's residual are not shown, so the components shown need not add to the total change. The metropolitan estimates are updated once a year; those for 2024-25 were published before Statistics Canada's September 2026 revision of non-permanent resident estimates, which the provincial figures include.

    4 · Housing and construction

    Is Toronto building enough homes, and what is happening to prices?

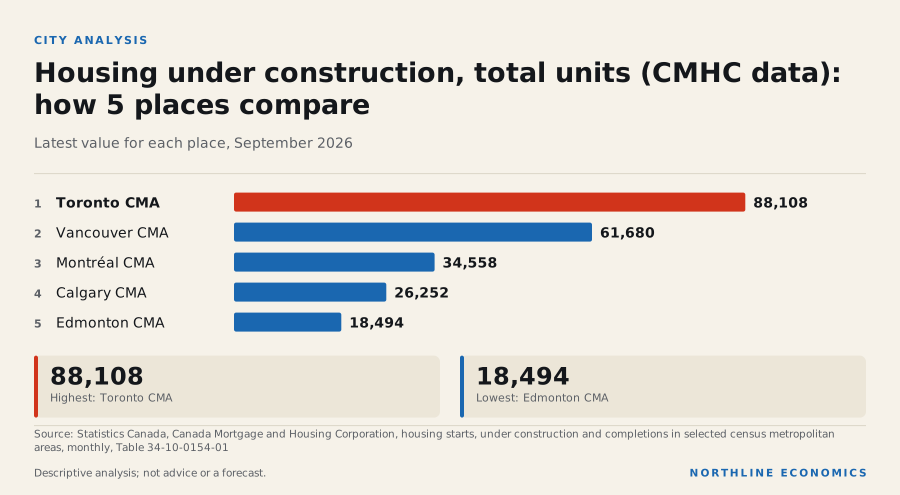
    Toronto's new-home prices changed -4.9% in the twelve months to September 2026, the biggest fall among the six large metros, with 88,108 homes under construction at the end of September 2026 and CMHC saying starts must rise by at least 50%

    Graphic: Housing under construction, total units (CMHC data): how 5 places c…Housing under construction, total units (CMHC data): how 5 places compare. Toronto CMA 88,108; Vancouver…

    What happened

    Toronto started 23,355 homes over the past twelve months and completed 26,691. At the end of September 2026, 88,108 were under construction, -4.2% on a year earlier, by far the largest pipeline of the six areas (Vancouver 61,680, Montréal 34,558, Calgary 26,252). Over the same twelve months Vancouver started 26,601 and Montréal 27,474.

    Housing starts by metropolitan area (12-month total)

    Total units started over the previous 12 months; CMHC data distributed by Statistics Canada.

    Chart loads when it comes into view.

    Latest values: Toronto 23,360 (2026-09); Calgary 24,400 (2026-09); Edmonton 19,060 (2026-09); Vancouver 26,600 (2026-09); and 2 more in the data table.

    Housing under construction by metropolitan area

    Units under construction at month end, total units; CMHC data distributed by Statistics Canada.

    Chart loads when it comes into view.

    Latest values: Toronto 88,110 (2026-09); Calgary 26,250 (2026-09); Edmonton 18,490 (2026-09); Vancouver 61,680 (2026-09); and 2 more in the data table.

    The New Housing Price Index for Toronto is 105.0, -4.9% on a year ago and -8.5% since February 2022. Vancouver's index changed -2.1% over the year and -3.6% since February 2022; Calgary's 0.0% over the year.

    New housing price index by city, indexed

    Total (house and land); start of period = 100. Ottawa–Gatineau is the Ontario part only.

    Chart loads when it comes into view.

    Latest values: Toronto 105 (2026-09); Calgary 129.7 (2026-09); Edmonton 105.7 (2026-09); Vancouver 123.4 (2026-09); and 2 more in the data table.

    Historical context

    CMHC's Fall 2026 Housing Supply Report says Toronto still needs to increase annual housing starts by at least 50% over the next decade; its summary table puts the additional starts needed each year at 20,000 to 26,000, while its Toronto section says Toronto needs between 21,000 and 26,000 more starts every year. It reports that rental construction is carrying supply while ownership construction (condominium and ground-oriented) has weakened sharply.

    Evidence: Canada Mortgage and Housing Corporation: Fall 2026 Housing Supply Report

    In the October 2025 Rental Market Survey the average rent for a two-bedroom unit in purpose-built rental structures of three or more units in Toronto was C$2,045 a month, 3.7% higher than a year earlier (CMHC's same-sample figure for the Greater Toronto Area, for structures surveyed in both years, is 3.5%) and 24.9% higher than five years earlier, ranking 2nd of 14 among fourteen cities (highest = 1); the same measure was C$1,908 in Calgary, C$2,364 in Vancouver. The vacancy rate was 3.0%, from 2.5% a year earlier, ranking 9th of 14 among the fourteen (against 4.9% in Calgary, 3.7% in Vancouver). The table covers purpose-built rental structures only; condominium, house and basement-suite rentals, and the asking rents on new listings, are not in it.

    Average rent, two-bedroom units: fourteen cities

    Current dollars per month, October survey each year; row and apartment structures of three units and over only (condominium, house and basement-suite rentals are not in this table). CMHC data distributed by Statistics Canada.

    Chart loads when it comes into view.

    Latest values: Toronto 2,045 (2025); Calgary 1,908 (2025); Edmonton 1,598 (2025); Vancouver 2,364 (2025); and 10 more in the data table.

    Rental vacancy rate: fourteen cities

    Percent of units vacant, October survey each year; row and apartment structures of three units and over. CMHC data distributed by Statistics Canada.

    Chart loads when it comes into view.

    Latest values: Toronto 3 (2025); Calgary 4.9 (2025); Edmonton 3.8 (2025); Vancouver 3.7 (2025); and 10 more in the data table.

    Why it happened

    The data show a very large construction pipeline alongside falling new-home prices.

    Interpretation

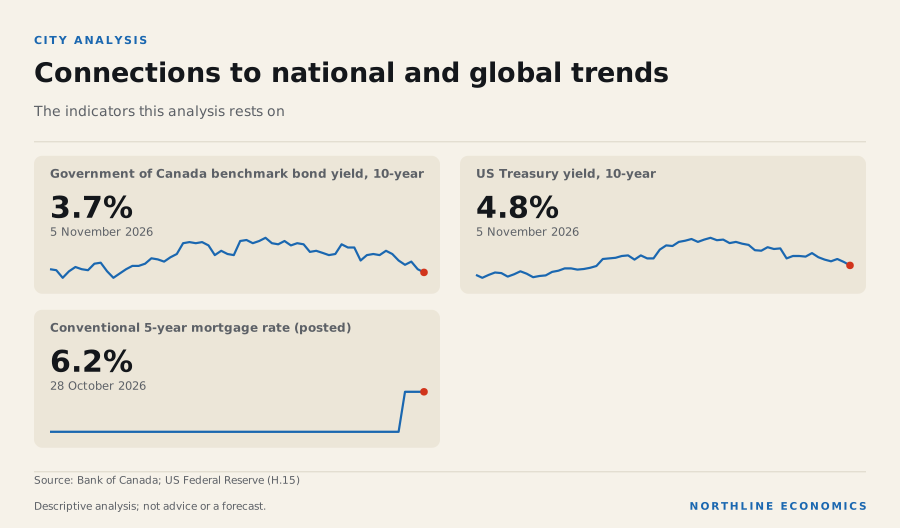
    CMHC's assessment is that supply is not keeping up with what is needed for affordability and that ownership construction has weakened; the falling new-home index is consistent with weak ownership demand and with developers adjusting prices, but the data held here cannot separate demand, prices of land and costs, interest rates and incomes. Since January 2026 the posted five-year mortgage rate has gone from 6.09% to 6.19% (week of 28 October 2026) and the posted one-year rate from 5.84% to 5.49%; see the Canada report.

    Evidence: Canada Mortgage and Housing Corporation: Housing starts and construction data, September 2026; Canada Mortgage and Housing Corporation: Fall 2026 Housing Supply Report

    Historical context

    CMHC's 2025 Rental Market Report says that in Toronto and Vancouver there was more competition from rented condominium apartments. CMHC reports Toronto for the Greater Toronto Area, which is not the same boundary as the census metropolitan area used for the figures above. These are CMHC's stated reasons; the data held here do not test them.

    Evidence: Canada Mortgage and Housing Corporation: Rental Market Report 2025: major centres (web edition)

    Why it matters

    Housing is a large household expense.

    Historical context

    CMHC says housing affordability in Toronto has recently improved as declining home prices and slower rent growth reduced pressure on household budgets, and that these factors reflect softer current market conditions rather than sustainable affordability improvements.

    Evidence: Canada Mortgage and Housing Corporation: Fall 2026 Housing Supply Report

    History

    Building permits for the metropolitan area totalled C$29.3 billion over the twelve months to August 2026, +8.6% on the twelve months before. Residential permits were 60.1% of the value in August 2026. The monthly peak of units under construction in the past ten years was 109,104 in July 2023.

    Housing completions by metropolitan area (12-month total)

    Units completed over the previous 12 months, total units; CMHC data distributed by Statistics Canada.

    Chart loads when it comes into view.

    Latest values: Toronto 26,690 (2026-09); Calgary 23,830 (2026-09); Edmonton 18,250 (2026-09); Vancouver 27,830 (2026-09); and 2 more in the data table.

    Across geographies

    On the six-city comparison, units under construction changed over the twelve months to September 2026 by -4.2% in Toronto, -2.3% in Vancouver, 9.2% in Montréal and 4.0% in Edmonton. The gap estimates in CMHC's summary table differ widely: Toronto 20,000 to 26,000 units a year, Vancouver 5,000 to 7,000, Montréal 42,000 to 56,000, Calgary 4,000 to 5,000 and Edmonton no measurable housing supply gap.

    What it influences

    The Bank of Canada describes a link between mortgage costs and housing, and CMHC a link between supply and affordability; neither is estimated for Toronto.

    Risks

    Historical context

    CMHC's deputy chief economist said a key risk for Canada is not building enough during this period of softening housing markets, and that affordability gains since 2023 will be difficult to sustain unless construction rises.

    Evidence: Canada Mortgage and Housing Corporation: Housing starts and construction data, September 2026

    What to watch

    CMHC's monthly starts, Statistics Canada's New Housing Price Index and building permits (release dates in the calendar), and the Bank of Canada's next announcement on 9 December 2026.

    Prepared with AI assistance.

    Follow the relationships

    Upcoming releases

    Sources for this section (7 datasets, 3 documents)

    Data

    Documents cited

    Each dataset is used under its licence; attribution and series-level detail are in each chart’s “About this data” panel. Limitations: Starts, completions and units under construction are CMHC counts for the metropolitan area (all unit types). The New Housing Price Index covers new homes only; resale prices are not included, and rents are the October Rental Market Survey for purpose-built rental structures only. Monthly starts and completions are volatile and are shown as twelve-month sums where compared. Building permit values are in current dollars, seasonally adjusted.

    5 · Industry, investment and exposure

    What does Toronto make, and how is it exposed?

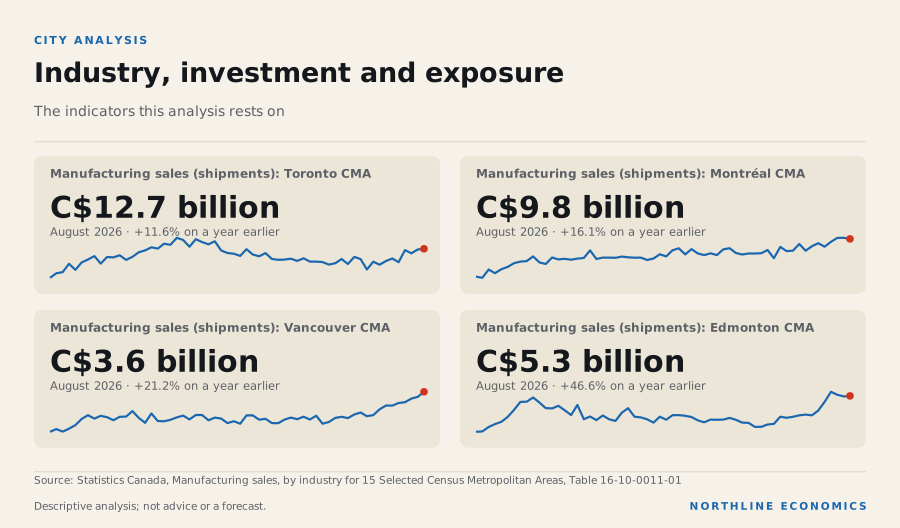
    Toronto's manufacturing shipments of C$12.7 billion in August 2026 were the largest of the six metros and 11.6% above a year earlier; in 2025 Ontario employed more of its workers in finance than any other province

    Graphic: Industry, investment and exposureIndustry, investment and exposure. Manufacturing sales (shipments): Toronto CMA C$12.7 billion (August…

    What happened

    Toronto manufacturing shipments were C$12.7 billion in August 2026, 11.6% above a year earlier and 23.0% above December 2019, against 16.1% over the year in Montréal, 21.2% in Vancouver and 46.6% in Edmonton. Petroleum and coal product manufacturing was 2.5% of the Toronto total, against 58.8% in Edmonton, so Toronto's manufacturing is not a refining story.

    Manufacturing shipments by metropolitan area, indexed

    Seasonally adjusted, current dollars (so prices are included); start of the period = 100. Cities whose latest value is suppressed are not shown.

    Chart loads when it comes into view.

    Latest values: Toronto 12,680,000,000 (2026-08); Calgary 1,720,000,000 (2026-08); Edmonton 5,326,000,000 (2026-08); Vancouver 3,594,000,000 (2026-08); and 2 more in the data table.

    Value of building permits by metropolitan area (12-month total)

    Seasonally adjusted, current dollars, all types of building and work. Ottawa–Gatineau is published only for its Ontario and Quebec parts and is not shown.

    Chart loads when it comes into view.

    Latest values: Toronto 29.27 (2026-08); Calgary 9.156 (2026-08); Edmonton 6.99 (2026-08); Vancouver 17.06 (2026-08); and 1 more in the data table.

    Building permits (all types) totalled C$29.3 billion over the twelve months to August 2026, +8.6% on the twelve months before.

    Why it happened

    Historical context

    Statistics Canada reported that national exports rose in the second quarter by the most since the first quarter of 2023, mainly passenger cars and light trucks as auto production rebounded.

    Evidence: Statistics Canada: The Daily: Gross domestic product, income and expenditure, second quarter 2026

    Historical context

    Its GDP-by-industry release for August, the month of the shipments above, says national manufacturing output rose, for the fifth time in seven months, as some petroleum refineries resumed production after unscheduled maintenance in July, while motor vehicles and parts manufacturing contracted during a prolonged summer shutdown at a major auto assembly plant. These are national statements; the Toronto shipments here are broken down only for petroleum and coal products, so this report cannot say how much of Toronto's shipments growth is autos, food, chemicals or price.

    Evidence: Statistics Canada: The Daily: Gross domestic product by industry, August 2026

    Why it matters

    Toronto is the largest manufacturing metropolitan area in the data and also the largest labour market among the six. Ontario's goods exports go mainly to the United States, but the metropolitan data cannot show how much of Toronto's manufacturing depends on that demand.

    History

    Toronto's manufacturing shipments peaked at C$13.6 billion in May 2023, the highest in the past ten years.

    Across geographies

    As provincial context only: in 2025, 72% of Ontario's domestic merchandise exports went to the United States, and energy products were 1% of the total. Ontario's workers are employed 6.6% in finance and insurance, 11.1% in professional, scientific and technical services and 7.0% in construction (shares of employment, 2025); Alberta's finance share is 3.5%. These are provincial shares and must not be read as describing Toronto.

    How much of each province’s employment is in one industry

    Share of provincial employment, 2025 annual average (Labour Force Survey). A measured exposure to an industry, not an estimate of how much output or income depends on it. “Resources” combines forestry, fishing, mining, quarrying and oil and gas.

    Chart loads when it comes into view.

    Top values: Newfoundland and Labrador 6.37%; Alberta 5.58%; Saskatchewan 3.76%.

    What it influences

    Toronto's manufacturing and construction activity feed local employment and incomes. The explorer shows Ontario's export exposure to the United States, derived from the trade data above, and an observed association between exports to the United States and manufacturing sales; none is a measured effect on Toronto.

    Risks

    Historical context

    Statistics Canada notes that new US tariffs on a range of Canadian products took effect at the end of August and that imports of motor vehicles and parts fell. The exposure of Toronto's manufacturers to those tariffs is not measured here.

    Evidence: Statistics Canada: The Daily: Canadian international merchandise trade, August 2026

    What to watch

    Statistics Canada's monthly manufacturing survey and merchandise trade releases (calendar).

    Prepared with AI assistance.

    Follow the relationships

    Upcoming releases

    Sources for this section (2 datasets, 3 documents)

    Data

    Documents cited

    Each dataset is used under its licence; attribution and series-level detail are in each chart’s “About this data” panel. Limitations: Manufacturing sales are current-dollar shipments and move with prices. Annual employment by industry is a Labour Force Survey sample estimate (noisy for small groups) and is in the labour section; wages and output by industry for the Toronto metropolitan area are not held. Ontario figures are provincial and are context only, never a description of Toronto. Shipments for some industries and cities are suppressed by Statistics Canada.

    5.5 · Industry structure (2021 Census)

    What do the people who work in Toronto do for a living?

    Professional, scientific and technical services was the largest source of Toronto jobs in 2021 at 13.8%, and Finance and insurance was the sector in which Toronto's share of jobs stood furthest above the other five areas combined

    What happened

    In the 2021 Census, 2.7 million jobs were located in the Toronto metropolitan area (people who worked at home or had a usual workplace there; people with no fixed workplace address are not in the table). The three largest sectors were Professional, scientific and technical services (13.8% of jobs), Health care and social assistance (11.1%) and Retail trade (10.5%).

    Measured as its share of jobs divided by the other five metropolitan areas' combined share (among sectors that make up at least one fiftieth of Toronto's jobs), the sector in which Toronto stood furthest above the rest was Finance and insurance: 9.3% of its jobs, against 4.5% in Calgary, 4.0% in Edmonton, 5.4% in Vancouver, 5.4% in Montréal and 3.5% in Ottawa–Gatineau.

    Jobs by industry sector in six metropolitan areas, 2021 Census

    Share of jobs located in each metropolitan area (persons who worked at home or had a usual place of work there; people with no fixed workplace address are not in the table), May 2021 reference week, pandemic conditions. Industry structure at one date, not current conditions. Shares are computed by this project from the Census counts.

    Chart loads when it comes into view.

    Top values: Edmonton 6%; Calgary 4.9%; Vancouver 4.2%.

    Why it happened

    Not assessed. The table counts jobs by sector at one date and says nothing about why a metropolitan area has the mix it has. Attributed descriptions of Toronto's industry structure are in the local-economy section of this page.

    Why it matters

    The industry mix shows what a local economy does for a living, which bears on how it is exposed to changes in demand, prices and policy. It does not measure output, wages or how the economy is performing; those need other tables.

    History

    Not available from this table: the Census is taken every five years and the platform holds only the 2021 reference week (May 2021). Annual industry employment for the metropolitan area comes from the Labour Force Survey and is in the labour section of this page.

    Across geographies

    The six metropolitan areas come from one table with one definition, so the shares can be compared with one another. They are shares of jobs located in the area, not of residents' employment, and not comparable with provincial Labour Force Survey industry shares, which use a different survey, year and definition. Ontario is not described here.

    What it influences

    Not assessed. No relationship in the recorded graph links the metropolitan industry mix to another variable.

    Risks

    Historical context

    The reference week was in May 2021, during public-health restrictions: Statistics Canada named retail trade, accommodation and food services, and information, culture and recreation among the industries most affected, and said working from home remained an important adaptation. The data are more than five years old and cannot show what has changed since.

    Evidence: Statistics Canada: The Daily: Labour Force Survey, May 2021

    What to watch

    The release of 2026 Census results on industry for metropolitan areas. No release date for them is in the calendar this site holds, and none is assumed.

    Prepared with AI assistance.

    Follow the relationships

    Sources for this section (1 datasets, 1 documents)

    Data

    Documents cited

    Each dataset is used under its licence; attribution and series-level detail are in each chart’s “About this data” panel. Limitations: Census 2021, one reference week (May 2021) under pandemic conditions; counts are rounded by Statistics Canada. Jobs located in the metropolitan area (at home or usual workplace); people with no fixed workplace address are excluded. Not current conditions and not output, wages or productivity.

    6 · Connections to national and global trends

    How do global and national developments reach Toronto, and what does the evidence show?

    Oil prices and Toronto's employment are associated (r = 0.37) about as much as in Calgary: the test cannot tell oil-linked cities from others

    Graphic: Connections to national and global trendsConnections to national and global trends. Government of Canada benchmark bond yield, 10-year 3.7% (5…

    What happened

    The one Toronto-specific quantity in the relationship graph is the association between the WTI oil price and metropolitan employment: for 12-month changes the correlation is 0.37 at lag zero and 0.19 when employment is compared six months later. The same measure is 0.37 for Calgary and 0.41 for Edmonton.

    Crude oil prices

    US dollars per barrel, monthly average (World Bank Pink Sheet). WTI is the benchmark for Canadian light crude; Brent and Dubai are the other main references.

    Chart loads when it comes into view.

    Latest values: Crude oil, WTI 97.7 (2026-10); Crude oil, Brent 125 (2026-10); Crude oil, Dubai 102.7 (2026-10).

    Why this mattersOil prices are set in world markets. They matter for Canadian incomes, provincial budgets and investment through channels that the relationship explorer documents with their evidence.

    Why it happened

    Interpretation

    A city with little direct oil exposure shows an association about as large as the Alberta cities, so the statistic may mainly reflect the economy-wide cycle that moves oil prices and employment together; it is not evidence that oil drives Toronto's jobs, and it does not rule out an effect in Calgary or Edmonton.

    Evidence: relationship: World oil price (WTI) and Toronto; relationship: World oil price (WTI) and Calgary; relationship: World oil price (WTI) and Edmonton

    Why it matters

    Toronto's connections to the world run mostly through channels this report measures only at provincial or national level: US demand for Ontario's exports, interest rates and the exchange rate. The Global report shows each of these at the country level.

    History

    Not assessed for Toronto.

    Across geographies

    Interest rates: on 5 November 2026 the US ten-year yield was 4.84% and Canada's 3.67%; Canada's posted five-year mortgage rate is 6.19% (which rose 0.10 percentage points over the past year).

    Interpretation

    Bond yields and the posted five-year mortgage rate tend to move together, which matters for a market in which new-home prices are falling; the Toronto-specific effect is not measured. Trade: in 2025, 72% of Ontario's domestic merchandise exports went to the United States.

    Evidence: relationship: Government of Canada bond yields and Prime and posted mortgage rates

    What it influences

    Three chains bear on Toronto: from US trade measures to Ontario manufacturing (a published provincial assessment, with no size given), from policy and bond rates to mortgage costs and housing (documented nationally for the policy rate, an observed correlation for bond yields), and from immigration policy to population (documented nationally) and rental vacancy (documented for the Greater Toronto Area, with no measured size).

    Risks

    The risks that published sources attribute to this city specifically are in the local-economy section of this page; beyond those, see the national risks in the Canada report and the global risks in the Global report.

    What to watch

    The Bank of Canada's next announcement on 9 December 2026, the next US tariff changes and Statistics Canada's monthly releases; see the calendar.

    Prepared with AI assistance.

    Follow the relationships

    Upcoming releases

    Sources for this section (3 datasets, 0 documents)

    Data

    Each dataset is used under its licence; attribution and series-level detail are in each chart’s “About this data” panel. Limitations: Toronto-specific evidence is thin. Most recorded relationships are national or provincial; highlighting a province or a path in the explorer is not a measured effect on Toronto. The only Toronto-specific quantity is a correlation of 12-month changes, which is descriptive and shares a business-cycle driver with the comparison cities.

    What is missing

    What this page does not cover

    Stated plainly rather than hidden.

    Data requirements

    Output and wages by industry for the metropolitan area
    Annual employment by industry group (Labour Force Survey, table 14-10-0468-01), the 2021 Census industry mix and total metropolitan GDP (annual, no industry detail) are now ingested. Output by industry for the metropolitan area is not, and no wage series for the metropolitan area is held: the open Statistics Canada wage tables cover provinces and Canada, not metropolitan areas.
    not covered
    Resale prices, rents outside purpose-built rental, and household incomes
    Resale data are licensed. Average rent and vacancy for purpose-built rental structures (CMHC Rental Market Survey) are ingested; condominium, house and basement-suite rents and household income tables for the metropolitan area are not.
    not covered
    Commercial real estate, office and industrial markets
    Proprietary sources; licensing required.
    not covered
    Infrastructure, major projects and public investment
    A project is listed only once its source, status and value have been checked.
    not covered
    Municipal finance and policynot covered
    Method and sources

    How this report is built

    Same pipeline, gates and editorial rules as every other page.

    Every number is a reference to a published, licence-checked series for the same geography (ca.on.cma_toronto); metropolitan series are never mixed with provincial or national ones. Statistics Canada tables 14-10-0459-01 (labour), 18-10-0004-01 (CPI), 17-10-0148-01 (population), 34-10-0154-01 (starts, completions, under construction; CMHC data), 18-10-0205-01 (new housing price index), 34-10-0292-01 (building permits) and 16-10-0011-01 (manufacturing shipments, six large cities only), 17-10-0149-01 (components of population change), 34-10-0133-01 and 34-10-0130-01 (rents and vacancy, CMHC Rental Market Survey), 36-10-0468-01 (GDP at basic prices) 98-10-0492-01 (2021 Census jobs by industry) and 14-10-0468-01 (annual employment by industry group). Methodology and sources · Editorial policy.