Atlas · YYC · Alberta
Calgary
1,836,012 people, July 2025. Metropolitan area measures, beside the 13 other cities Northline covers.

Unemployment rateCalgary among 14 cities
Pin up to four cities
Three-month moving average, seasonally adjusted. Statistics Canada, Labour Force Survey.
Table view
| City | Latest | Period |
|---|---|---|
| London | 8.1% | Oct 2026 |
| Hamilton | 7.6% | Oct 2026 |
| Toronto | 7.1% | Oct 2026 |
| Ottawa–Gatineau | 7.1% | Oct 2026 |
| Edmonton | 7.1% | Oct 2026 |
| Kitchener–Waterloo | 7.1% | Oct 2026 |
| Montréal | 6.9% | Oct 2026 |
| Vancouver | 6.7% | Oct 2026 |
| Calgary | 6.6% | Oct 2026 |
| Saskatoon | 5.9% | Oct 2026 |
| Regina | 5.9% | Oct 2026 |
| Halifax | 5.4% | Oct 2026 |
| Winnipeg | 5.0% | Oct 2026 |
| Québec | 4.5% | Oct 2026 |
Vital signs
Calgary in eight numbers
| Measure | Latest | Period and rank among 14 cities | Context | Trend |
|---|---|---|---|---|
| Unemployment rate | 6.6% | Oct 2026, ninth highest of 14 | Alberta 7.3%, Canada 6.7% (monthly measures) | |
| Employment rate | 66.7% | Oct 2026, highest of 14 | ||
| Consumer prices, 12-month change | 3.4% | Sep 2026, fourth highest of 11 | Alberta 3.6%, Canada 3.1% | |
| Population | 1,836,012 | July 2025 | ||
| Population growth | 2.9% | Year to July 2025, second highest of 14 | ||
| Housing starts, last 12 months | 24,403 | To Sep 2026, third highest of 14 | ||
| Average two-bedroom rent | C$1,908 | October 2025, third highest of 14 | ||
| Rental vacancy rate | 4.9% | October 2025, highest of 14 |
City figures are metropolitan-area measures. National and provincial unemployment rates are monthly, so they are close to but not the same measure as the three-month city averages.
What it is built on
Jobs by industry
Share of jobs by place of work, 2021 Census. The tick marks the 14 cities combined. Total jobs counted: 616,670.
Rates and housing here
Where the ripple reaches Calgary
A reading path through recorded links, not a forecast. Effects along a chain are never added or multiplied.
Follow the rippleWhere to go next
ServicesGet a full profileA sourced profile of Calgary for a lender, board or council. StudioOpen in StudioA workspace prepared from these measures, with the gaps stated.Calgary: city dashboard
Written analysis of the Calgary metropolitan economy from verified Statistics Canada and CMHC data: jobs, prices, population and migration, housing (starts, prices, rents), total output, the 2021 Census industry mix and how national and global developments connect to it. It does not cover wages by city or resale prices; the page lists what is missing.
Opens a workspace prepared from the published Calgary measures above, with the gaps stated.
Calgary versus Edmonton in Studio → · Choose other places to compare →
Open the recorded relationships for Calgary in Studio →
Compare with other cities → · Research →
What are the main things to know about Calgary's economy right now?
Calgary had 1.1 million workers in October 2026, with unemployment at 6.6%; its housing starts, prices and population are covered in the sections below
Graphic: Employment, 3-month moving average, seasonally adjusted: how 6 plac…
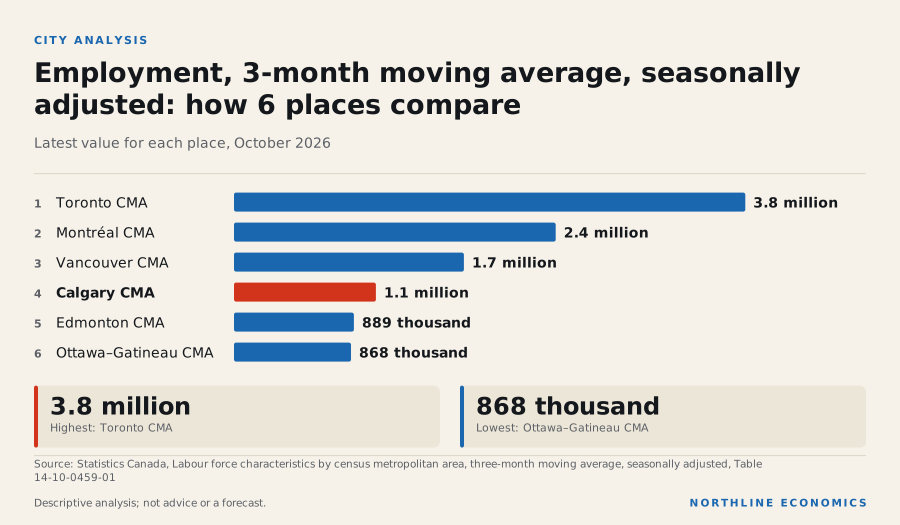
Calgary among the six largest metros
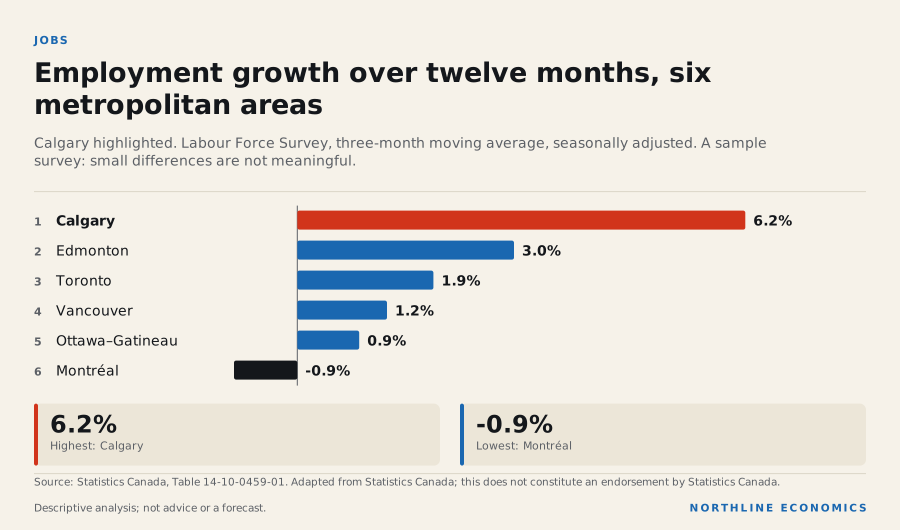
Calgary's labour market is the strongest of the six largest metropolitan areas. The unemployment rate is 6.6%, the lowest of the six and down from 7.8% a year earlier, and employment is 6.2% above a year ago, the largest increase. The employment rate of 66.7% is the highest. Metropolitan labour figures come from a sample survey and move more than provincial ones, so the size of the gap matters more than the exact rank, but on each of these measures Calgary is first.
The data behind this graphic
| Item | Value |
|---|---|
| Calgary | 6.2% |
| Edmonton | 3.0% |
| Toronto | 1.9% |
| Vancouver | 1.2% |
| Ottawa–Gatineau | 0.9% |
| Montréal | -0.9% |
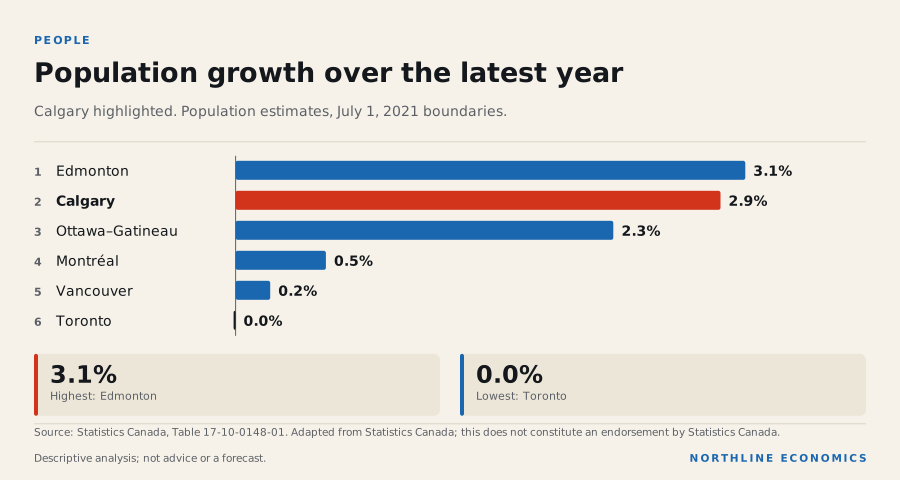
Population is also growing quickly. It grew 2.9% in the year to July 2025, second only to Edmonton, and net interprovincial migration added 11 thousand persons in the latest annual figure, the second-largest inflow after Edmonton. Immigrants numbered 29 thousand and net non-permanent residents 9,608.
The data behind this graphic
| Item | Value |
|---|---|
| Edmonton | 3.1% |
| Calgary | 2.9% |
| Ottawa–Gatineau | 2.3% |
| Montréal | 0.5% |
| Vancouver | 0.2% |
| Toronto | 0.0% |
Housing: building fast, prices flat
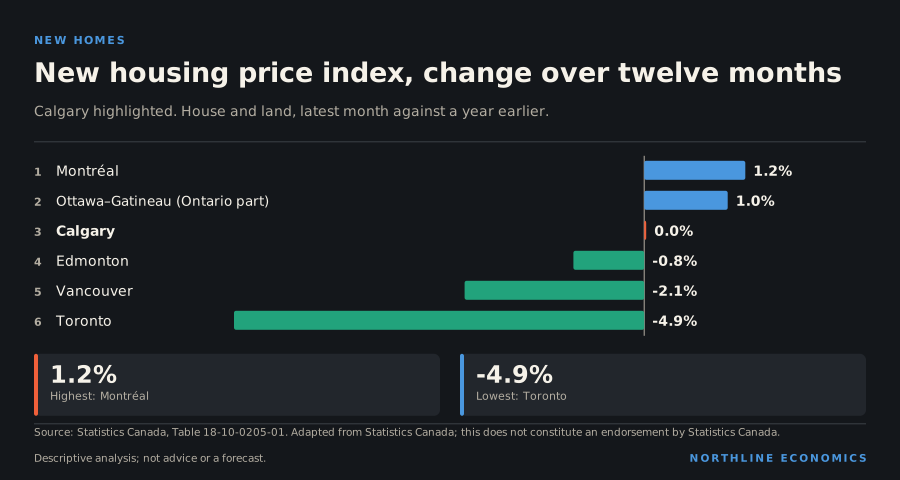
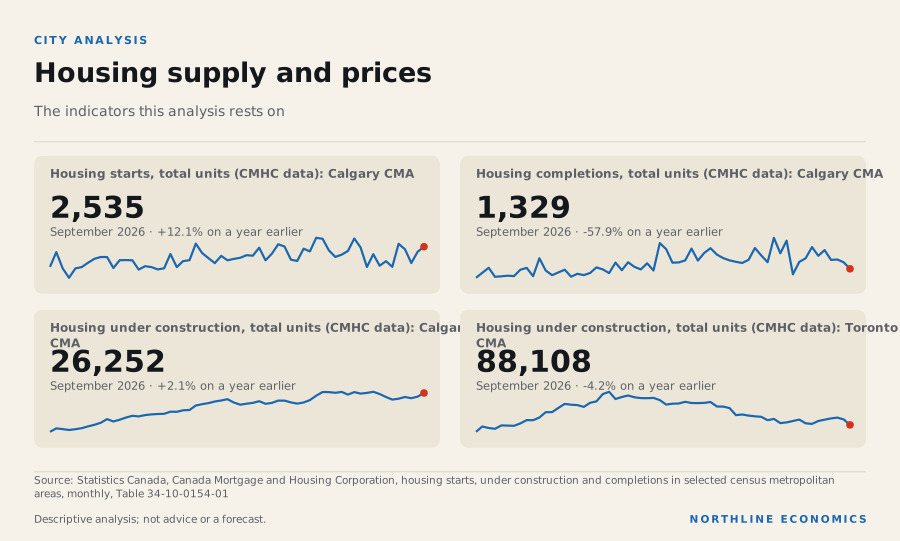
Builders started 2,535 homes in September 2026, narrowly the most of the six, and 26,252 homes are under construction. The new-home price index was unchanged on a year earlier (0.0%), while two-bedroom rents in purpose-built buildings averaged C$1,908 in the October 2025 survey, third of six, with a vacancy rate of 4.9%, the highest of the six. Heavy building, a high vacancy rate and flat new-home prices together are consistent with supply catching up with demand, though these data do not test that explanation.
The data behind this graphic
| Item | Value |
|---|---|
| Montréal | 1.2% |
| Ottawa–Gatineau (Ontario part) | 1.0% |
| Calgary | 0.0% |
| Edmonton | -0.8% |
| Vancouver | -2.1% |
| Toronto | -4.9% |
Output and industry
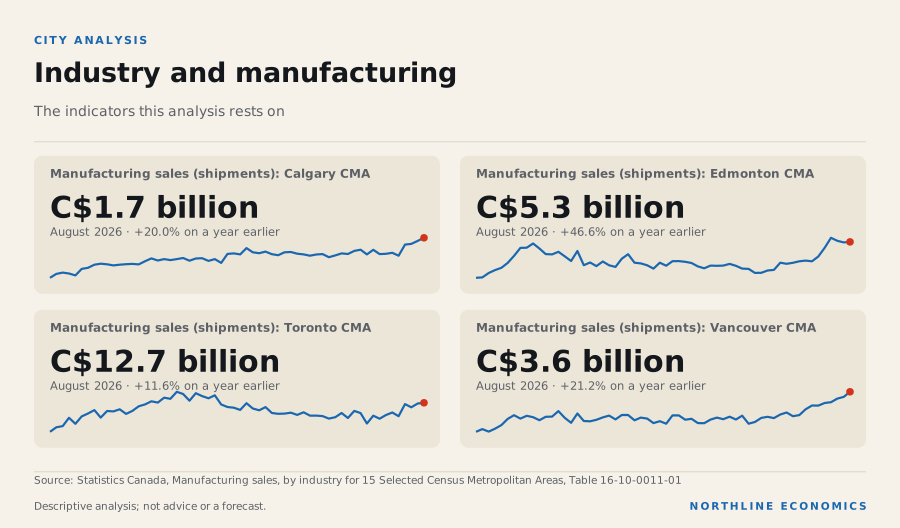
Gross domestic product at basic prices was C$130.0 billion in 2022, 24.0% higher than five years earlier in current dollars, which include inflation. Manufacturing shipments in August 2026 were 20.0% above a year earlier. Consumer prices rose 3.4% in the year to September 2026, the second highest of the six.
What it means for decisions
For an employer, Calgary has the fastest job growth and the lowest unemployment of the six; the data held here do not show wages. For a builder or lender, the combination of heavy building and the highest vacancy rate is the number to watch. For a household moving there, jobs are the strength and inflation the weakness.
What the data cannot say: they do not give wages, rents on the whole housing stock or resale prices, they are metropolitan totals and the survey is a sample. Nothing here is a forecast.
- Jobs: 1.1 million people are employed, 6.2% against a year ago; unemployment is 6.6%. The employment rate, 66.7%, is 1st of 6 among the six. Labour
- Prices: inflation is 3.4%, 2nd of 6 among the six metros. The city index is held here for all items only. Prices
- People: the population changed 2.9% in the year to July 2025, 2nd of 6 among the six metros. Population
- Housing: new-home prices changed 0.0% in the twelve months to September 2026, with 26,252 homes under construction. CMHC puts the additional starts needed each year at 4,000 to 5,000. Housing
- Industry: manufacturing shipments are C$1.7 billion a month, 20.0% against a year ago. Industry
- Connections: most links that reach Calgary are national or provincial; the one measured for the city is a correlation between oil prices and employment. Connections
Prepared with AI assistance.
Follow the relationships
- Calgary 1 with evidence · 2 recorded Open in Studio
- Alberta 14 with evidence · 17 recorded Open in Studio
Upcoming releases
- 2026-12-04 Labour Force Survey November 2026 · Statistics Canada
Sources for this section (10 datasets, 1 documents)
Data
- Labour force characteristics by census metropolitan area, three-month moving average, seasonally adjusted (14-10-0459-01; 3 series; latest October 2026; retrieved 2026-11-07)
- Population estimates, July 1, by census metropolitan area and census agglomeration, 2021 boundaries (17-10-0148-01; 2 series; latest 2025; retrieved 2026-10-23)
- Components of population change by census metropolitan area and census agglomeration, 2021 boundaries (17-10-0149-01; 3 series; latest 2024; retrieved 2026-10-25)
- Canada Mortgage and Housing Corporation, housing starts, under construction and completions in selected census metropolitan areas, monthly (34-10-0154-01; 2 series; latest September 2026; retrieved 2026-10-23)
- New housing price index, monthly (18-10-0205-01; 1 series; latest September 2026; retrieved 2026-10-23)
- Canada Mortgage and Housing Corporation, average rents for areas with a population of 10,000 and over (34-10-0133-01; 1 series; latest 2025; retrieved 2026-10-25)
- Canada Mortgage and Housing Corporation, vacancy rates, row and apartment structures of three units and over, privately initiated in census metropolitan areas, weighted average (34-10-0130-01; 1 series; latest 2025; retrieved 2026-10-25)
- Gross domestic product (GDP) at basic prices, by census metropolitan area (CMA) (36-10-0468-01; 1 series; latest 2022; retrieved 2026-10-23)
- Manufacturing sales, by industry for 15 Selected Census Metropolitan Areas (16-10-0011-01; 1 series; latest August 2026; retrieved 2026-10-23)
- Consumer Price Index, monthly, not seasonally adjusted (18-10-0004-01; 1 series; latest September 2026; retrieved 2026-10-23)
Documents cited
- Canada Mortgage and Housing Corporation: Fall 2026 Housing Supply Report (retrieved 2026-11-07)
Each dataset is used under its licence; attribution and series-level detail are in each chart’s “About this data” panel. Limitations: Metropolitan labour series are sample-survey estimates, three-month averages, and move more than provincial ones. Output is annual, in current dollars and about four years old; migration series cover the twelve months from July 1 of the year shown. Rankings compare only these six metropolitan areas. No wages, resale prices, commercial real estate or investment records are held for the metropolitan areas.
How large is the Calgary economy, and how fast has it grown?
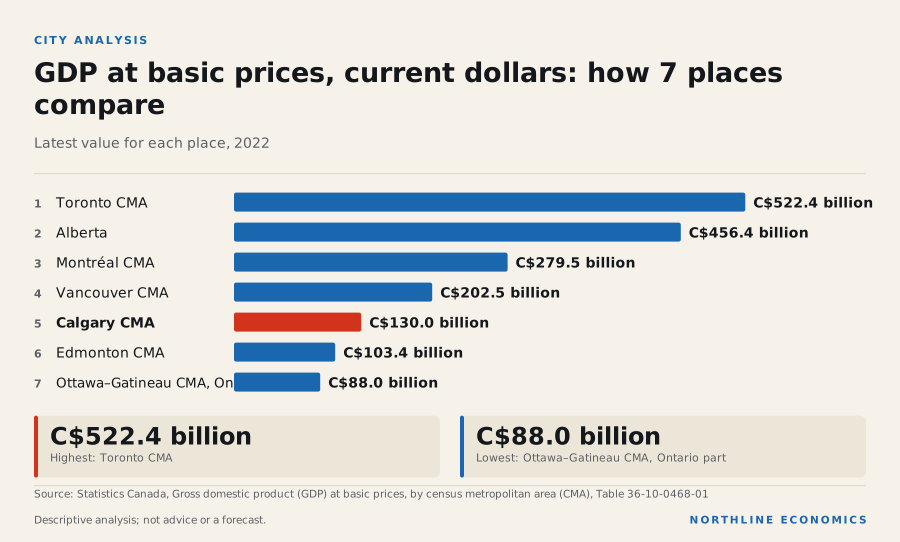
Calgary's economy was worth C$130.0 billion in 2022, 28.5% of Alberta's output, and ranked 4th of 6 by size among the six large metropolitan areas
Graphic: GDP at basic prices, current dollars: how 7 places compare
What happened
At basic prices and in current dollars, the Calgary economy produced C$130.0 billion of output in 2022, the latest reference year in Statistics Canada's table, equal to 28.5% of Alberta's total of C$456.4 billion. Among the six large metropolitan areas it ranked 4th of 6 by size.
Measured in current dollars, output was 72.4% higher in 2022 than in 2009 and 16.8% higher than in 2019. Alberta as a whole was 92.7% higher than in 2009 and 34.4% higher than in 2019. Over the same period since 2009 the other metropolitan areas grew 54.6% in Edmonton, 85.0% in Toronto, 98.1% in Vancouver, 75.3% in Montréal and 61.1% in Ottawa–Gatineau (Ontario part).
GDP at basic prices by metropolitan area, indexed
Annual, current dollars (so prices and population growth are included); 2009 = 100. Statistics Canada table 36-10-0468-01; the reference year lags the present by about three and a half years. Ottawa–Gatineau is published in an Ontario and a Quebec part and is not shown.
Chart loads when it comes into view.
Latest values: Calgary 130,000,000,000 (2022); Edmonton 103,400,000,000 (2022); Toronto 522,400,000,000 (2022); Vancouver 202,500,000,000 (2022); and 2 more in the data table.
Why it happened
Not assessed. The table is in current dollars, so these changes include price increases, and it is not divided by population, so the figures do not separate growth in the number of people from growth in output per person. This section cites no source that explains the differences between metropolitan areas.
Why it matters
GDP at basic prices is the broadest measure of local production that Statistics Canada publishes for metropolitan areas. It shows how large the local economy is and how its share of the provincial total compares, but not who earns the income, what is produced, or how the economy is doing now.
History
The series starts in 2009 and ends in 2022. A fall in output in any year in between would show in the chart; no year-by-year explanation is offered here.
Across geographies
The six series are comparable with each other because they come from one table with one definition and one price basis. The metropolitan totals sum, together with the areas outside metropolitan areas, to the provincial totals in the same table, which is why the provincial share above is exact for the reference year; the Statistics Canada footnote notes that there may be a lag between the metropolitan figures and the latest available provincial measures.
What it influences
Not assessed. No relationship in the recorded graph links metropolitan output to another variable.
Risks
The table ends in 2022 and describes nothing since; it cannot show the effects of recent changes in interest rates, trade policy, population or commodity prices on Calgary.
What to watch
Statistics Canada's next release of table 36-10-0468-01. No release date for it is in the calendar this site holds, and none is assumed.
Prepared with AI assistance.
Follow the relationships
- Calgary 1 with evidence · 2 recorded Open in Studio
- Alberta 14 with evidence · 17 recorded Open in Studio
Sources for this section (1 datasets, 1 documents)
Data
- Gross domestic product (GDP) at basic prices, by census metropolitan area (CMA) (36-10-0468-01; 7 series; latest 2022; retrieved 2026-10-23)
Documents cited
- Statistics Canada: Table 36-10-0468-01: Gross domestic product (GDP) at basic prices, by census metropolitan area (CMA) (retrieved 2026-11-07)
Each dataset is used under its licence; attribution and series-level detail are in each chart’s “About this data” panel. Limitations: Annual, current dollars, GDP at basic prices; the latest reference year lags the present by almost four years. Not adjusted for inflation or population. Industry detail is not part of the table. Metropolitan areas follow Statistics Canada 2021 boundaries.
Is Calgary's labour market keeping pace with the other large metropolitan areas?
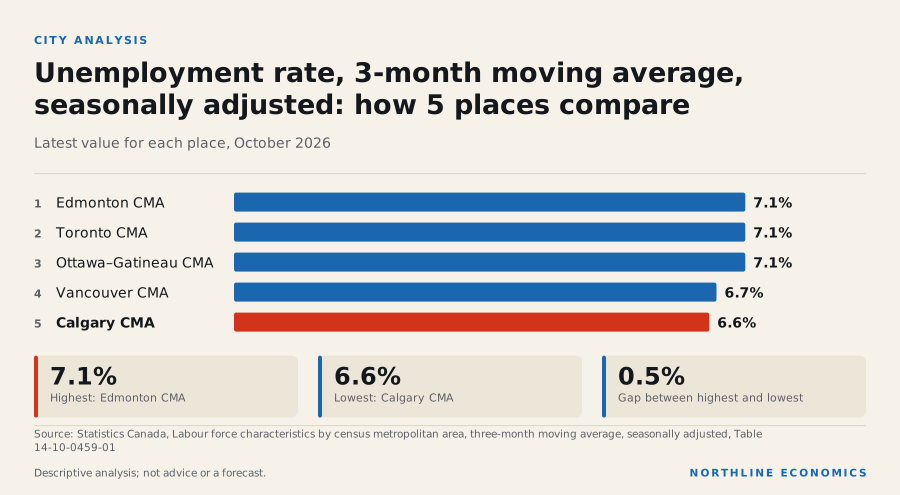
In October 2026, Calgary had 1.1 million workers, employment had changed 6.2% over the year and unemployment was 6.6%, with 66.7% of adults employed
Graphic: Unemployment rate, 3-month moving average, seasonally adjusted: how…
What happened
Calgary's seasonally adjusted unemployment rate (three-month average) was 6.6% in October 2026, from 7.8% a year earlier. For comparison: Edmonton's 7.1%, Toronto's 7.1%, Vancouver's 6.7%, Ottawa–Gatineau's 7.1%. Employment of 1.1 million changed 6.2% over the year, against 3.0% in Edmonton, 1.9% in Toronto and 1.2% in Vancouver.
Unemployment rate by metropolitan area
Percent, three-month moving average, seasonally adjusted. Census metropolitan areas only; do not compare with provincial monthly rates (different smoothing).
Chart loads when it comes into view.
Latest values: Calgary 6.6 (2026-10); Edmonton 7.1 (2026-10); Toronto 7.1 (2026-10); Vancouver 6.7 (2026-10); and 2 more in the data table.
Related relationships: Calgary · Edmonton · Toronto · Vancouver
Employment by metropolitan area, indexed
Three-month moving average, seasonally adjusted; start of period = 100.
Chart loads when it comes into view.
Latest values: Calgary 1,053,000 (2026-10); Edmonton 889,000 (2026-10); Toronto 3,792,000 (2026-10); Vancouver 1,705,000 (2026-10); and 2 more in the data table.
Related relationships: Calgary · Edmonton · Toronto · Vancouver · 3 relationships use this data as evidence
The participation rate is 71.4% and the employment rate 66.7% (1st of 6 among the six areas, against 63.8% in Edmonton and 62.2% in Toronto).
Participation rate by metropolitan area
Percent, three-month moving average, seasonally adjusted.
Chart loads when it comes into view.
Latest values: Calgary 71.4 (2026-10); Edmonton 68.7 (2026-10); Toronto 66.9 (2026-10); Vancouver 68 (2026-10); and 2 more in the data table.
Why it happened
The data show where Calgary stands, not why. Since the end of 2019 employment has changed 27.1% in Calgary, 12.7% in Edmonton and 10.9% in Toronto; the data held here cannot say why those paths differ.
Statistics Canada reports that in October employment fell in Alberta and Prince Edward Island and rose in British Columbia and Newfoundland and Labrador. That is the provincial picture and not a statement about Calgary.
Evidence: Statistics Canada: Labour Force Survey, October 2026 (The Daily)
Why it matters
Jobs matter for household income and housing demand. The employment rate says more than the unemployment rate about how much of the adult population is working, because people who stop looking for work leave the unemployment count.
History
Over ten years Calgary's unemployment rate has averaged 8.0%, with a high of 15.5% in June 2020 and a low of 5.1% in August 2022.
Across geographies
Calgary's rate minus Edmonton's is -0.5 percentage points. As context, on a different definition (monthly, province-wide), Alberta's unemployment rate is 7.3% and Canada's 6.7%; these must not be read against the metropolitan three-month averages.
What it influences
Jobs matter for household income and housing demand in the region. The relationship explorer lists the national and provincial links that reach the city, each with its evidence class.
Risks
Not assessed: the exposure of Calgary's employment to particular industries or to US demand. Annual employment by industry is held for the metropolitan area but describes the mix of jobs, not exposure.
What to watch
Statistics Canada's Labour Force Survey (release dates in the calendar).
Prepared with AI assistance.
Follow the relationships
- Calgary 1 with evidence · 2 recorded Open in Studio
- Alberta 14 with evidence · 17 recorded Open in Studio
- Edmonton 1 with evidence · 2 recorded Open in Studio
- Employment 0 with evidence · 0 recorded Open in Studio
Upcoming releases
- 2026-12-04 Labour Force Survey November 2026 · Statistics Canada
Sources for this section (2 datasets, 1 documents)
Data
- Labour force characteristics by census metropolitan area, three-month moving average, seasonally adjusted (14-10-0459-01; 13 series; latest October 2026; retrieved 2026-11-07)
- Labour force characteristics, monthly, seasonally adjusted and trend-cycle (14-10-0287-01; 2 series; latest October 2026; retrieved 2026-11-07)
Documents cited
- Statistics Canada: Labour Force Survey, October 2026 (The Daily) (retrieved 2026-11-07)
Each dataset is used under its licence; attribution and series-level detail are in each chart’s “About this data” panel. Limitations: Metropolitan rates are three-month moving averages from the Labour Force Survey and are noisier than national figures. They are not comparable with provincial or national monthly rates and are never charted with them. Annual employment by industry is a Labour Force Survey sample estimate (noisy for small groups); wages and demographic breakdowns for the metropolitan area are not held; the 2021 Census industry mix is in a separate section.
Is inflation in Calgary higher or lower than in the other large cities?
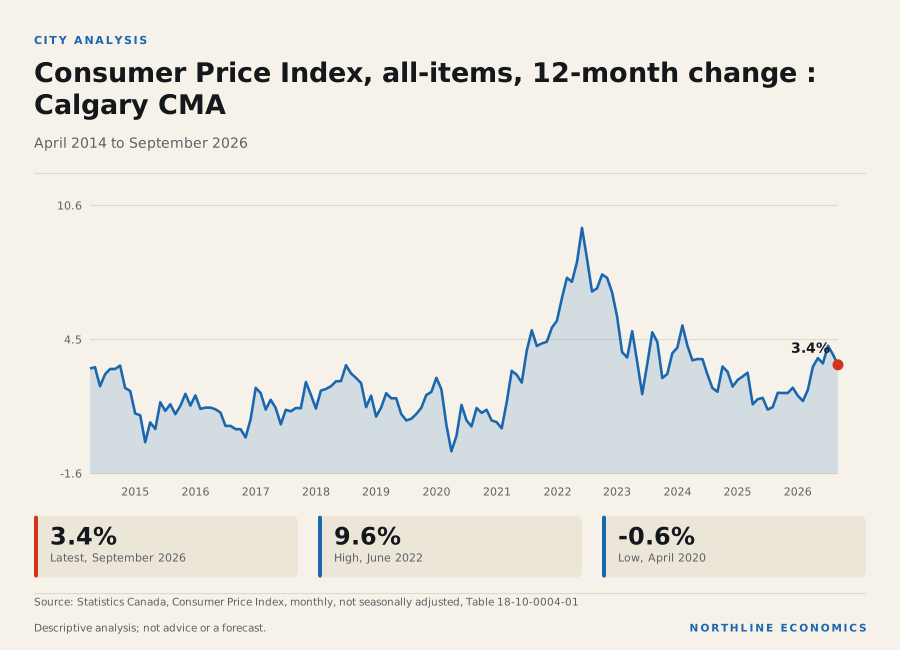
Calgary's inflation rate was 3.4% in the year to September 2026, 2nd of 6 among the six large metros, against 3.1% for Canada
Graphic: Consumer Price Index, all-items, 12-month change : Calgary CMA
What happened
Calgary's consumer prices were 3.4% higher in September 2026 than a year earlier (from 2.1% a year before), against 3.5% in Edmonton, 2.1% in Toronto and 3.0% in Vancouver, and 3.1% for Canada.
Consumer price inflation by city
12-month change in the all-items CPI (derived). Ottawa–Gatineau is the Ontario part only.
Chart loads when it comes into view.
Latest values: Calgary 3.36 (2026-09); Edmonton 3.52 (2026-09); Toronto 2.08 (2026-09); Vancouver 3.03 (2026-09); and 2 more in the data table.
Related relationships: Calgary · Edmonton · Toronto · Vancouver
Why it happened
Statistics Canada reports that national headline inflation accelerated in September, led by gasoline, and that excluding gasoline the CPI rose less. Only the all-items index is held here for the city, so this report cannot say what lies behind Calgary's rate. Statistics Canada does note that shelter inflation was held down by falling mortgage interest cost and homeowners' replacement cost nationally, which is a national statement.
Evidence: Statistics Canada: The Daily: Consumer Price Index, September 2026
Why it matters
The CPI measures changes in prices, not their level, so a rate of change says nothing about how expensive the city is. Calgary's rate ranks 2nd of 6 among the six large metropolitan areas and a year earlier it was 2.1%; a rate that is falling or rising against its own recent past tells more than its rank. Because the index covers all items together, it cannot show whether housing, food or energy explains the difference.
History
Calgary's rate has averaged 2.9% over ten years and peaked at 9.6% in June 2022.
Across geographies
Calgary's rate minus Canada's is 0.3 percentage points.
What it influences
Inflation bears on wage bargaining, the policy rate and mortgage renewals; those links are national and not measured for the city.
Risks
Not assessed for Calgary specifically: the national risks are energy prices and tariffs (see the Canada report).
What to watch
Statistics Canada's monthly Consumer Price Index release (calendar).
Prepared with AI assistance.
Follow the relationships
- Calgary 1 with evidence · 2 recorded Open in Studio
- Consumer price inflation 1 with evidence · 1 recorded Open in Studio
- Consumer energy and gasoline prices 3 with evidence · 3 recorded Open in Studio
Upcoming releases
- 2026-11-16 Consumer Price Index October 2026 · Statistics Canada
Sources for this section (1 datasets, 1 documents)
Data
- Consumer Price Index, monthly, not seasonally adjusted (18-10-0004-01; 5 series; latest September 2026; retrieved 2026-10-23)
Documents cited
- Statistics Canada: The Daily: Consumer Price Index, September 2026 (retrieved 2026-11-07)
Each dataset is used under its licence; attribution and series-level detail are in each chart’s “About this data” panel. Limitations: The city CPI is held here for all items only. The table used publishes shelter and its parts for cities, but not food or gasoline, and the shelter series are not held here, so the drivers of the difference with other cities are not measured.
Is Calgary still growing, and how does that compare with the other large cities?
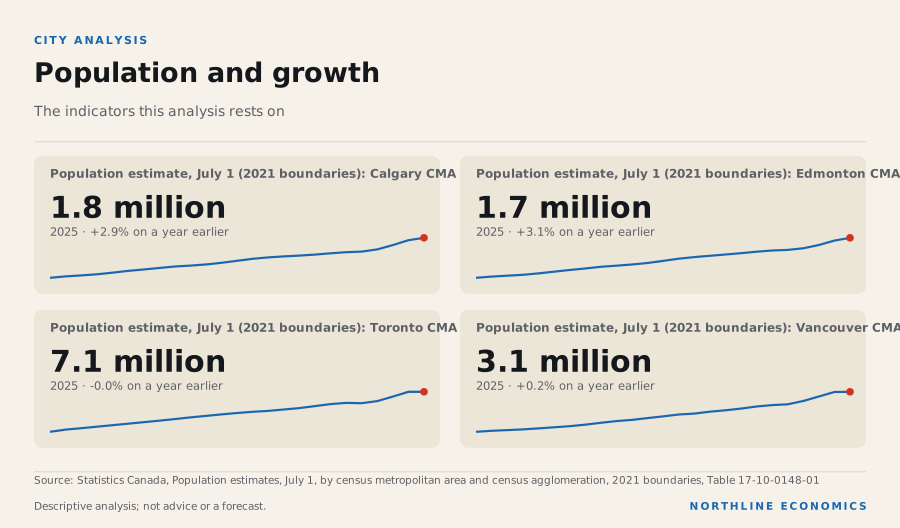
Calgary's population changed 2.9% in the year to July 2025, ranked 2nd of 6 among the six large metropolitan areas
Graphic: Population and growth
What happened
The Calgary metropolitan area had 1.8 million residents on July 1, 2025, a change of 2.9% from a year earlier. Over five years it changed 20.1%, against 15.8% in Edmonton and 9.5% in Toronto. In the latest year the rates were 3.1% in Edmonton, 0.0% in Toronto and 0.2% in Vancouver.
Population by metropolitan area, indexed
July 1 estimates, 2021 boundaries; start of period = 100.
Chart loads when it comes into view.
Latest values: Calgary 1,836,000 (2025); Edmonton 1,692,000 (2025); Toronto 7,109,000 (2025); Vancouver 3,088,000 (2025); and 2 more in the data table.
Related relationships: Calgary · Edmonton · Toronto · Vancouver
Why it happened
Statistics Canada reports that from July 1, 2025, to July 1, 2026, national population growth continued to slow to its lowest since 1944/1945, that the number of non-permanent residents fell by the largest annual amount on record with study-permit holders accounting for most of the decline, and that Ontario, Quebec and British Columbia, which receive the largest shares of international migrants, grew slowest among the provinces.
Evidence: Statistics Canada: The Daily: Canada's population estimates, second quarter 2026
This is the provincial and national explanation; the metropolitan data end in July 2025, before the 2026 decline, so they cannot show it. The components of the metropolitan change are shown below.
In the demographic year that began in July 2024, the Calgary metropolitan area recorded 19 thousand births and 9,538 deaths, 29 thousand immigrants, a net change of 9,608 non-permanent residents, net interprovincial migration of 11 thousand and net intraprovincial migration (movement to and from the rest of the province) of -2,790. The year before, immigrants numbered 31 thousand and the net change in non-permanent residents was 49 thousand. Net non-permanent residents averaged 21 thousand a year over the latest five demographic years.
Where Calgary's population change came from
Persons over the twelve months from July 1 of the year shown (so 2024 is July 2024 to June 2025), 2021 boundaries. Net movements: negative = net outflow. Statistics Canada table 17-10-0149-01.
Chart loads when it comes into view.
Latest values: Immigrants 28,540 (2024); Net non-permanent residents 9,608 (2024); Net interprovincial migration 11,200 (2024); Net intraprovincial migration -2,790 (2024).
Why it matters
Population growth adds workers and households, which can add to demand for housing and services.
History
Over ten years the population changed 29.6%.
Across geographies
Alberta's population changed 1.5% in the more recent year to 1 July 2026, against 0.3% in Ontario; Alberta's net change in non-permanent residents over the same four quarters was -7,957. These are provincial figures.
What it influences
The 2026 fall in non-permanent residents could reduce demand for rental and starter housing in cities that host many international students. The metropolitan change in non-permanent residents to June 2025 is shown among the components above; it does not cover the 2026 fall.
Evidence: Statistics Canada: The Daily: Canada's population estimates, second quarter 2026
Risks
Not assessed: the effect of the federal immigration levels plan on Calgary specifically.
What to watch
Statistics Canada's quarterly provincial and annual metropolitan population estimates and the federal levels plan.
Prepared with AI assistance.
Follow the relationships
- Calgary 1 with evidence · 2 recorded Open in Studio
- Population growth 0 with evidence · 0 recorded Open in Studio
- Federal immigration levels 0 with evidence · 0 recorded Open in Studio
Sources for this section (4 datasets, 1 documents)
Data
- Population estimates, July 1, by census metropolitan area and census agglomeration, 2021 boundaries (17-10-0148-01; 4 series; latest 2025; retrieved 2026-10-23)
- Components of population change by census metropolitan area and census agglomeration, 2021 boundaries (17-10-0149-01; 6 series; latest 2024; retrieved 2026-10-25)
- Population estimates, quarterly (17-10-0009-01; 2 series; latest 1 July 2026; retrieved 2026-10-23)
- Estimates of the components of international migration, quarterly (17-10-0040-01; 1 series; latest Q2 2026; retrieved 2026-10-23)
Documents cited
- Statistics Canada: The Daily: Canada's population estimates, second quarter 2026 (retrieved 2026-11-07)
Each dataset is used under its licence; attribution and series-level detail are in each chart’s “About this data” panel. Limitations: City population is an annual July 1 estimate on 2021 boundaries and ends a year before the latest provincial figures. Components of change come from a separate table (17-10-0149-01) whose demographic year runs from July 1 to June 30; each is labelled by the year in which that year starts, so the latest covers July 2024 to June 2025. They describe how much each component contributed and do not explain why. Births and deaths are not netted here; net emigration, returning emigrants and the table's residual are not shown, so the components shown need not add to the total change.
Is Calgary building enough homes, and what is happening to prices?
Calgary's new-home prices changed 0.0% in the twelve months to September 2026, with 26,252 homes under construction at the end of September 2026 and CMHC putting the annual supply gap at 4,000 to 5,000
Graphic: Housing supply and prices
What happened
Calgary started 24,403 homes over the past twelve months and completed 23,827. At the end of September 2026, 26,252 were under construction, 2.1% against a year earlier (Toronto 88,108, Vancouver 61,680, Edmonton 18,494).
Housing starts by metropolitan area (12-month total)
Total units started over the previous 12 months; CMHC data distributed by Statistics Canada.
Chart loads when it comes into view.
Latest values: Calgary 24,400 (2026-09); Edmonton 19,060 (2026-09); Toronto 23,360 (2026-09); Vancouver 26,600 (2026-09); and 2 more in the data table.
Related relationships: Calgary · Edmonton · Toronto · Vancouver
Housing under construction by metropolitan area
Units under construction at month end, total units; CMHC data distributed by Statistics Canada.
Chart loads when it comes into view.
Latest values: Calgary 26,250 (2026-09); Edmonton 18,490 (2026-09); Toronto 88,110 (2026-09); Vancouver 61,680 (2026-09); and 2 more in the data table.
Related relationships: Calgary · Edmonton · Toronto · Vancouver
The New Housing Price Index for Calgary is 129.7, 0.0% on a year ago and 11.0% since February 2022. Vancouver's index changed -2.1% over the year and Toronto's -4.9%. Index levels are not comparable across cities because each is indexed to its own base.
New housing price index by city, indexed
Total (house and land); start of period = 100. Ottawa–Gatineau is the Ontario part only.
Chart loads when it comes into view.
Latest values: Calgary 129.7 (2026-09); Edmonton 105.7 (2026-09); Toronto 105 (2026-09); Vancouver 123.4 (2026-09); and 2 more in the data table.
Related relationships: Calgary · Edmonton · Toronto · Vancouver
CMHC's Fall 2026 Housing Supply Report puts the additional housing starts needed in Calgary at 4,000 to 5,000 a year over the next decade.
Evidence: Canada Mortgage and Housing Corporation: Fall 2026 Housing Supply Report
Why it happened
The data show how much is being built and what is happening to new-home prices; they do not separate demand, land and construction costs, interest rates and incomes.
CMHC's national assessment is that supply is not keeping up with what is needed for affordability. For Calgary it says the supply gap narrowed over the past year as housing construction outpaced demand; the data held here do not test that.
Evidence: Canada Mortgage and Housing Corporation: Housing starts and construction data, September 2026; Canada Mortgage and Housing Corporation: Fall 2026 Housing Supply Report
Posted mortgage rates are national. Since the first week of January 2026 the posted five-year rate has changed by +0.10 percentage points and the posted one-year rate by -0.35 percentage points, to 6.19% and 5.49% in the week of 28 October 2026 (see the Canada report).
Why it matters
Housing is a large household expense. A supply gap estimate is CMHC's model-based figure, not a forecast of what will be built.
History
The monthly peak of units under construction in the past ten years was 26,633 in January 2026.
Housing completions by metropolitan area (12-month total)
Units completed over the previous 12 months, total units; CMHC data distributed by Statistics Canada.
Chart loads when it comes into view.
Latest values: Calgary 23,830 (2026-09); Edmonton 18,250 (2026-09); Toronto 26,690 (2026-09); Vancouver 27,830 (2026-09); and 2 more in the data table.
Related relationships: Calgary · Edmonton · Toronto · Vancouver
Across geographies
On the six-city comparison, units under construction changed 2.1% in Calgary, -4.2% in Toronto, -2.3% in Vancouver and 4.0% in Edmonton over the twelve months to September 2026. The gap estimates in CMHC's summary table differ widely: Toronto 20,000 to 26,000 units a year, Vancouver 5,000 to 7,000, Montréal 42,000 to 56,000, Ottawa 22,000 to 27,000, Edmonton no measurable housing supply gap.
What it influences
The Bank of Canada describes a link between mortgage costs and housing, and CMHC a link between supply and affordability; neither is estimated for Calgary.
Risks
CMHC's deputy chief economist said a key risk for Canada is not building enough during this period of softening housing markets, and that affordability gains since 2023 will be difficult to sustain unless construction rises.
Evidence: Canada Mortgage and Housing Corporation: Housing starts and construction data, September 2026
What to watch
CMHC's monthly starts, Statistics Canada's New Housing Price Index and building permits (release dates in the calendar), and the Bank of Canada's next announcement on 9 December 2026.
Prepared with AI assistance.
Follow the relationships
- Calgary 1 with evidence · 2 recorded Open in Studio
- Housing costs (prices and rents) 1 with evidence · 1 recorded Open in Studio
- Residential construction 2 with evidence · 2 recorded Open in Studio
- Prime and posted mortgage rates 4 with evidence · 4 recorded Open in Studio
Sources for this section (4 datasets, 2 documents)
Data
- Canada Mortgage and Housing Corporation, housing starts, under construction and completions in selected census metropolitan areas, monthly (34-10-0154-01; 6 series; latest September 2026; retrieved 2026-10-23)
- New housing price index, monthly (18-10-0205-01; 3 series; latest September 2026; retrieved 2026-10-23)
- Conventional 5-year mortgage rate (posted) (V80691335; 1 series; latest 28 October 2026; retrieved 2026-11-03)
- Conventional 1-year mortgage rate (posted) (V80691333; 1 series; latest 28 October 2026; retrieved 2026-11-03)
Documents cited
- Canada Mortgage and Housing Corporation: Fall 2026 Housing Supply Report (retrieved 2026-11-07)
- Canada Mortgage and Housing Corporation: Housing starts and construction data, September 2026 (retrieved 2026-10-22)
Each dataset is used under its licence; attribution and series-level detail are in each chart’s “About this data” panel. Limitations: Starts, completions and units under construction are CMHC counts for the metropolitan area (all unit types). The New Housing Price Index covers new homes only; resale prices are not included, and rents are not covered in this section. Monthly starts and completions are volatile and are shown as twelve-month sums where compared. Building permit values are in current dollars, seasonally adjusted.
What does the data show about industry in Calgary, and what is missing?
Calgary's manufacturing shipments of C$1.7 billion in August 2026 rose 20.0% over the year; energy products were 76% of Alberta's exports in 2025
Graphic: Industry and manufacturing
What happened
Calgary manufacturing shipments were C$1.7 billion in August 2026, a change of 20.0% from a year earlier and 80.5% from December 2019, against 46.6% over the year in Edmonton, 11.6% in Toronto and 21.2% in Vancouver. The latest shipments of petroleum and coal products for Calgary are suppressed by Statistics Canada and are not shown.
Manufacturing shipments by metropolitan area, indexed
Seasonally adjusted, current dollars (so prices are included); start of the period = 100. Cities whose latest value is suppressed are not shown.
Chart loads when it comes into view.
Latest values: Calgary 1,720,000,000 (2026-08); Edmonton 5,326,000,000 (2026-08); Toronto 12,680,000,000 (2026-08); Vancouver 3,594,000,000 (2026-08); and 2 more in the data table.
Value of building permits by metropolitan area (12-month total)
Seasonally adjusted, current dollars, all types of building and work. Ottawa–Gatineau is published only for its Ontario and Quebec parts and is not shown.
Chart loads when it comes into view.
Latest values: Calgary 9.156 (2026-08); Edmonton 6.99 (2026-08); Toronto 29.27 (2026-08); Vancouver 17.06 (2026-08); and 1 more in the data table.
Building permits for the metropolitan area (all types) totalled C$9.2 billion over the twelve months to August 2026, -2.6% on the twelve months before.
The Labour Force Survey's annual estimates for 2025 put 14.3% of Calgary's employment in professional, scientific and technical services, 9.2% in construction, 4.9% in manufacturing and 4.7% in the resource group (forestry, fishing, mining, quarrying, oil and gas).
Why it happened
The metropolitan shipments series is not broken down by industry here, so this report cannot say which products drive Calgary's shipments or how much of the change is price or volume.
Statistics Canada reports that the Industrial Product Price Index rose 14.5% over the year to September, so current-dollar shipments are likely to include a price effect nationally; the Calgary split is not measured.
Evidence: Statistics Canada: The Daily: Industrial product and raw materials price indexes, September 2026
Why it matters
Manufacturing was 4.9% of Calgary's employment in 2025, so shipments describe one part of the metropolitan economy. No evidence in the relationship graph measures how much of Calgary's output or employment depends on oil prices.
History
Calgary's manufacturing shipments peaked at C$1.7 billion in August 2026, the highest in the past ten years.
Across geographies
As provincial context only: energy products made up 76% of Alberta's domestic merchandise exports in 2025 and 85% of those exports went to the United States, while the resource group (forestry, fishing, mining, quarrying, oil and gas) employs 5.6% of Alberta's workers and construction 10.0% (shares of employment, 2025). These are provincial shares and must not be read as describing Calgary.
What it influences
Calgary's manufacturing and construction activity feed local employment and incomes. The explorer records documented exposures for the province, and an observed correlation between oil prices and metropolitan employment (see the connections section), none of which is a measured effect on Calgary.
Risks
Not assessed: the exposure of Calgary employment and output to industry-specific shocks.
Statistics Canada notes that new US tariffs on a range of Canadian products took effect at the end of August. The exposure of Calgary's manufacturers to those tariffs is not measured here.
Evidence: Statistics Canada: The Daily: Canadian international merchandise trade, August 2026
Alberta's first-quarter fiscal update, published in August, said new US tariffs create additional uncertainty but that key Alberta exports remain exempt, limiting the impact on the province.
What to watch
Statistics Canada's monthly manufacturing survey and merchandise trade releases (calendar).
Prepared with AI assistance.
Follow the relationships
- Calgary 1 with evidence · 2 recorded Open in Studio
- Alberta 14 with evidence · 17 recorded Open in Studio
- Manufacturing 12 with evidence · 12 recorded Open in Studio
Upcoming releases
- 2026-11-13 Monthly Survey of Manufacturing September 2026 · Statistics Canada
Sources for this section (3 datasets, 3 documents)
Data
- Manufacturing sales, by industry for 15 Selected Census Metropolitan Areas (16-10-0011-01; 4 series; latest August 2026; retrieved 2026-10-23)
- Building permits, by type of structure and type of work (34-10-0292-01; 1 series; latest August 2026; retrieved 2026-10-23)
- Employment characteristics by census metropolitan area, annual (14-10-0468-01; 5 series; latest 2025; retrieved 2026-11-07)
Documents cited
- Statistics Canada: The Daily: Industrial product and raw materials price indexes, September 2026 (retrieved 2026-10-22)
- Statistics Canada: The Daily: Canadian international merchandise trade, August 2026 (retrieved 2026-10-22)
- Government of Alberta (Treasury Board and Finance): 2026-27 First Quarter Fiscal Update and Economic Statement (retrieved 2026-11-07)
Each dataset is used under its licence; attribution and series-level detail are in each chart’s “About this data” panel. Limitations: Manufacturing sales are current-dollar shipments and move with prices. Annual employment by industry is a Labour Force Survey sample estimate (noisy for small groups); wages and output by industry for the metropolitan area are not held. Alberta figures are provincial and are context only, never a description of Calgary. Shipments for some industries and cities are suppressed by Statistics Canada, including the latest shipments of petroleum and coal products for Calgary.
What do the people who work in Calgary do for a living?
Health care and social assistance was the largest source of Calgary jobs in 2021 at 14.2%, and Mining, quarrying, and oil and gas extraction was the sector in which Calgary's share of jobs stood furthest above the other five areas combined
What happened
In the 2021 Census, 617 thousand jobs were located in the Calgary metropolitan area (people who worked at home or had a usual workplace there; people with no fixed workplace address are not in the table). The three largest sectors were Health care and social assistance (14.2% of jobs), Professional, scientific and technical services (12.9%) and Retail trade (12.5%).
Measured as its share of jobs divided by the other five metropolitan areas' combined share (among sectors that make up at least one fiftieth of Calgary's jobs), the sector in which Calgary stood furthest above the rest was Mining, quarrying, and oil and gas extraction: 4.8% of its jobs, against 1.8% in Edmonton, 0.2% in Toronto, 0.3% in Vancouver, 0.2% in Montréal and 0.1% in Ottawa–Gatineau.
Jobs by industry sector in six metropolitan areas, 2021 Census
Share of jobs located in each metropolitan area (persons who worked at home or had a usual place of work there; people with no fixed workplace address are not in the table), May 2021 reference week, pandemic conditions. Industry structure at one date, not current conditions. Shares are computed by this project from the Census counts.
Chart loads when it comes into view.
Top values: Edmonton 6%; Calgary 4.9%; Vancouver 4.2%.
Why it happened
Not assessed. The table counts jobs by sector at one date and says nothing about why a metropolitan area has the mix it has. This section cites no source that explains Calgary's industry structure.
Why it matters
The industry mix shows what a local economy does for a living, which bears on how it is exposed to changes in demand, prices and policy. It does not measure output, wages or how the economy is performing; those need other tables.
History
Not available from this table: the Census is taken every five years and the platform holds only the 2021 reference week (May 2021). Annual industry employment for the metropolitan area comes from the Labour Force Survey and is in the industry section of this page.
Across geographies
The six metropolitan areas come from one table with one definition, so the shares can be compared with one another. They are shares of jobs located in the area, not of residents' employment, and not comparable with provincial Labour Force Survey industry shares, which use a different survey, year and definition. Alberta is not described here.
What it influences
Not assessed. No relationship in the recorded graph links the metropolitan industry mix to another variable.
Risks
The reference week was in May 2021, during public-health restrictions: Statistics Canada named retail trade, accommodation and food services, and information, culture and recreation among the industries most affected, and said working from home remained an important adaptation. The data are more than five years old and cannot show what has changed since.
Evidence: Statistics Canada: The Daily: Labour Force Survey, May 2021
What to watch
The release of 2026 Census results on industry for metropolitan areas. No release date for them is in the calendar this site holds, and none is assumed.
Prepared with AI assistance.
Follow the relationships
- Calgary 1 with evidence · 2 recorded Open in Studio
Sources for this section (1 datasets, 1 documents)
Data
- Place of work status by industry sector, work activity during the reference year, age and gender: Census metropolitan areas, tracted census agglomerations and census tracts of work (98-10-0492-01; 10 series; latest 1 January 2021; retrieved 2026-10-23)
Documents cited
- Statistics Canada: The Daily: Labour Force Survey, May 2021 (retrieved 2026-11-06)
Each dataset is used under its licence; attribution and series-level detail are in each chart’s “About this data” panel. Limitations: Census 2021, one reference week (May 2021) under pandemic conditions; counts are rounded by Statistics Canada. Jobs located in the metropolitan area (at home or usual workplace); people with no fixed workplace address are excluded. Not current conditions and not output, wages or productivity.
How is Calgary connected to the national and global economy?
Most recorded connections that reach Calgary are national or provincial; the one measured for the city is a correlation with oil prices
Graphic: Connections to the wider economy
What happened
Most recorded connections that reach Calgary are provincial or national. Alberta's exposure to the United States was 85% of its goods exports in 2025; the national export shares that year were 72% to the United States and 4.5% to China.
Twelve-month changes in oil prices and in metropolitan employment are compared in the relationship graph only for Calgary, Edmonton and Toronto, with same-month correlations of 0.37, 0.41 and 0.37. This city is one of the three compared.
Why it happened
Not assessed. This edition cites no source on Calgary's particular trade or investment links, and no data are held.
Why it matters
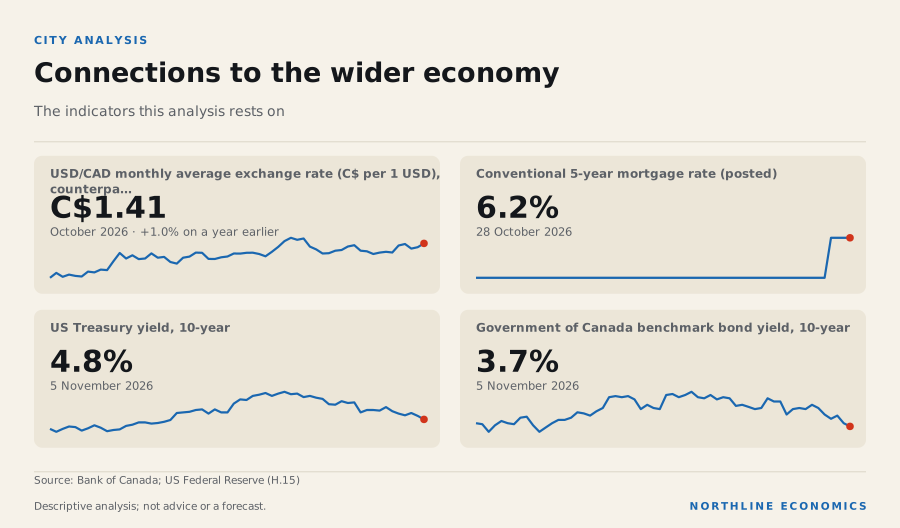
The currency, interest rates and trade partners that matter for Calgary are covered at national level in the Global report: one US dollar cost C$1.4135 on average in October 2026; Canada's posted five-year mortgage rate is 6.19%, which rose 0.10 percentage points over the past year. The US ten-year Treasury yield is 4.84% and Canada's ten-year yield 3.67%; how much of any move in either reaches Calgary's housing market is not measured here.
History
Not assessed.
Across geographies
Bond yields and the posted five-year mortgage rate tend to move together, which matters for housing; the effect on Calgary is not measured.
Evidence: relationship: Government of Canada bond yields and Prime and posted mortgage rates
What it influences
Three chains bear on Calgary: US trade measures to exports (hypotheses nationally, with a sourced provincial statement), rates to mortgage costs and housing (documented nationally) and immigration policy to population (documented nationally and, with no measured size, for the metropolitan area).
Risks
Not assessed beyond the national risks in the Canada report and the global risks in the Global report.
What to watch
The Bank of Canada's next announcement on 9 December 2026, tariff changes and Statistics Canada's monthly trade release (calendar).
Prepared with AI assistance.
Follow the relationships
- Calgary 1 with evidence · 2 recorded Open in Studio
- Alberta 14 with evidence · 17 recorded Open in Studio
- US trade policy toward Canada 0 with evidence · 0 recorded Open in Studio
- Federal immigration levels 0 with evidence · 0 recorded Open in Studio
Upcoming releases
- 2026-11-16 Consumer Price Index October 2026 · Statistics Canada
- 2026-12-04 Labour Force Survey November 2026 · Statistics Canada
Sources for this section (4 datasets, 0 documents)
Data
- USD/CAD monthly average exchange rate (C$ per 1 USD), counterparty US (FXMUSDCAD; 1 series; latest October 2026; retrieved 2026-11-05)
- Conventional 5-year mortgage rate (posted) (V80691335; 1 series; latest 28 October 2026; retrieved 2026-11-03)
- US Treasury yield, 10-year (Federal Reserve statistical release H.15; 1 series; latest 5 November 2026; retrieved 2026-11-07)
- Government of Canada benchmark bond yield, 10-year (BD.CDN.10YR.DQ.YLD; 1 series; latest 5 November 2026; retrieved 2026-11-07)
Each dataset is used under its licence; attribution and series-level detail are in each chart’s “About this data” panel. Limitations: Calgary-specific evidence is thin. Most recorded relationships are national or provincial; highlighting a province or a path in the explorer is not a measured effect on the city.
Recorded relationships that reach Calgary
From the relationship graph. City-specific evidence is thin: most links are at province or national level.
Directly recorded for Calgary
- Calgary is a census metropolitan area located in Alberta (Statistics Canada Standard Geographical Classification). institutional relationship
- Correlation of 12-month change in the WTI price and 12-month change in Calgary metropolitan employment (three-month average): lag 0 months: r = 0.37 (n = 178); lag 3 months: r = 0.397 (n = 178); lag 6 months: r = 0.278 (n = 178); lag 12 months: r = 0.361 (n = 178). All four pre-specified lags are shown. This is an observed association, not a causal estimate. observed correlation
At province or national level (applies to Calgary only through Alberta)
- 85.43% of Alberta's domestic merchandise exports went to the United States in 2025 (customs basis). documented exposure details
- Correlation of 12-month change in the Bank of Canada energy price index and 12-month change in Alberta employment: lag 0 months: r = 0.41 (n = 309); lag 3 months: r = 0.394 (n = 307); lag 6 months: r = 0.325 (n = 304); lag 12 months: r = 0.231 (n = 298). All four pre-specified lags are shown. This is an observed association, not a causal estimate. observed correlation details
- Correlation of 12-month change in the WTI price and 12-month change in Alberta employment: lag 0 months: r = 0.376 (n = 430); lag 3 months: r = 0.328 (n = 427); lag 6 months: r = 0.282 (n = 424); lag 12 months: r = 0.216 (n = 418). All four pre-specified lags are shown. This is an observed association, not a causal estimate. observed correlation details
No relationship has city-specific evidence yet; highlighting a province in the explorer is not a measured effect on Calgary. Open Calgary in the explorer →
What this page does not cover
Stated plainly rather than hidden.
Data requirements
Annual employment by industry group (Labour Force Survey, table 14-10-0468-01), the 2021 Census industry mix and total metropolitan GDP (annual, no industry detail) are now ingested. Output by industry for the metropolitan area is not, and no wage series for the metropolitan area is held: the open Statistics Canada wage tables cover provinces and Canada, not metropolitan areas.not covered
Resale data are licensed. Average rent and vacancy for purpose-built rental structures (CMHC Rental Market Survey) are ingested; condominium, house and basement-suite rents and household income tables for the metropolitan area are not.not covered
Proprietary sources; licensing required.not covered
A project is listed only once its source, status and value have been checked.not covered
How this report is built
Same pipeline, gates and editorial rules as every other page.
Every number is a reference to a published, licence-checked series for the same geography (ca.ab.cma_calgary); metropolitan series are never mixed with provincial or national ones. Statistics Canada tables 14-10-0459-01 (labour), 18-10-0004-01 (CPI), 17-10-0148-01 (population), 34-10-0154-01 (starts, completions, under construction; CMHC data), 18-10-0205-01 (new housing price index), 34-10-0292-01 (building permits) and 16-10-0011-01 (manufacturing shipments, six large cities only), 17-10-0149-01 (components of population change), 34-10-0133-01 and 34-10-0130-01 (rents and vacancy, CMHC Rental Market Survey), 36-10-0468-01 (GDP at basic prices) 98-10-0492-01 (2021 Census jobs by industry) and 14-10-0468-01 (annual employment by industry group). Methodology and sources · Editorial policy.