Research
One customer, many products: Canada’s goods trade with the United States
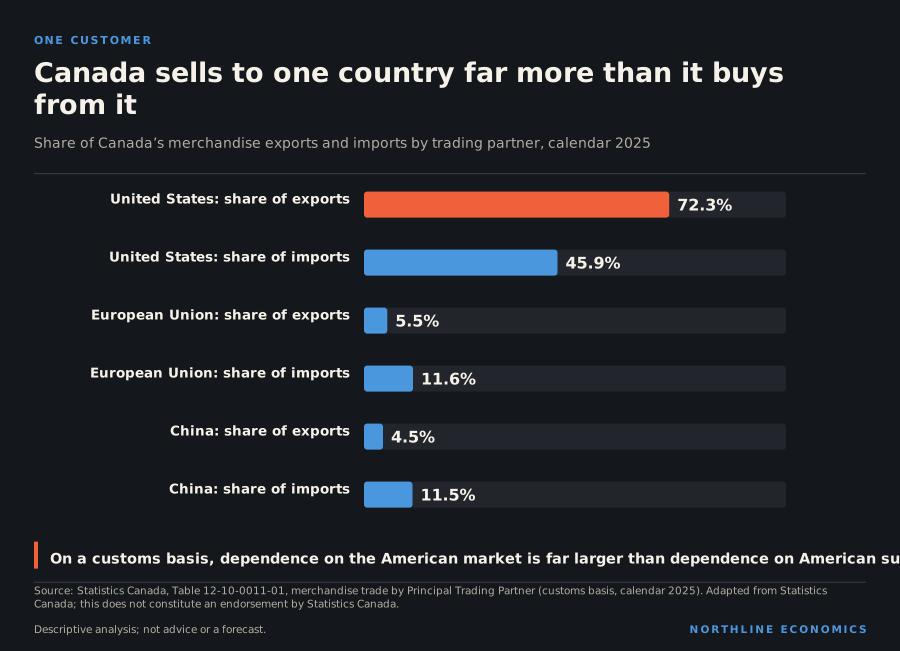
On a customs basis, the United States takes most of what Canada sells and supplies less than half of what Canada buys. That imbalance, and what is in the shipments, is the shape of Canadian trade.
By Northline research deskUpdated 2026-11-0621 min readData to September 2026
The data behind this graphic
| Item | Value |
|---|---|
| United States: share of exports | 72.3% |
| United States: share of imports | 45.9% |
| European Union: share of exports | 5.5% |
| European Union: share of imports | 11.6% |
| China: share of exports | 4.5% |
| China: share of imports | 11.5% |
A lopsided relationship
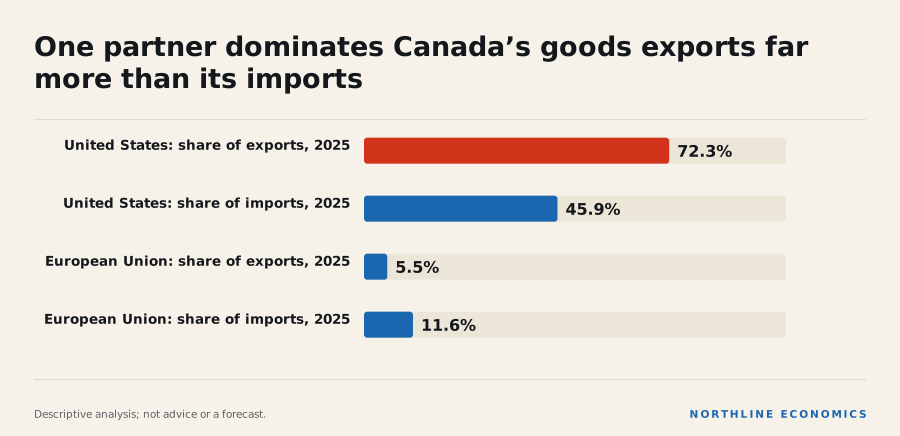
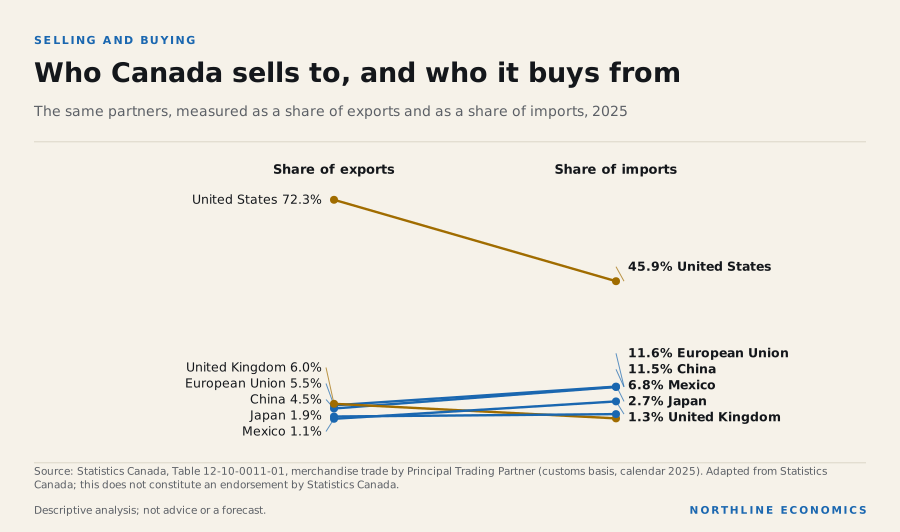
If one country dominates your sales, it matters exactly what you sell it, and how much of what you buy comes back. For Canada the headline is simple. On a customs basis, the United States took 72.3% of merchandise exports in calendar 2025. It supplied 45.9% of imports.
Those two numbers are not mirror images. On that basis, Canada’s dependence on the American market is far larger than its dependence on American suppliers. No other single market comes close: the United Kingdom took 6.0%, the European Union 5.5% as a bloc, China 4.5% and Japan 1.9%. Mexico took 1.1%.
The data behind this graphic
| Item | Share of exports | Share of imports |
|---|---|---|
| United States | 72.3% | 45.9% |
| European Union | 5.5% | 11.6% |
| China | 4.5% | 11.5% |
| United Kingdom | 6.0% | 1.3% |
| Mexico | 1.1% | 6.8% |
| Japan | 1.9% | 2.7% |
The picture reverses on the buying side. The European Union supplied 11.6% of imports and China 11.5%, and Mexico 6.8%, against only 1.1% of what Canada sold there. Canada buys from a wider set of countries than it sells to.
A share that moves
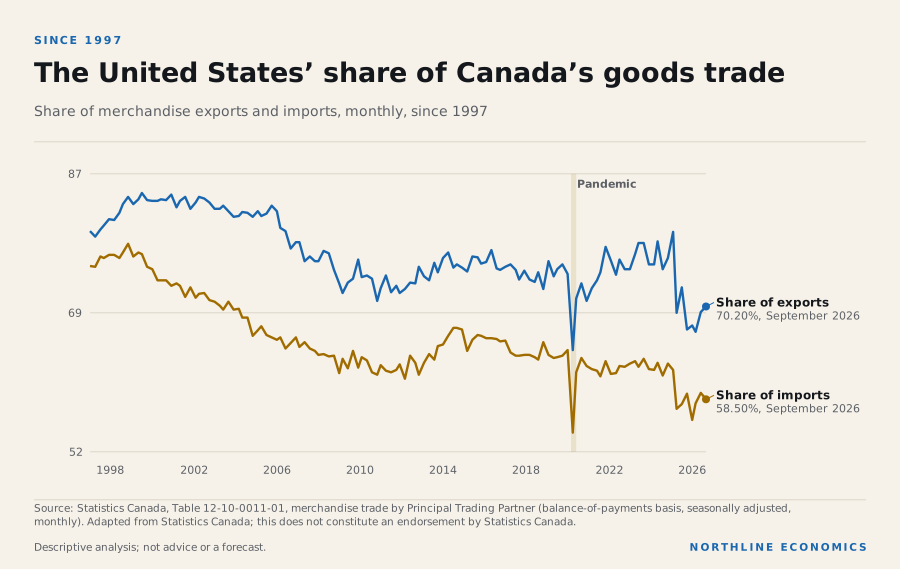
A trade share is not a constant. Over the last twenty-five years the American share of Canadian goods exports has moved a long way.
The data behind this graphic
| Series | Latest |
|---|---|
| Share of exports | 70.20%, September 2026 |
| Share of imports | 58.50%, September 2026 |
The export share peaked at 84.9% in February 2001, fell to 64.7% in April 2020 during the pandemic, climbed back to 79.6% by February 2025 and was 70.2% in September 2026. The twelve-month average to the latest month was 68.2%. The import share peaked at 78.5% in December 1998 and was 58.5% in September 2026.
These monthly shares are on a balance-of-payments basis, seasonally adjusted, and the 2025 shares above are on a customs basis, so the two should not be compared directly. Statistics Canada says customs-basis statistics reflect the physical movement of goods and attribute imports to the country of origin, while balance-of-payments data track changes in ownership and attribute imports to the country of export. Goods made elsewhere and shipped from the United States therefore count as imports from the United States on a balance-of-payments basis, which helps explain why the monthly import share is well above the 2025 customs figure.
Evidence: Statistics Canada: Understanding the Canadian international merchandise trade balance - 2025; Statistics Canada: The Canadian International Merchandise Trade Program (customs basis): Technical Notes
Two cautions apply. A single month is a weak guide, because monthly shares move with energy prices and with the timing of large shipments. And a falling American share does not by itself mean a rise in sales to other markets; the share can fall because energy prices fell, or because American shipments fell, as well as because other shipments rose. These series cannot tell the stories apart.
The long decline from the 2001 peak, the rise from 2020 to early 2025 and the fall since are consistent with several different explanations, among them changes in the mix of what Canada sells, the price of oil and shifts in demand. Northline does not claim any one of them from this chart alone.
What the shipments contain
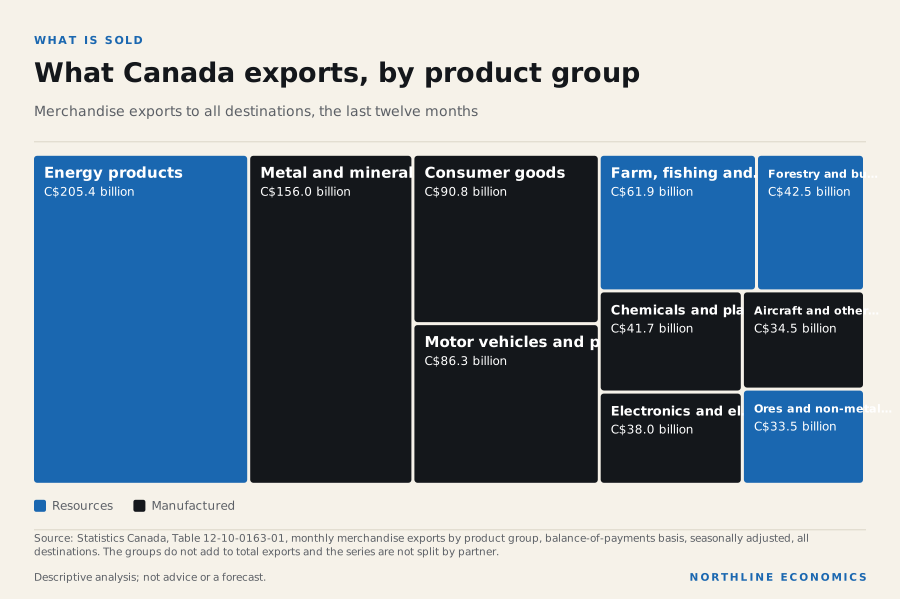
Goods leave Canada in very different forms. The chart below groups merchandise exports to all destinations by product over the last twelve months. It shows the mix of the whole export economy rather than only the American share of it.
The data behind this graphic
| Item | Value |
|---|---|
| Energy products | C$205.4 billion |
| Motor vehicles and parts | C$86.3 billion |
| Farm, fishing and food | C$61.9 billion |
| Metal and mineral products | C$156.0 billion |
| Ores and non-metallic minerals | C$33.5 billion |
| Chemicals and plastics | C$41.7 billion |
| Forestry and building products | C$42.5 billion |
| Consumer goods | C$90.8 billion |
| Aircraft and other transport | C$34.5 billion |
| Electronics and electrical | C$38.0 billion |
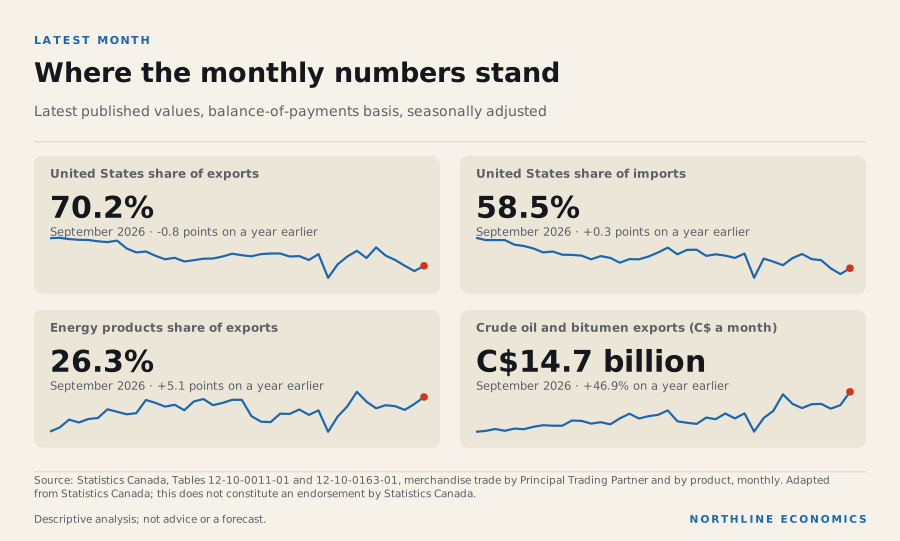
Energy products are the single largest group. They were C$205.4 billion over the last twelve months and 26.3% of all merchandise exports in September 2026. Metal and mineral products, consumer goods, motor vehicles and parts, and farm and food products follow. The point of the picture is its balance: a mix of resources and manufactured goods, with energy the biggest single block.
Because energy prices swing, the energy share can change a good deal from month to month without any change in the volume shipped. Northline therefore treats annual figures as the better guide to structure and monthly figures as a signal to watch.
The data behind this graphic
| Indicator | Place | Latest | Period | Change |
|---|---|---|---|---|
| United States share of exports | Canada | 70.2% | September 2026 | -0.8 points on a year earlier |
| United States share of imports | Canada | 58.5% | September 2026 | +0.3 points on a year earlier |
| Energy products share of exports | Canada | 26.3% | September 2026 | +5.1 points on a year earlier |
| Crude oil and bitumen exports (C$ a month) | Canada | C$14.7 billion | September 2026 | +46.9% on a year earlier |
Surplus with the United States, deficits with most others
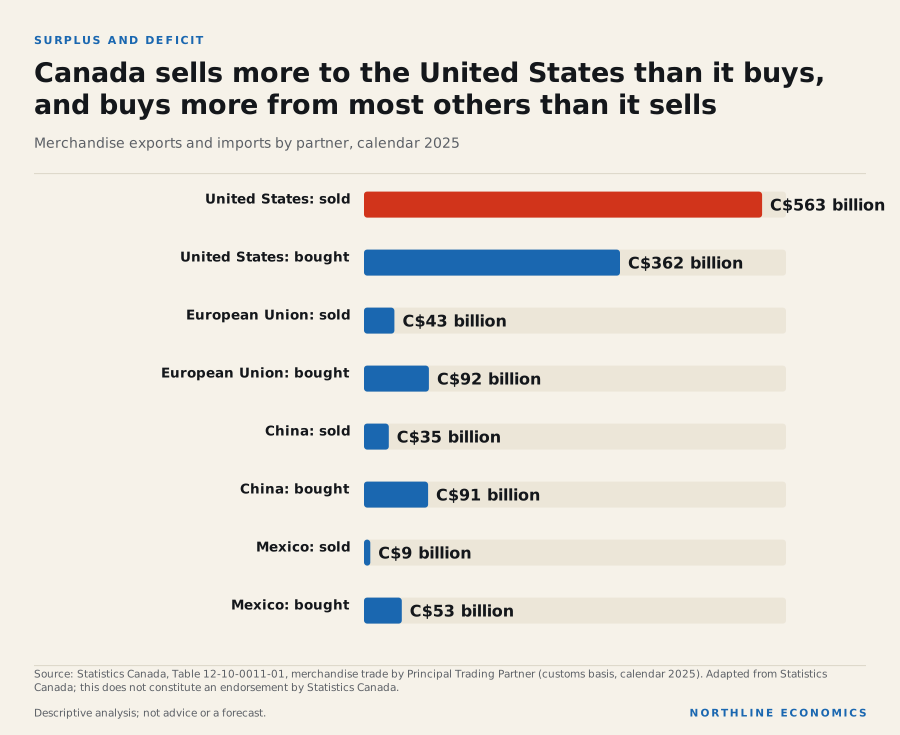
The overall balance of Canada’s goods trade in 2025 was close to zero: exports totalled C$778 billion and imports C$789 billion. That near-balance hides sharply different relationships underneath.
The data behind this graphic
| Item | Value |
|---|---|
| United States: sold | C$563 billion |
| United States: bought | C$362 billion |
| European Union: sold | C$43 billion |
| European Union: bought | C$92 billion |
| China: sold | C$35 billion |
| China: bought | C$91 billion |
| Mexico: sold | C$9 billion |
| Mexico: bought | C$53 billion |
With the United States, Canada sold C$563 billion and bought C$362 billion. With the European Union it sold C$43 billion and bought C$92 billion. With China the figures were C$35 billion sold and C$91 billion bought, and with Mexico C$9 billion against C$53 billion. In other words, deficits with the European Union, China and Mexico offset most of the surplus with the United States.
One reading is that Canada buys manufactured goods from many places and sells resources and some manufactured goods to one. The partner table does not break trade into products by partner, so the data cannot confirm which goods account for each balance.
Some trade runs both ways, some does not
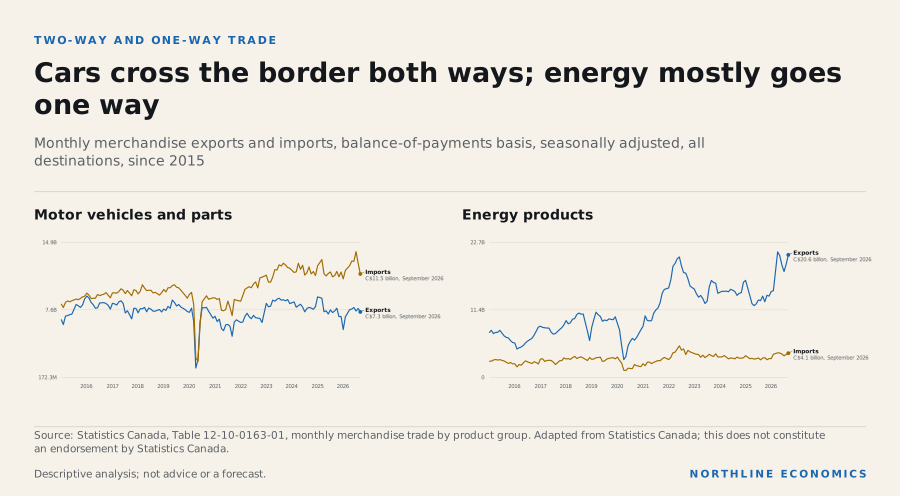
Product series, which are not split by partner, give a different view of the same lopsidedness. Motor vehicles and parts are a two-way trade: Canada exported C$86.3 billion and imported C$146.1 billion over the last twelve months. Energy runs mostly one way: exports were C$205.4 billion against imports of C$44.1 billion.
The data behind this graphic
| Panel | Shows |
|---|---|
| Motor vehicles and parts | lines |
| Energy products | lines |
Two-way trade in the same product group is often the pattern of an integrated production chain, in which parts and finished goods cross the border more than once. One-way trade is the pattern of a product with a clear seller and a clear buyer. The distinction matters for how a disruption spreads: an interruption to a two-way chain affects both sides’ production, while an interruption to a one-way flow mainly affects the seller’s revenue.
What Canada buys
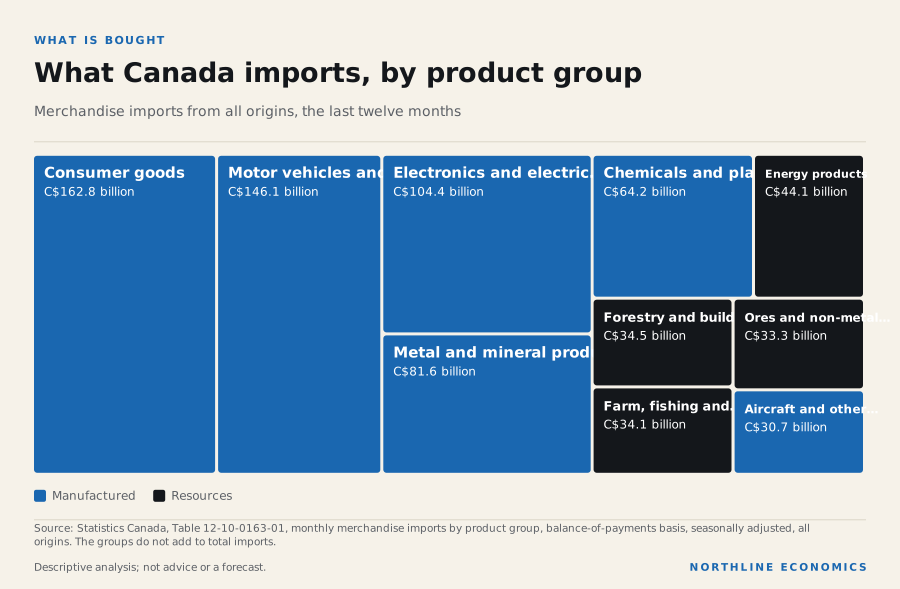
The import side is more varied than the export side. Consumer goods are the largest group at C$162.8 billion, followed by motor vehicles and parts at C$146.1 billion and electronics at C$104.4 billion.
The data behind this graphic
| Item | Value |
|---|---|
| Consumer goods | C$162.8 billion |
| Motor vehicles and parts | C$146.1 billion |
| Electronics and electrical | C$104.4 billion |
| Metal and mineral products | C$81.6 billion |
| Chemicals and plastics | C$64.2 billion |
| Energy products | C$44.1 billion |
| Forestry and building products | C$34.5 billion |
| Farm, fishing and food | C$34.1 billion |
| Ores and non-metallic minerals | C$33.3 billion |
| Aircraft and other transport | C$30.7 billion |
A rough reading of the two treemaps together is that Canada sells a smaller number of large product groups and buys a wider range. The groups overlap in what they contain, so the comparison is about shape and not about any one number.
Selling beyond the border
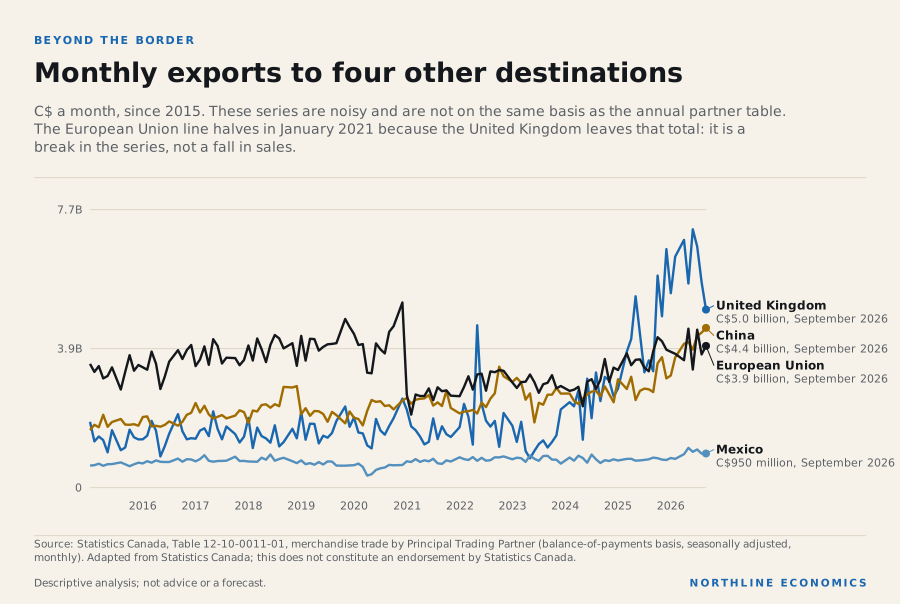
How much of Canada’s selling happens beyond the American market, and is it changing? The monthly series for other destinations are volatile, and a single month can be dominated by one large shipment.
The data behind this graphic
| Series | Latest |
|---|---|
| United Kingdom | C$5.0 billion, September 2026 |
| China | C$4.4 billion, September 2026 |
| European Union | C$3.9 billion, September 2026 |
| Mexico | C$950 million, September 2026 |
Over the last twelve months, exports to the United Kingdom totalled C$74.9 billion, to the European Union C$47.2 billion, to China C$45.2 billion and to Mexico C$10.8 billion. For comparison, exports to the United States totalled C$591.3 billion. The destination series are on a balance-of-payments basis and the annual partner table on a customs basis, so these monthly totals should not be set against the 2025 partner figures above; they are best read as indications of direction within each series.
How the relationship was built
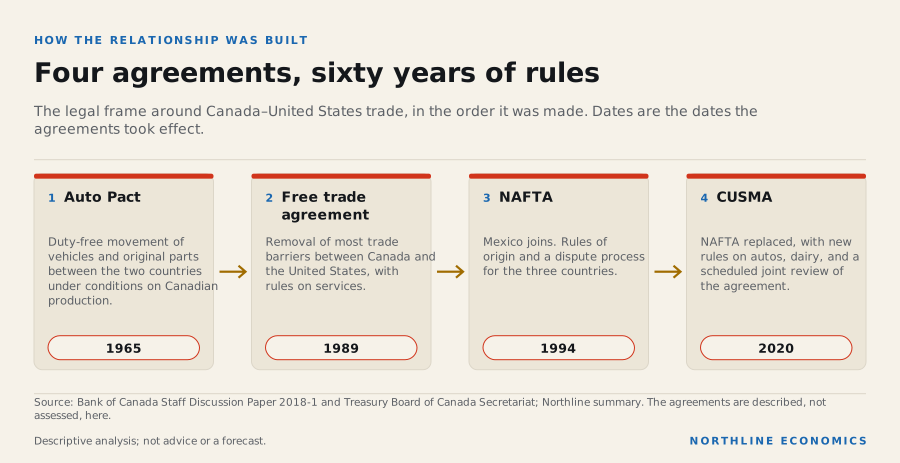
The shares sit within a series of agreements, the first of which pre-dates every figure in this note.
The data behind this graphic
| Step | What happens |
|---|---|
| Auto Pact | Duty-free movement of vehicles and original parts between the two countries under conditions on Canadian production. |
| Free trade agreement | Removal of most trade barriers between Canada and the United States, with rules on services. |
| NAFTA | Mexico joins. Rules of origin and a dispute process for the three countries. |
| CUSMA | NAFTA replaced, with new rules on autos, dairy, and a scheduled joint review of the agreement. |
The Auto Pact of 1965 removed tariffs on vehicles and parts on each side of the border and required Canadian manufacturers to keep the ratio of vehicle production to sales in Canada that existed in 1964. The free trade agreement came into effect at the beginning of 1989: it eliminated most trade barriers between the two countries and was one of the first trade agreements to address trade in services. NAFTA came into effect on 1 January 1994. CUSMA came into force on 1 July 2020, replacing NAFTA. At the joint review on 1 July 2026 the United States did not agree to renew it in its current form, so it was not renewed, though Canada supported renewal. It remains in force until 2036 and can be renewed at any time; under its terms, the parties must now hold a joint review every year for the rest of the term.
Evidence: Bank of Canada: Staff Discussion Paper 2018-1: Canada’s Experience with Trade Policy; Treasury Board of Canada Secretariat: Contracting Policy Notice 2020-2: Replacement of the North American Free Trade Agreement (NAFTA); Office of the United States Trade Representative: Ambassador Greer Issues Statement on the USMCA Joint Review; Global Affairs Canada: Statement by Minister LeBlanc following trilateral CUSMA joint review meeting; Global Affairs Canada: Canada-United States-Mexico Agreement (CUSMA): Chapter 34, Final provisions (consolidated text)
The monthly data in this note begin in 1997, so they cannot show what happened to trade shares in the years just after 1989 or 1994, and this note does not claim that the agreements caused the shares in the charts.
The sequence suggests that a producer deciding in 2025 where to put a plant had been working under a rules-based regime for several decades, and that decisions about supply chains were made on that assumption. If so, changes in the rules, or even the possibility of changes, matter beyond the tariff rate itself: they change the value of investments already made.
Other agreements broadened Canada’s legal access. The Canada–European Union trade agreement (CETA) has applied provisionally since September 2017 and the Comprehensive and Progressive Agreement for Trans-Pacific Partnership (CPTPP) took effect for Canada on 30 December 2018. The charts in this note are not designed to isolate their effects, and a share that changes little can hide growth in absolute terms.
Evidence: Global Affairs Canada: Canada-European Union Comprehensive Economic and Trade Agreement (CETA): View the timeline; Competition Bureau Canada: Competition Bureau Submission to the OECD Global Forum on Competition: Competition Provisions in Trade Agreements (Annex I, date of entry into force)
Levels as well as shares
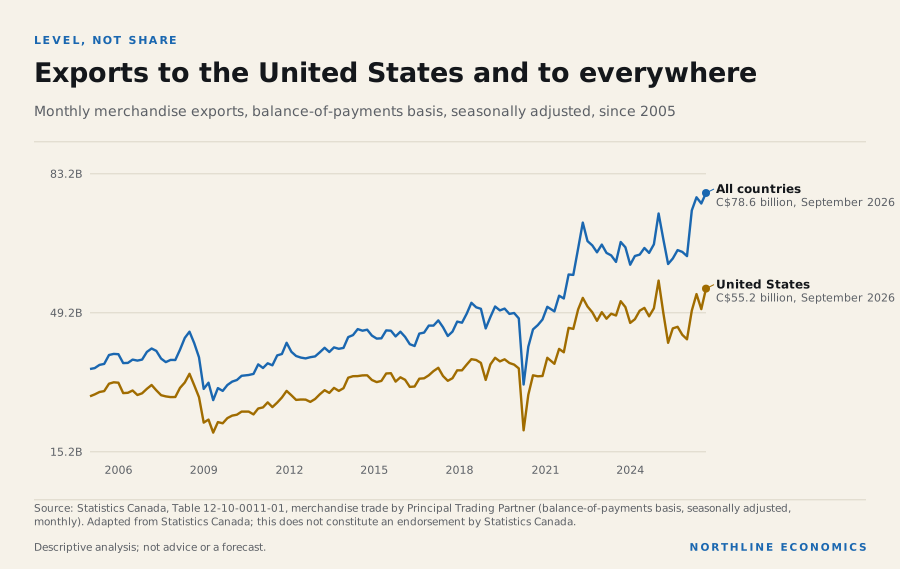
A share can fall while sales to that market rise, if sales elsewhere rise faster. It is worth looking at the level.
The data behind this graphic
| Series | Latest |
|---|---|
| All countries | C$78.6 billion, September 2026 |
| United States | C$55.2 billion, September 2026 |
Exports to the United States were C$55.2 billion in September 2026; exports to all countries were C$78.6 billion. The highest monthly value in the last twenty years for the United States was C$57.1 billion in January 2025, and for all countries C$78.6 billion in September 2026. The two lines move together because the American market is most of the total: when the total is high or low, the United States is usually why, though the latest record owes more to sales elsewhere. Values are in current dollars, so some of the long rise reflects prices and not volumes.
Why geography does so much work
Canada is a mid-sized economy next to the largest. Global Affairs Canada says the two countries share a land border that, at close to 9,000 km, is the longest international border in the world, that most Canadians, 2 out of 3, live within 100 km of it, and that over 100 oil and natural gas pipelines cross it.
Evidence: Global Affairs Canada: Canada-United States relations
Trade between two economies tends to rise with their size and fall with the distance between them, the pattern economists call the gravity model, and for Canada two consequences follow. The first is that transport costs for American customers are lower than for almost any other. A truck can deliver parts to a plant in Michigan in a day. The second is that when trade policy raises the cost of crossing the border, the cost falls on a flow that has been built around not having one. The alternatives, such as a port on the Pacific or Atlantic coasts, are real but require infrastructure that takes years to build and customers that take years to find.
Such routes can change the picture. The Canada Energy Regulator reports that the Trans Mountain Expansion came online in May 2024, nearly tripling the capacity of the system, and that Canadian crude oil exports to countries other than the United States have more than tripled since.
This is why the concentration in the charts is better described as a product of geography and long-standing rules than as a failure of diversification. It also suggests that diversification, where it happens, will be uneven: easiest for goods that already travel by ship, hardest for goods that travel by pipe.
Why the two countries’ numbers rarely match
Statistics Canada attributes exports to the last known destination and, on a customs basis, imports to the country of origin. Its data for Canada’s exports to the United States are derived from American import records, exchanged under a memorandum of understanding between the two countries. Even so, Canada’s reported exports to the United States and the United States’ reported imports from Canada differ. Statistics Canada says country attribution is the main factor, mainly Canada’s re-exports of foreign-origin goods to the United States. Valuation also differs, because the value of Canada’s exports includes the cost of shipping goods to the port of exit, and the two agencies follow different schedules for publishing revisions.
Evidence: Statistics Canada: The Canadian International Merchandise Trade Program (customs basis): Technical Notes; Statistics Canada: Understanding the Canadian international merchandise trade balance - 2025; Statistics Canada: The Daily: Comparing Canadian and US bilateral trade in goods data, 2014, 2015 and 2016
For a reader the lesson is modest but important. Use one source, on one basis, for one comparison, and treat comparisons across sources as estimates of direction rather than exact values. The monthly export-share series here comes from one Statistics Canada table, on a balance-of-payments basis.
The tariff years
Beginning in 2025 the United States introduced tariffs on a range of goods imported from Canada, and Canada answered with measures of its own.
Evidence: Government of Ontario, Ministry of Finance: 2026 Ontario Budget, Chapter 2: Economic Performance and Outlook; Department of Finance Canada: Canada announces targeted countermeasures and substantive support for workers and businesses in response to U.S. tariffs
This note does not record the rates, the products covered or their changes over time, because they have changed repeatedly and the data in this note were not built to measure them. Two points are safe from the series above. First, any tariff acts on a relationship that is both large and unevenly distributed across products, so its effect on a given firm depends on what that firm sells and where it could sell instead. Second, shifts in the monthly share since the beginning of 2025 are shown in the history chart, but a monthly share cannot separate the effect of tariffs from the effects of energy prices, exchange rates, stockpiling before a tariff takes effect, or ordinary variation.
The honest reading is therefore that the data show where the exposure lies and what has moved, not why. A policy analyst who wants to attribute a movement to a tariff needs product-level and firm-level data that this note does not use.
What Canada can change, and what it cannot
For goods, the question is how much of the dependence is a choice. Some of it is. Producers of goods that can travel by ship, such as grain, minerals, wood and many manufactured goods, can sell in other markets at a higher transport cost. Government programmes, trade missions and agreements lower the cost of finding buyers. Over years, the share of non-American customers can rise.
Some of it is not. Pipeline-delivered energy and highly integrated auto production are tied to American counterparts by physical infrastructure and long-term contracts. Their alternatives cost a great deal more or take years to build. A policy aimed at reducing the share of exports going to the United States is likely to move faster in the first group than in the second.
Some of it is a different problem altogether. Services, intellectual property, tourism and investment income are not in these figures, yet they are large parts of how Canada earns income from abroad, and the counterparts are not the same. A narrow focus on goods shares can leave a policy discussion pointed at the wrong target.
A counterintuitive result
It is natural to treat a falling American share as good news about diversification and a rising share as bad news. The data do not allow that conclusion. When oil prices fall, energy exports, most of which go to the United States, fall in value, and the American share can drop without a single new customer elsewhere. Oil prices are one influence, but the share does not simply follow them: in the twelve months to September 2026 Brent rose and the share fell. A reader who wants to know whether Canadian firms are reaching more customers abroad has to look at non-energy exports, at the number of firms exporting, and at the destination of specific products. None of these is established by the shares alone.
Where to read next
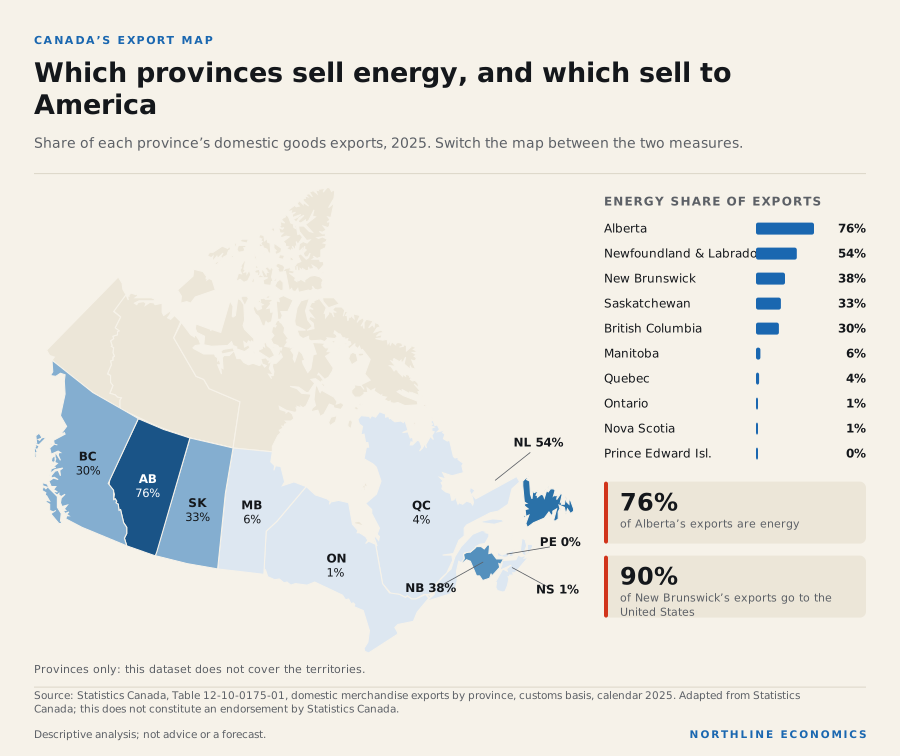
Canada’s export map shows how the same exposure divides among provinces. Canada’s trade partners in 2025 sets out the partner table in full. Reading the productivity gap looks at pay against output per hour.
Three things that look wrong and are not
A falling American share is not a falling American market. The share can fall because other destinations grow, because energy prices fall, or because shipments to the United States fall. Only the third means the United States is buying fewer goods; the first means other markets grew, and the second changes the value of the same shipments.
A trade surplus is not a measure of success. Canada’s surplus with the United States is matched by net deficits elsewhere; its overall balance is close to zero. What matters for a given producer is its own customers, not the national figure.
Dependence on one customer is not the same as dependence on one product. The provincial note, Canada’s export map, shows that energy provinces and manufacturing provinces are both heavily exposed to the United States, for different reasons and with different alternatives.
Why a lopsided relationship matters
There are three ways to read the concentration, and they are not the same.
As market risk. A single dominant buyer means that changes in that buyer’s demand, regulation or trade policy can register quickly in Canadian exports. The data show the exposure; they cannot say how large any change would be.
As a gain from proximity. A large, nearby market is also an advantage for producers who can ship across a land border at low cost. The same data that show dependence show where Canadian firms have found customers.
As a statement about products. Some of what Canada sells to the United States, notably energy, has limited alternative buyers in practice because of how it is transported. Other goods do not. The provincial note, Canada’s export map, shows that the energy provinces and the manufacturing provinces are exposed in different ways.
What this means for decisions
For exporters, the practical question is customer concentration: what share of your own sales goes to one country, and what you would do if that changed. The national share is a benchmark, not a target.
For economic development organizations and policymakers, the balance of selling and buying is a reminder that trade policy affects Canadian producers and Canadian buyers differently. The tools on Northline can show which regions and industries are most exposed to a single market.
For households, the link is indirect: through employment in exporting industries and through the prices of imported goods. This note does not measure either.
Northline does not offer investment or trade advice. The aim is to separate what the data establish from what they only suggest.
What this does not show
The product groups are for all destinations; these series do not say how much of each group goes to the United States. Services trade is excluded. The data describe past shipments and say nothing about the effect of any future tariff, agreement or exchange-rate move. Shares of trade are not shares of output, employment or income.
Method
Annual shares are the sum of twelve monthly customs-basis values for 2025 from Statistics Canada table 12-10-0011-01, divided by the all-countries total. Monthly series are on a balance-of-payments basis, seasonally adjusted, from the same table and, for product groups, from table 12-10-0163-01. Peaks and troughs are the highest and lowest monthly values since 1997. Source: Adapted from Statistics Canada. This does not constitute an endorsement by Statistics Canada.
Keep exploring
- Canada: trade dashboard
- Explore the related relationships
- Canada’s export map: which provinces sell energy, and which sell to America
- Beyond the border: who else Canada sells to and buys from, 2025
- Pay per hour has run ahead of output per hour: reading the productivity gap
Related research
Sources, method and limits
- Limitations
- Goods only. Annual partner figures are on a customs basis; monthly series are on a balance-of-payments basis, seasonally adjusted, and the two are not comparable. The European Union series includes the United Kingdom through December 2020. The product chart covers all destinations because these series are not split by partner. A trade share is not a share of output or employment, and the data do not say what any tariff or agreement would do. Services trade is excluded.
- Preparation
- Prepared by the Northline research desk with AI assistance; every figure is read from the data library or a cited source at build time.
Data
- International merchandise trade for all countries and by Principal Trading Partners, monthly (12-10-0011-01; 8 series; latest September 2026; retrieved 2026-11-05). Adapted from Statistics Canada, International merchandise trade for all countries and by Principal Trading Partners, monthly, Table 12-10-0011-01. This does not constitute an endorsement by Statistics Canada. and Statistics Canada, International merchandise trade for all countries and by Principal Trading Partners, monthly, Table 12-10-0011-01. This does not constitute an endorsement by Statistics Canada.
- International merchandise trade by commodity, monthly (12-10-0163-01; 7 series; latest September 2026; retrieved 2026-11-05). Adapted from Statistics Canada, International merchandise trade by commodity, monthly, Table 12-10-0163-01. This does not constitute an endorsement by Statistics Canada.
Documents
- Statistics Canada: Understanding the Canadian international merchandise trade balance - 2025 (retrieved 2026-11-06)
- Statistics Canada: The Canadian International Merchandise Trade Program (customs basis): Technical Notes (retrieved 2026-11-06)
- Bank of Canada: Staff Discussion Paper 2018-1: Canada’s Experience with Trade Policy (retrieved 2026-11-06)
- Treasury Board of Canada Secretariat: Contracting Policy Notice 2020-2: Replacement of the North American Free Trade Agreement (NAFTA) (retrieved 2026-11-06)
- Office of the United States Trade Representative: Ambassador Greer Issues Statement on the USMCA Joint Review (retrieved 2026-11-06)
- Global Affairs Canada: Statement by Minister LeBlanc following trilateral CUSMA joint review meeting (retrieved 2026-11-06)
- Global Affairs Canada: Canada-United States-Mexico Agreement (CUSMA): Chapter 34, Final provisions (consolidated text) (retrieved 2026-11-07)
- Global Affairs Canada: Canada-European Union Comprehensive Economic and Trade Agreement (CETA): View the timeline (retrieved 2026-11-06)
- Competition Bureau Canada: Competition Bureau Submission to the OECD Global Forum on Competition: Competition Provisions in Trade Agreements (Annex I, date of entry into force) (retrieved 2026-11-06)
- Global Affairs Canada: Canada-United States relations (retrieved 2026-11-07)
- Canada Energy Regulator: Market Snapshot: Trans Mountain Expansion eases pipeline constraints and increases exports to overseas markets (retrieved 2026-10-25)
- Statistics Canada: The Daily: Comparing Canadian and US bilateral trade in goods data, 2014, 2015 and 2016 (retrieved 2026-11-06)
- Government of Ontario, Ministry of Finance: 2026 Ontario Budget, Chapter 2: Economic Performance and Outlook (retrieved 2026-10-25)
- Department of Finance Canada: Canada announces targeted countermeasures and substantive support for workers and businesses in response to U.S. tariffs (retrieved 2026-11-07)
- Statistics Canada, Table 12-10-0011-01, International merchandise trade for all countries and by Principal Trading Partners, monthly (retrieved 2026-10-22)
Approved by an editor on 2026-11-09; published 2026-11-09. See the corrections log.