Research · British Columbia · Alberta
Ten provincial labour markets: who is tight, who is slack, and what the rate hides
Unemployment rates range by only a few points across the provinces, but employment, vacancies and earnings tell different stories about the same places.
By Northline research deskUpdated 2026-11-0611 min readData to October 2026
The data behind this graphic
| Item | Value |
|---|---|
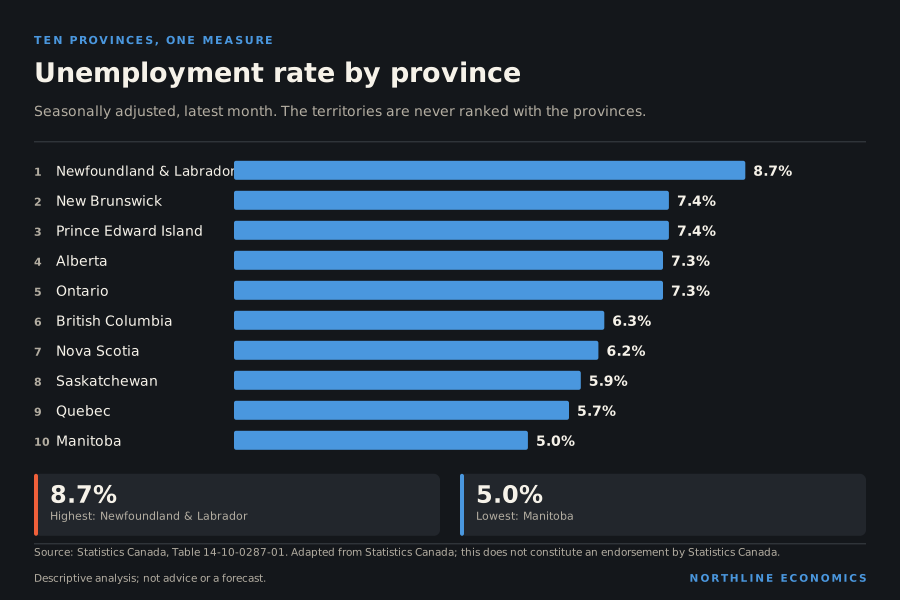
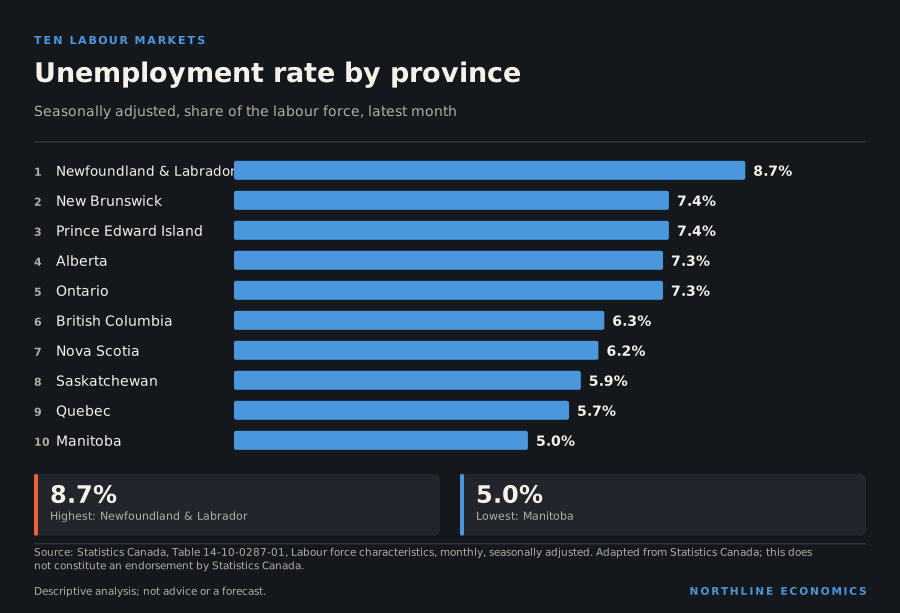
| Newfoundland & Labrador | 8.7% |
| New Brunswick | 7.4% |
| Prince Edward Island | 7.4% |
| Alberta | 7.3% |
| Ontario | 7.3% |
| British Columbia | 6.3% |
| Nova Scotia | 6.2% |
| Saskatchewan | 5.9% |
| Quebec | 5.7% |
| Manitoba | 5.0% |
Summary
In October 2026 seasonally adjusted unemployment across the ten provinces ranged from 5.0% in Manitoba to 8.7% in Newfoundland and Labrador. That spread, 3.7 percentage points, is the part of the story everyone sees. This note looks at what the rate leaves out, and at how the ranking has moved.
The ranking, and what it measures
The unemployment rate is the share of the labour force, people who are working or actively looking, who are looking and not working. It is widely quoted and is available monthly for every province. It is also easy to over-read. It responds to who is counted as looking: a person who stops searching leaves the labour force and the rate falls, and a person who begins to search enters it and the rate can rise even as employment grows.
The ranking in the opening graphic changes slowly. Manitoba is lowest, at 5.0%, followed by Quebec at 5.7% and Saskatchewan at 5.9%. Nova Scotia, at 6.2%, and British Columbia, at 6.3%, sit in the middle. Alberta is at 7.3%, Ontario at 7.3%, New Brunswick at 7.4% and Prince Edward Island at 7.4%. Newfoundland and Labrador is highest, as it has been in nearly every month since 1990.
These are survey estimates. The Labour Force Survey samples households, and for the smaller provinces the sampling error is large enough that a month-to-month change of a few tenths of a point is not meaningful. The ordering of provinces within about half a point of each other should be treated as a tie.
What moved in the last year
The data behind this graphic
| Item | A year earlier | Latest |
|---|---|---|
| British Columbia | 6.6% | 6.3% |
| Alberta | 7.6% | 7.3% |
| Saskatchewan | 5.5% | 5.9% |
| Manitoba | 5.9% | 5.0% |
| Ontario | 7.6% | 7.3% |
| Quebec | 5.3% | 5.7% |
| New Brunswick | 7.7% | 7.4% |
| Nova Scotia | 6.7% | 6.2% |
| Prince Edward Island | 8.2% | 7.4% |
| Newfoundland & Labrador | 10.2% | 8.7% |
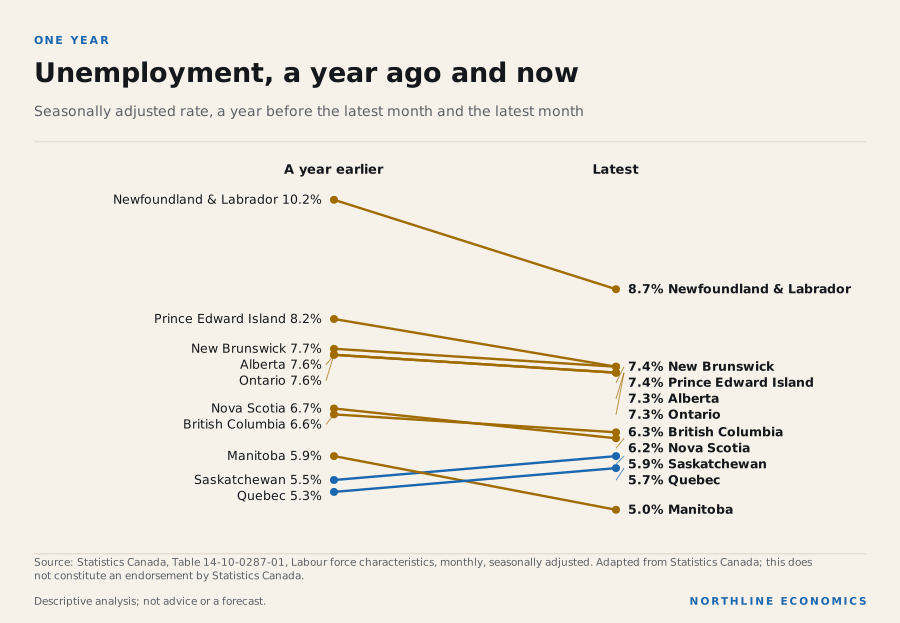
The more informative comparison is with a year earlier. Alberta’s rate fell from 7.6% to 7.3%. Ontario’s fell from 7.6% to 7.3%. Prince Edward Island’s fell from 8.2% to 7.4%, and Manitoba’s fell from 5.9% to 5.0%. In Quebec the rate rose, from 5.3% to 5.7%, and in Saskatchewan it rose from 5.5% to 5.9%.
Falling unemployment can mean more people are working, or that fewer people are looking. To tell which, the next measure is needed.
A second measure: the employment rate
The employment rate is the share of everyone aged 15 and over who has a job. It does not depend on who is searching. It does depend on age: a province whose population is older has more people past the usual working years and a lower employment rate for that reason alone.
The data behind this graphic
| Item | September 2019 | Latest |
|---|---|---|
| British Columbia | 62.7% | 60.7% |
| Alberta | 66.7% | 63.8% |
| Saskatchewan | 65.5% | 63.1% |
| Manitoba | 63.4% | 63.1% |
| Ontario | 61.7% | 59.9% |
| Quebec | 62.0% | 60.0% |
| New Brunswick | 56.4% | 55.8% |
| Nova Scotia | 57.4% | 58.5% |
| Prince Edward Island | 61.3% | 60.8% |
| Newfoundland & Labrador | 51.3% | 52.4% |
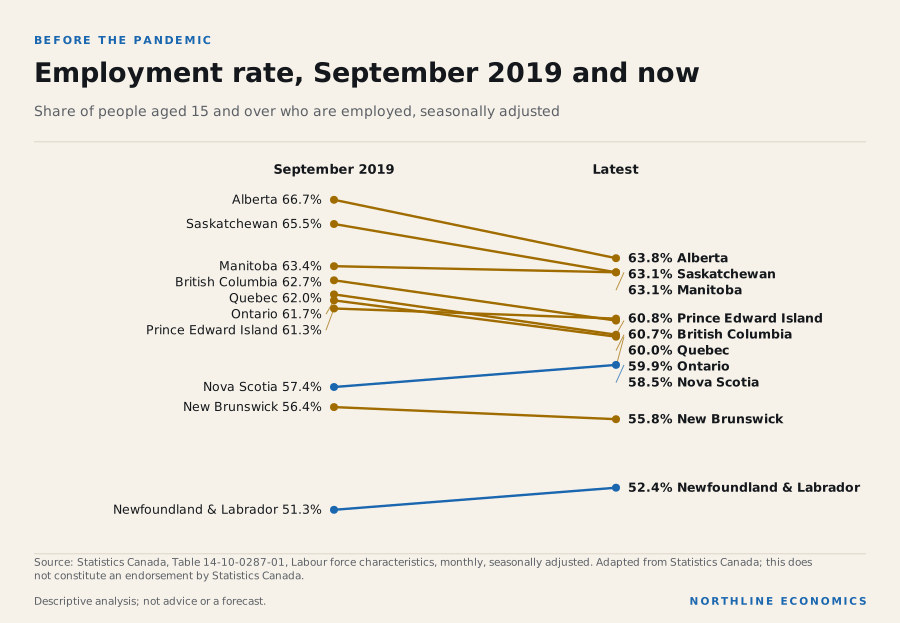
Compared with September 2019, the last pre-pandemic autumn, employment rates in most provinces are lower. British Columbia’s was 62.7% and is now 60.7%; Ontario’s was 61.7% and is 59.9%; Quebec’s was 62.0% and is 60.0%. Alberta’s fell from 66.7% to 63.8%. Nova Scotia’s moved the other way, from 57.4% to 58.5%.
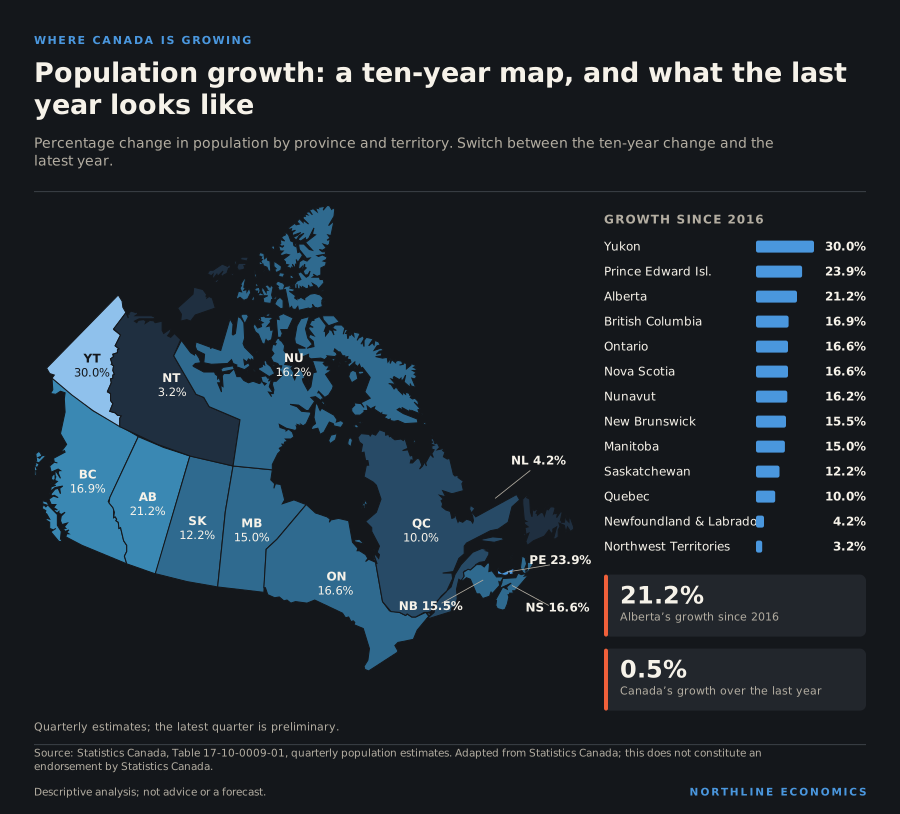
Two readings are consistent with the pattern. One is population ageing: as a larger share of residents reach retirement age, the share with jobs falls even when the labour market is healthy. The other is that rapid population growth, driven by immigrants and temporary residents, adds people faster than jobs, so the share who are employed slips even as the number employed rises. These data cannot separate them, and both may apply. The population note, Three ways to grow or shrink, sets out the flows involved.
The comparison shows why a low unemployment rate is not enough to call a labour market strong. A province can lower its rate by losing people who would be working, and a province can raise its rate by adding people who are searching. Neither is visible in the rate alone.
Jobs created
The data behind this graphic
| Item | Value |
|---|---|
| Nova Scotia | 4.1% |
| Manitoba | 2.2% |
| Prince Edward Island | 1.9% |
| Newfoundland & Labrador | 1.8% |
| Alberta | 1.6% |
| New Brunswick | 1.1% |
| Saskatchewan | 1.0% |
| Ontario | 0.3% |
| British Columbia | 0.0% |
| Quebec | -2.3% |
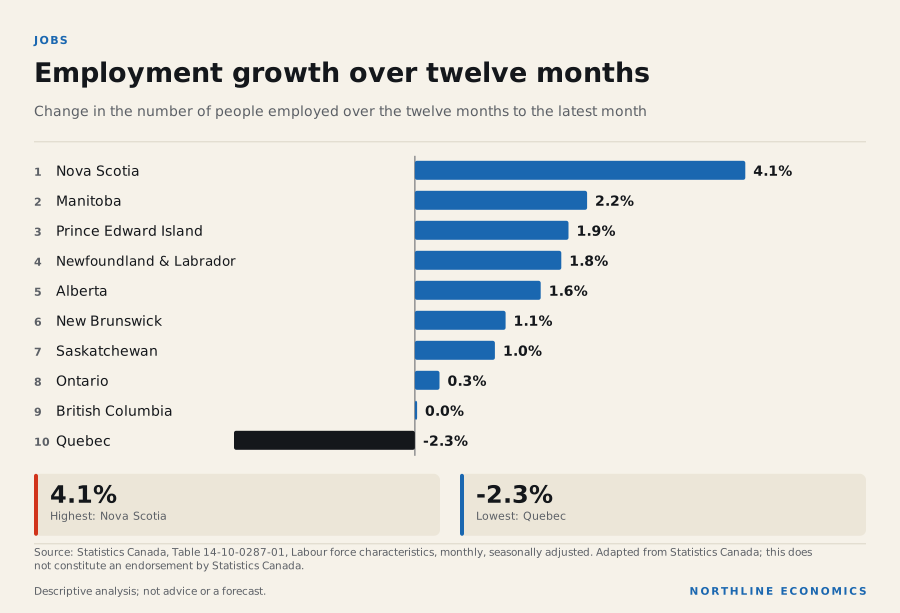
Employment grew over the twelve months in most provinces, was little changed in British Columbia and fell in Quebec. Nova Scotia added 4.1%, Manitoba 2.2% and Prince Edward Island 1.9%. British Columbia’s employment changed by 0.0% and Quebec’s by -2.3%.
A single annual comparison of survey estimates can be shifted by sampling variation, but Quebec’s decline does not rest on one base month: Statistics Canada said in its release for September that employment in the province had trended down since the start of the year, with a cumulative decline of 130,000.
Evidence: Statistics Canada: The Daily: Labour Force Survey, September 2026
The pattern combines with the unemployment figures in a way that shows the limits of each. Quebec’s unemployment rose while its employment fell; Alberta’s unemployment fell while its employment rose. In most provinces the two measures point the same way. Where they diverge, as in Saskatchewan, where employment grew 1.0% while the unemployment rate rose, changes in the size of the labour force are probably doing the work.
A longer view
The data behind this graphic
| Series | Latest |
|---|---|
| Ontario | 7.30%, October 2026 |
| Alberta | 7.30%, October 2026 |
| Quebec | 5.70%, October 2026 |
| Newfoundland & Labrador | 8.70%, October 2026 |
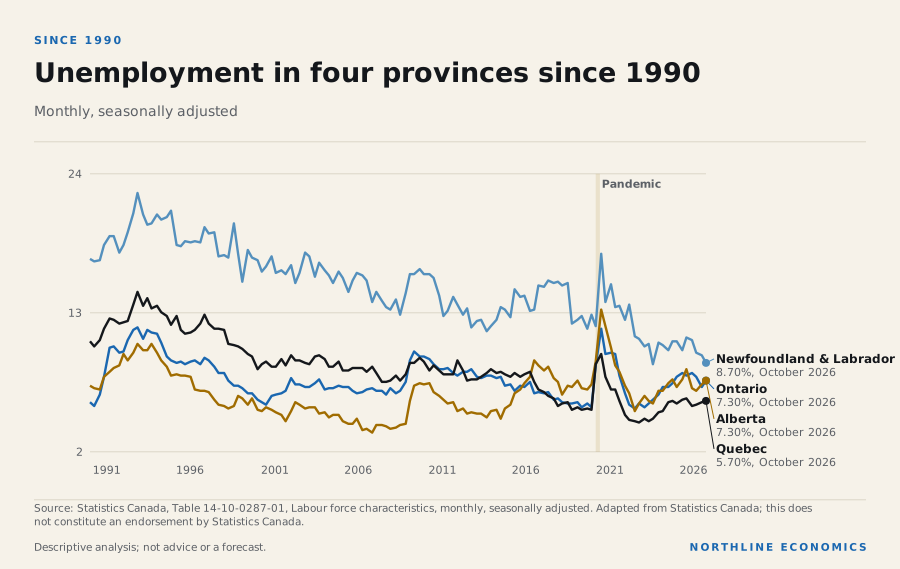
Since 1990 the top of the ranking has hardly changed, but the middle has moved: Ontario had the lowest rate in September 1990 and is now among the highest. Newfoundland and Labrador’s unemployment rate was 16.7% in September 1990 and 8.7% now: lower, and still the highest in the country. Quebec’s fell from 11.0%, in the early-1990s recession, to 5.1% before the pandemic, a large long-run decline, and is 5.7% now. Ontario’s was 8.9% in September 2010, after the financial crisis, and 5.5% in September 2019. Alberta’s was 6.6% in September 2019 and is 7.3% now.
The persistence at the top of the ordering is the most useful fact in the chart. It suggests that the highest rates reflect lasting differences in industry, demographics and seasonality rather than short-lived conditions. A province that has been highest for more than thirty years is not simply having a bad year.
Demand for workers
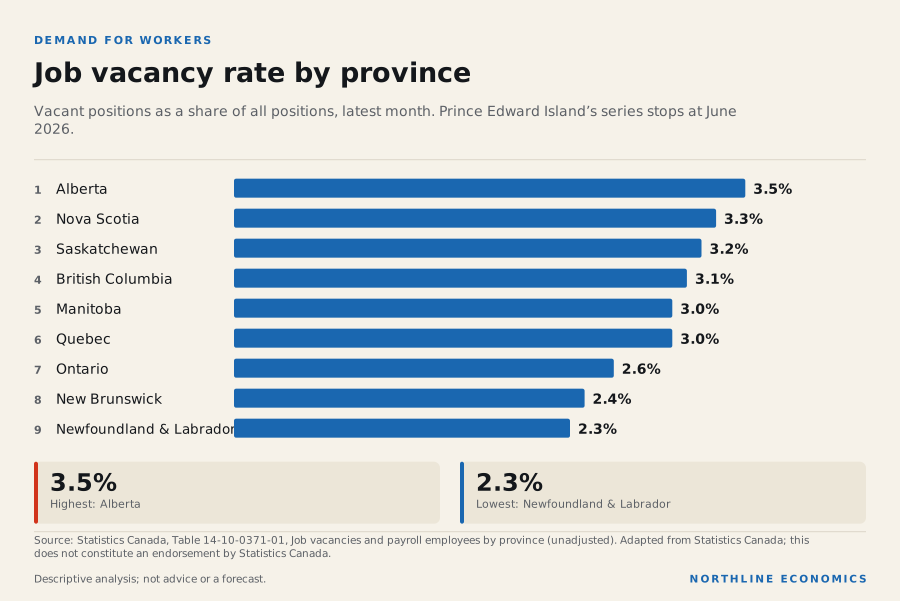
The data behind this graphic
| Item | Value |
|---|---|
| Alberta | 3.5% |
| Nova Scotia | 3.3% |
| Saskatchewan | 3.2% |
| British Columbia | 3.1% |
| Manitoba | 3.0% |
| Quebec | 3.0% |
| Ontario | 2.6% |
| New Brunswick | 2.4% |
| Newfoundland & Labrador | 2.3% |
The job vacancy rate measures unfilled positions as a share of all positions. It is a different angle on tightness: a province can have high unemployment and high vacancies at once if the workers do not match the jobs. In August 2026 British Columbia’s rate was 3.1%, Manitoba’s 3.0%, Alberta’s 3.5% and Ontario’s 2.6%. Saskatchewan’s was 3.2%. The spread is 1.2 percentage points, and these series are published with a longer lag than the labour force series, so the month is earlier than the unemployment figures above.
Newfoundland and Labrador combines the highest unemployment with the lowest vacancy rate, 2.3%: few jobs per job seeker, which is what slack looks like from both sides. Alberta has the highest vacancy rate of the provinces with August figures. A high vacancy rate beside a high unemployment rate would instead point to a mismatch between the workers and the jobs.
Pay
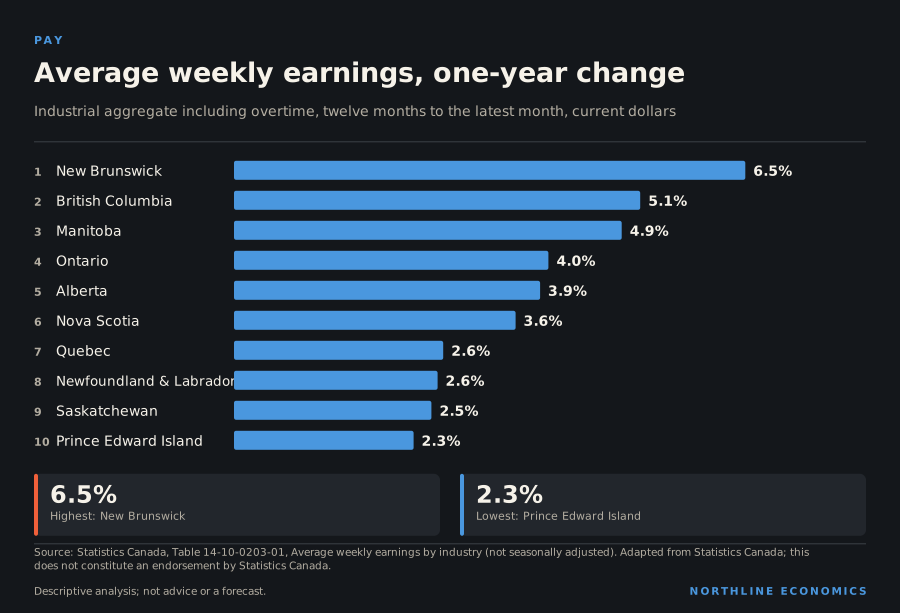
The data behind this graphic
| Item | Value |
|---|---|
| New Brunswick | 6.5% |
| British Columbia | 5.1% |
| Manitoba | 4.9% |
| Ontario | 4.0% |
| Alberta | 3.9% |
| Nova Scotia | 3.6% |
| Quebec | 2.6% |
| Newfoundland & Labrador | 2.6% |
| Saskatchewan | 2.5% |
| Prince Edward Island | 2.3% |
Average weekly earnings rose in every province over the year to August 2026. New Brunswick recorded the largest increase, 6.5%, then British Columbia, 5.1%; Prince Edward Island recorded the smallest, 2.3%, then Saskatchewan, 2.5%. These figures are in current dollars and include the effect of changes in the mix of jobs and in hours worked, so they do not measure pay for the same job. They are also not seasonally adjusted, so the comparison is between the same month in successive years.
In Quebec falling employment and rising unemployment both appear in this release. That is a signal to watch; this note does not explain it, and the survey caveats above apply to both.
Three things that look wrong and are not
The lowest unemployment rate need not mean the highest employment rate. Manitoba’s rate is the lowest in the country while its employment rate, 63.1%, is not the highest. The rate counts only people who are looking.
A falling rate is not necessarily good news. It is good news when employment is rising and the labour force is stable. It is ambiguous when people leave the labour force.
Persistent high unemployment is not a recent development. Newfoundland and Labrador has had the highest rate in nearly every month since 1990.
What this means for decisions
Employers looking for workers should read the vacancy rate and the employment rate together with the unemployment rate. A low unemployment rate suggests a tight market; a low employment rate with a falling unemployment rate suggests the pool of available workers is shrinking.
Policymakers deciding where to place training, relocation or settlement support should note that unemployment gaps between provinces are long-lived.
Job seekers and households deciding whether to move should treat provincial averages as a guide to the market for their own occupation only roughly, since these figures do not distinguish occupations, regions within a province or seasonal work.
Investors may use these series as one input to the strength of local demand. This note does not link them to returns and does not offer investment advice.
What this does not show
The figures are survey estimates, and sampling error matters most for the smaller provinces. They do not describe industries, occupations or regions within provinces; they describe only people aged 15 and over. They do not say why rates differ. Earnings and vacancy series are on different tables with different timing and coverage, and Prince Edward Island’s vacancy series stops at June 2026. The comparison among provinces is like for like within each table, but not across tables.
Where to read next
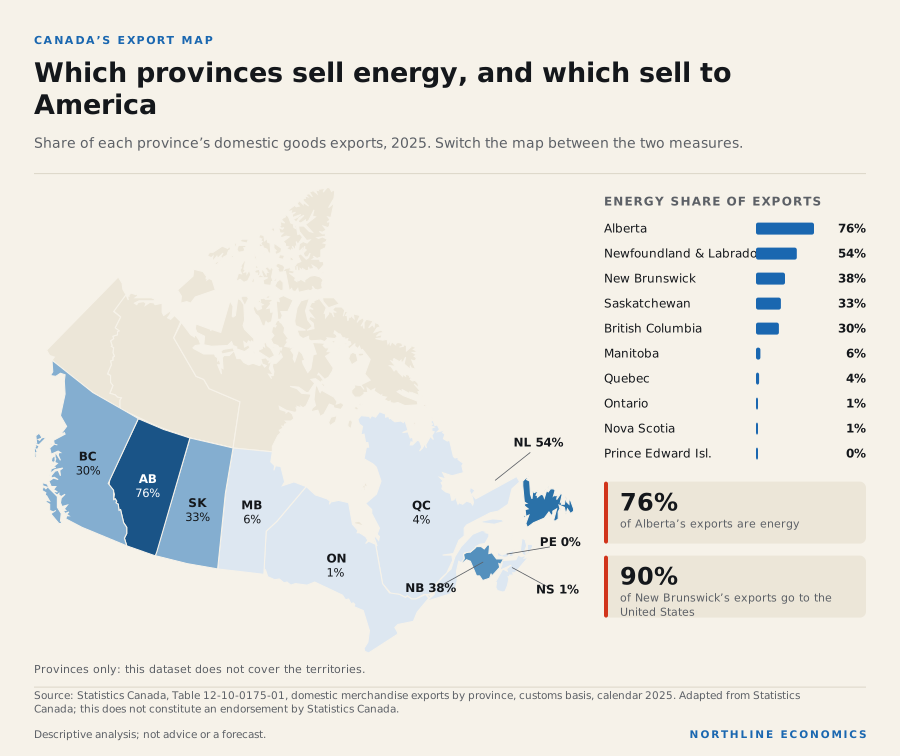
Three ways to grow or shrink shows the flows of people that shape these labour forces. Provinces compared sets the ten provinces side by side on more measures. Canada’s export map shows how provinces differ in what they sell.
Method
All unemployment and employment figures are seasonally adjusted monthly estimates from the Labour Force Survey, Statistics Canada table 14-10-0287-01, for people aged 15 and over. Earnings are average weekly earnings, industrial aggregate including overtime, from the Survey of Employment, Payrolls and Hours (table 14-10-0203-01); vacancy rates are from the Job Vacancy and Wage Survey (table 14-10-0371-01). Comparisons across dates use the same series. Source: Adapted from Statistics Canada. This does not constitute an endorsement by Statistics Canada.
Keep exploring
- /canada/#labour
- Compare these places
- Three ways to grow or shrink: the flows behind each province’s population
- Why Canada's provinces and territories differ: a sourced comparison
- Canada’s export map: which provinces sell energy, and which sell to America
Related research
Sources, method and limits
- Limitations
- Survey estimates with sampling error; one release; no causal explanation.
- Preparation
- Prepared by the Northline research desk with AI assistance; every figure is read from the data library or a cited source at build time.
Data
- Labour force characteristics, monthly, seasonally adjusted and trend-cycle (14-10-0287-01; 23 series; latest October 2026; retrieved 2026-11-07). Adapted from Statistics Canada, Labour force characteristics, monthly, seasonally adjusted and trend-cycle, Table 14-10-0287-01. This does not constitute an endorsement by Statistics Canada.
- Job vacancies, payroll employees, and job vacancy rate by provinces and territories, monthly, unadjusted for seasonality (14-10-0371-01; 6 series; latest August 2026; retrieved 2026-11-05). Adapted from Statistics Canada, Job vacancies, payroll employees, and job vacancy rate by provinces and territories, monthly, unadjusted for seasonality, Table 14-10-0371-01. This does not constitute an endorsement by Statistics Canada.
- Average weekly earnings by industry, monthly, unadjusted for seasonality (14-10-0203-01; 4 series; latest August 2026; retrieved 2026-11-05). Adapted from Statistics Canada, Average weekly earnings by industry, monthly, unadjusted for seasonality, Table 14-10-0203-01. This does not constitute an endorsement by Statistics Canada.
Documents
- Statistics Canada: The Daily: Labour Force Survey, September 2026 (retrieved 2026-10-25)
- Statistics Canada, Table 14-10-0287-01, Labour force characteristics, monthly, seasonally adjusted (retrieved 2026-10-22)
- Statistics Canada, Table 14-10-0371-01, Job vacancies and payroll employees by province (retrieved 2026-10-22)
- Statistics Canada, Table 14-10-0203-01, Average weekly earnings by industry, monthly (retrieved 2026-10-22)
Approved by an editor on 2026-11-09; published 2026-11-09. See the corrections log.