GlobalCanadaCities

Atlas · YVR · British Columbia

Vancouver

3,088,036 people, July 2025. Metropolitan area measures, beside the 13 other cities Northline covers.

Map of Canada with provincial boundaries. The 14 cities Northline covers are listed in the text.

Unemployment rateVancouver among 14 cities

Measure
2021202220232024202520264.0%6.0%8.0%10.0%12.0%7.1%Edmonton7.1%Toronto6.7%Vancouver6.6%Calgary

Pin up to four cities

    Three-month moving average, seasonally adjusted. Statistics Canada, Labour Force Survey.

    Table view
    Latest value for each city.
    CityLatestPeriod
    London8.1%Oct 2026
    Hamilton7.6%Oct 2026
    Toronto7.1%Oct 2026
    Ottawa–Gatineau7.1%Oct 2026
    Edmonton7.1%Oct 2026
    Kitchener–Waterloo7.1%Oct 2026
    Montréal6.9%Oct 2026
    Vancouver6.7%Oct 2026
    Calgary6.6%Oct 2026
    Saskatoon5.9%Oct 2026
    Regina5.9%Oct 2026
    Halifax5.4%Oct 2026
    Winnipeg5.0%Oct 2026
    Québec4.5%Oct 2026

    Vital signs

    Vancouver in eight numbers

    Vital signs for Vancouver
    MeasureLatestPeriod and rank among 14 citiesContextTrend
    Unemployment rate6.7%Oct 2026, eighth highest of 14British Columbia 6.3%, Canada 6.7% (monthly measures)
    Employment rate63.4%Oct 2026, eighth highest of 14
    Consumer prices, 12-month change3.0%Sep 2026, eighth highest of 11British Columbia 3.0%, Canada 3.1%
    Population3,088,036July 2025
    Population growth0.2%Year to July 2025, thirteenth highest of 14
    Housing starts, last 12 months26,601To Sep 2026, second highest of 14
    Average two-bedroom rentC$2,364October 2025, highest of 14
    Rental vacancy rate3.7%October 2025, fifth highest of 14

    City figures are metropolitan-area measures. National and provincial unemployment rates are monthly, so they are close to but not the same measure as the three-month city averages.

    What it is built on

    Jobs by industry

    1. Professional and technical services12.6% vs 11.4%
    2. Health care and social assistance12.5% vs 13.5%
    3. Retail trade12.2% vs 11.6%
    4. Educational services8.4% vs 8.3%
    5. Manufacturing6.6% vs 8.4%
    6. Accommodation and food6.3% vs 4.9%
    7. Finance and insurance5.4% vs 6.3%
    8. Public administration4.9% vs 7.1%
    9. Arts and recreation2.0% vs 1.5%

    Share of jobs by place of work, 2021 Census. The tick marks the 14 cities combined. Total jobs counted: 1,158,545.

    See Vancouver’s skyline in the Field

    Rates and housing here

    Where the ripple reaches Vancouver

    A reading path through recorded links, not a forecast. Effects along a chain are never added or multiplied.

    Follow the ripple

    Where to go next

    ServicesGet a full profileA sourced profile of Vancouver for a lender, board or council. StudioOpen in StudioA workspace prepared from these measures, with the gaps stated.
    YVR · Vancouver CMA · city dashboard

    The Vancouver economy: trade diversification, a stalled population and a housing pivot to rental

    British Columbia's population barely grew over the past year, the province has cut its 2026 growth forecast, and Vancouver's rental vacancy rate in CMHC's October 2025 survey was its highest in more than thirty years. It does not cover wages by city or resale prices; the page lists what is missing.

    Analyze Vancouver in Intelligence Studio

    Opens a workspace prepared from the published Vancouver measures above, with the gaps stated.

    Vancouver versus Calgary in Studio → · Choose other places to compare →

    30 secondsRead the vital signs above; each measure links to its chart or section. Go to the indicators
    5 minutesRead the findings at the top, then the sourced story of what drives this economy. Go to the outlook
    20 minutesRead the local-economy section, then work through the charts and the relationships that reach the city. Go to the charts
    Vancouver at a glance

    What are the main things to know about Vancouver's economy right now?

    Vancouver is a high-participation market with falling new-home prices, and a province whose goods exports in 2025 were less dependent on the United States than most

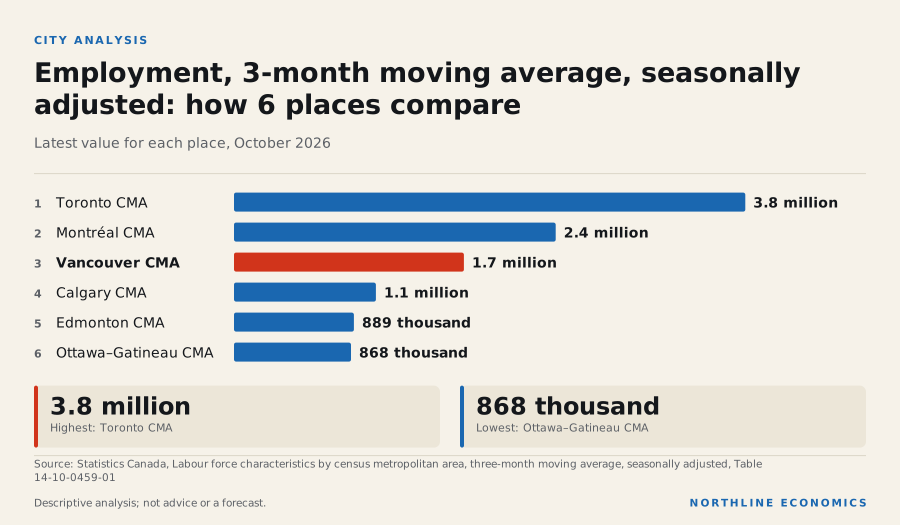
    Graphic: Employment, 3-month moving average, seasonally adjusted: how 6 plac…Employment, 3-month moving average, seasonally adjusted: how 6 places compare. Toronto CMA 3.8 million;…

    Vancouver among the six largest metros

    Vancouver is the most expensive of the six to rent in and the fastest-growing by output over five years. Two-bedroom rents in purpose-built buildings averaged C$2,364 in the October 2025 survey, the highest of the six, with a vacancy rate of 3.7%. Gross domestic product at basic prices was C$202.5 billion in 2022, 38.9% above five years earlier in current dollars, the largest increase of the six.

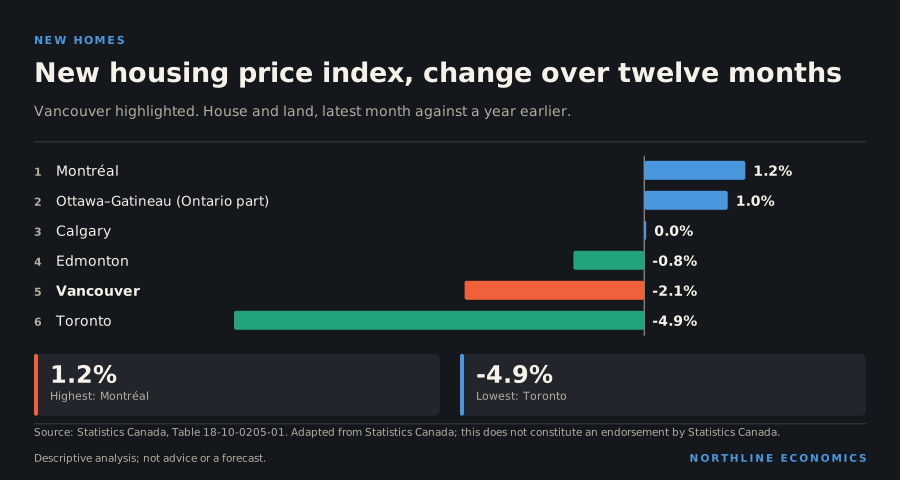
    New housing price index, change over twelve monthsNew housing price index, change over twelve months. Montréal 1.2%; Ottawa–Gatineau (Ontario part) 1.0%; Calgary 0.0%; Edmonton -0.8%; Vancouver -2.1%; Toronto -4.9%.NEW HOMESNew housing price index, change over twelve monthsVancouver highlighted. House and land, latest month against a year earlier.1Montréal1.2%2Ottawa–Gatineau (Ontario part)1.0%3Calgary0.0%4Edmonton-0.8%5Vancouver-2.1%6Toronto-4.9%1.2%Highest: Montréal-4.9%Lowest: TorontoSource: Statistics Canada, Table 18-10-0205-01. Adapted from Statistics Canada; this does not constitute an endorsement by Statistics Canada.NORTHLINE ECONOMICSDescriptive analysis; not advice or a forecast.
    The data behind this graphic
    New housing price index, change over twelve months
    ItemValue
    Montréal1.2%
    Ottawa–Gatineau (Ontario part)1.0%
    Calgary0.0%
    Edmonton-0.8%
    Vancouver-2.1%
    Toronto-4.9%

    Download this graphic (SVG, with source)

    People and jobs

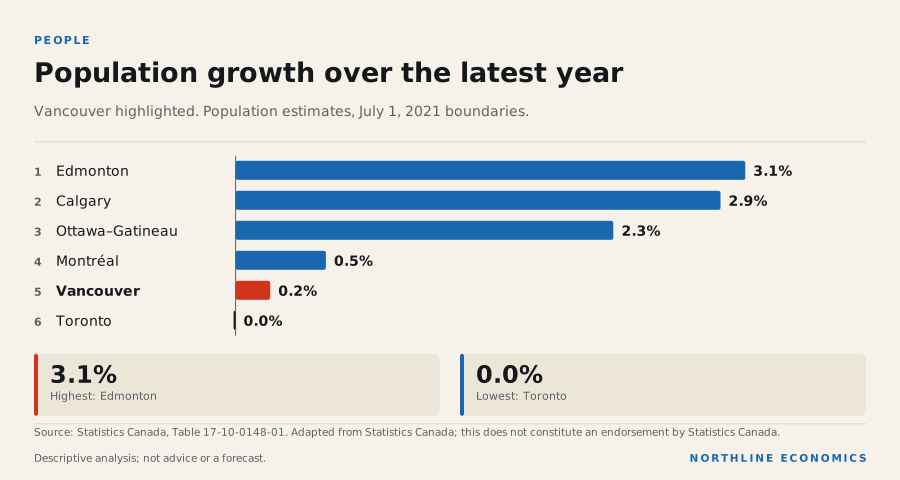
    Population growth is close to zero. The population of 3.1 million changed by 0.2% in the year to July 2025, fifth of six. Net non-permanent residents were -10 thousand and net interprovincial migration -4,656 persons in the latest annual figure, both negative, while immigrants numbered 42 thousand.

    Population growth over the latest yearPopulation growth over the latest year. Edmonton 3.1%; Calgary 2.9%; Ottawa–Gatineau 2.3%; Montréal 0.5%; Vancouver 0.2%; Toronto 0.0%.PEOPLEPopulation growth over the latest yearVancouver highlighted. Population estimates, July 1, 2021 boundaries.1Edmonton3.1%2Calgary2.9%3Ottawa–Gatineau2.3%4Montréal0.5%5Vancouver0.2%6Toronto0.0%3.1%Highest: Edmonton0.0%Lowest: TorontoSource: Statistics Canada, Table 17-10-0148-01. Adapted from Statistics Canada; this does not constitute an endorsement by Statistics Canada.NORTHLINE ECONOMICSDescriptive analysis; not advice or a forecast.
    The data behind this graphic
    Population growth over the latest year
    ItemValue
    Edmonton3.1%
    Calgary2.9%
    Ottawa–Gatineau2.3%
    Montréal0.5%
    Vancouver0.2%
    Toronto0.0%

    Download this graphic (SVG, with source)

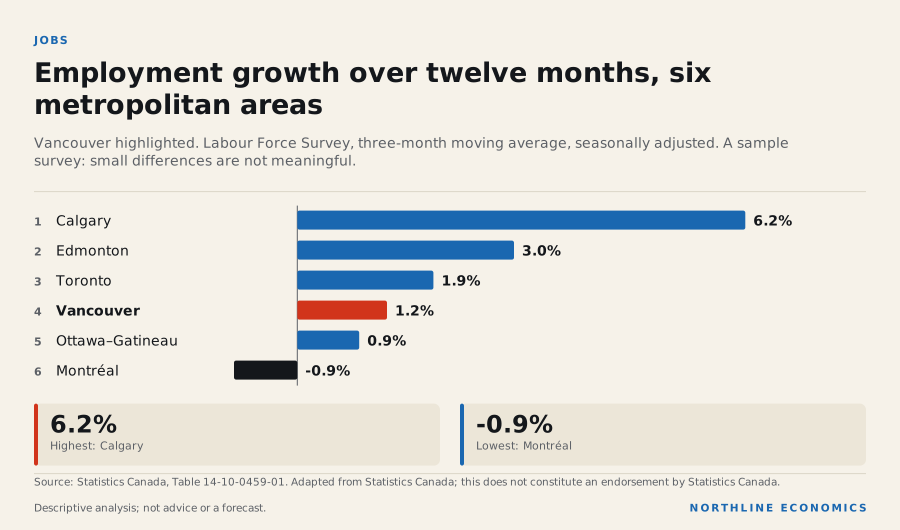
    In October 2026 employment was 1.2% above a year earlier, fourth of six, and the unemployment rate was 6.7%, up slightly from 6.3% a year before. The employment rate of 63.4% is third of six.

    Employment growth over twelve months, six metropolitan areasEmployment growth over twelve months, six metropolitan areas. Calgary 6.2%; Edmonton 3.0%; Toronto 1.9%; Vancouver 1.2%; Ottawa–Gatineau 0.9%; Montréal -0.9%.JOBSEmployment growth over twelve months, sixmetropolitan areasVancouver highlighted. Labour Force Survey, three-month moving average, seasonally adjusted. A samplesurvey: small differences are not meaningful.1Calgary6.2%2Edmonton3.0%3Toronto1.9%4Vancouver1.2%5Ottawa–Gatineau0.9%6Montréal-0.9%6.2%Highest: Calgary-0.9%Lowest: MontréalSource: Statistics Canada, Table 14-10-0459-01. Adapted from Statistics Canada; this does not constitute an endorsement by Statistics Canada.NORTHLINE ECONOMICSDescriptive analysis; not advice or a forecast.
    The data behind this graphic
    Employment growth over twelve months, six metropolitan areas
    ItemValue
    Calgary6.2%
    Edmonton3.0%
    Toronto1.9%
    Vancouver1.2%
    Ottawa–Gatineau0.9%
    Montréal-0.9%

    Download this graphic (SVG, with source)

    Housing

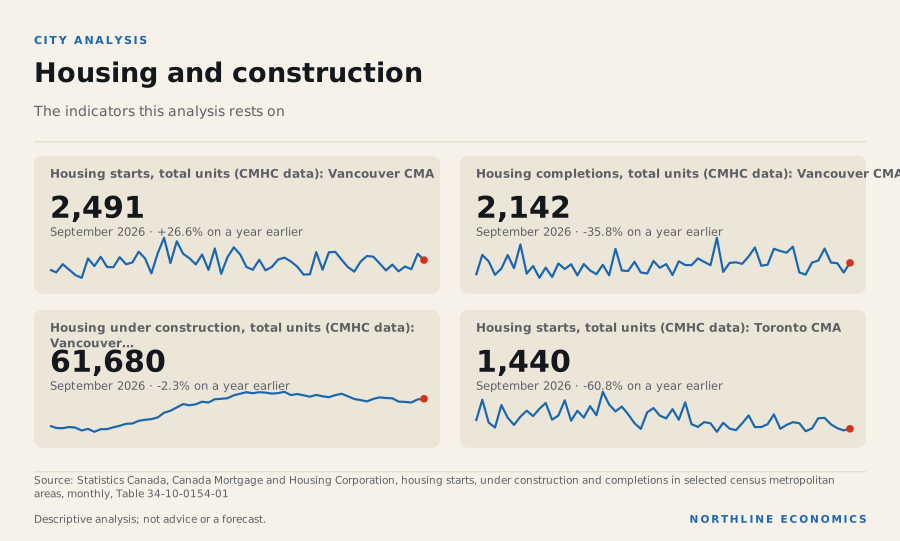
    New-home prices changed -2.1% in the twelve months to September 2026, the second-largest fall of the six. Builders started 2,491 homes in September 2026, almost level with Calgary's 2,535, and 61,680 homes are under construction, second only to Toronto. Manufacturing shipments in August 2026 were 21.2% above a year earlier, and consumer prices rose 3.0% in the twelve months to September 2026.

    What it means for decisions

    For a household or employer, Vancouver combines the highest rents of the six with a population that has almost stopped growing. For a builder, starts and units under construction are high relative to the population's growth, while new-home prices are falling. For an investor, the fast growth in nominal output is a measure that includes inflation and ends in 2022.

    What the data cannot say: they do not show wages, resale prices or the cost of land, they are metropolitan totals, and the survey is a sample. Nothing here is a forecast.

    1. Jobs: unemployment is 6.7% and employment is 1.2% higher than a year ago, slower than Calgary (6.2%) and Toronto (1.9%). The participation rate, 68.0%, is 3rd of 6 among the six. Labour
    1. Prices: inflation is 3.0%, against 3.1% for Canada. The city index is held here for all items only. Prices
    1. People: the population changed 0.2% in the year to July 2025, 5th of 6 among the six metros. British Columbia grew 0.1% over the later four quarters to 1 July 2026. Population
    1. Housing: new-home prices changed -2.1% in the twelve months to September 2026 and -3.6% since February 2022; 61,680 homes are under construction (-2.3% on the year). CMHC puts the extra starts needed at 5,000 to 7,000 a year. Housing
    1. Industry: manufacturing shipments were C$3.6 billion in August 2026, up 21.2% on a year earlier. Industry
    1. Connections: in 2025 only 51% of British Columbia's goods exports went to the United States, against 85% for Alberta, and energy products were 30% of all its goods exports. Connections

    Prepared with AI assistance.

    Follow the relationships

    Upcoming releases

    Sources for this section (11 datasets, 1 documents)

    Data

    Documents cited

    Each dataset is used under its licence; attribution and series-level detail are in each chart’s “About this data” panel. Limitations: Metropolitan labour series are sample-survey estimates, three-month averages, and move more than provincial ones. Output is annual, in current dollars and about four years old; migration series cover the twelve months from July 1 of the year shown. Rankings compare only these six metropolitan areas. No wages, resale prices, commercial real estate or investment records are held for the metropolitan areas.

    0.5 · Output and economic size

    How large is the Vancouver economy, and how fast has it grown?

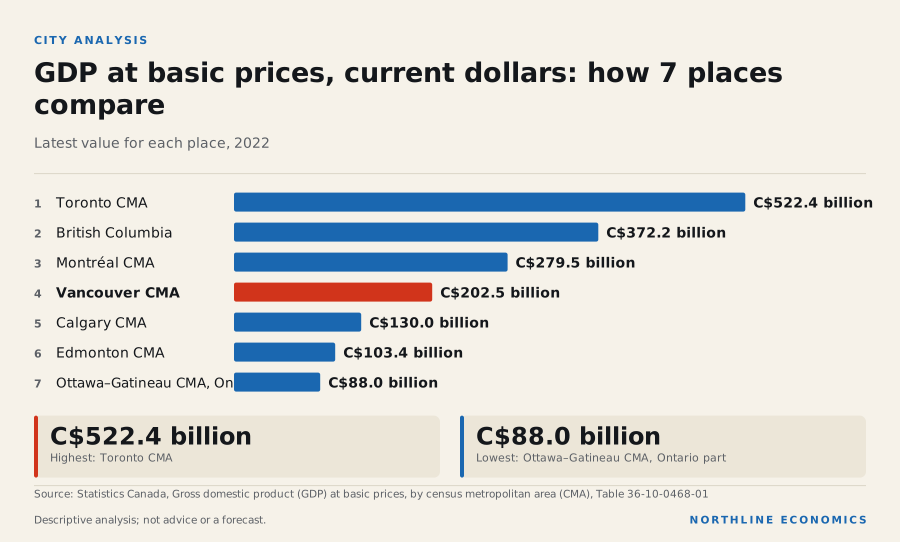
    Vancouver's economy was worth C$202.5 billion in 2022, 54.4% of British Columbia's output, and ranked 3rd of 6 by size among the six large metropolitan areas

    Graphic: GDP at basic prices, current dollars: how 7 places compareGDP at basic prices, current dollars: how 7 places compare. Toronto CMA C$522.4 billion; British Columbia…

    What happened

    At basic prices and in current dollars, the Vancouver economy produced C$202.5 billion of output in 2022, the latest reference year in Statistics Canada's table, equal to 54.4% of British Columbia's total of C$372.2 billion. Among the six large metropolitan areas it ranked 3rd of 6 by size.

    Measured in current dollars, output was 98.1% higher in 2022 than in 2009 and 23.8% higher than in 2019. British Columbia as a whole was 103.4% higher than in 2009 and 30.1% higher than in 2019. Over the same period since 2009 the other metropolitan areas grew 72.4% in Calgary, 54.6% in Edmonton, 85.0% in Toronto, 75.3% in Montréal and 61.1% in Ottawa–Gatineau (Ontario part).

    GDP at basic prices by metropolitan area, indexed

    Annual, current dollars (so prices and population growth are included); 2009 = 100. Statistics Canada table 36-10-0468-01; the reference year lags the present by about three and a half years. Ottawa–Gatineau is published in an Ontario and a Quebec part and is not shown.

    Chart loads when it comes into view.

    Latest values: Vancouver 202,500,000,000 (2022); Calgary 130,000,000,000 (2022); Edmonton 103,400,000,000 (2022); Toronto 522,400,000,000 (2022); and 2 more in the data table.

    Why it happened

    Not assessed. The table is in current dollars, so these changes include price increases, and it is not divided by population, so the figures do not separate growth in the number of people from growth in output per person. This section reports the data; attributed explanations of the differences are in the economic story and local-economy sections of this page.

    Why it matters

    GDP at basic prices is the broadest measure of local production that Statistics Canada publishes for metropolitan areas. It shows how large the local economy is and how its share of the provincial total compares, but not who earns the income, what is produced, or how the economy is doing now.

    History

    The series starts in 2009 and ends in 2022. A fall in output in any year in between would show in the chart; no year-by-year explanation is offered here.

    Across geographies

    Historical context

    The six series are comparable with each other because they come from one table with one definition and one price basis. The metropolitan totals sum, together with the areas outside metropolitan areas, to the provincial totals in the same table, which is why the provincial share above is exact for the reference year; the Statistics Canada footnote notes that there may be a lag between the metropolitan figures and the latest available provincial measures.

    Evidence: Statistics Canada: Table 36-10-0468-01: Gross domestic product (GDP) at basic prices, by census metropolitan area (CMA)

    What it influences

    Not assessed. No relationship in the recorded graph links metropolitan output to another variable.

    Risks

    The table ends in 2022 and describes nothing since; it cannot show the effects of recent changes in interest rates, trade policy, population or commodity prices on Vancouver.

    What to watch

    Statistics Canada's next release of table 36-10-0468-01. No release date for it is in the calendar this site holds, and none is assumed.

    Prepared with AI assistance.

    Follow the relationships

    Sources for this section (1 datasets, 1 documents)

    Data

    Documents cited

    Each dataset is used under its licence; attribution and series-level detail are in each chart’s “About this data” panel. Limitations: Annual, current dollars, GDP at basic prices; the latest reference year lags the present by almost four years. Not adjusted for inflation or population. Industry detail is not part of the table. Metropolitan areas follow Statistics Canada 2021 boundaries.

    0.5 · The Vancouver economy: trade diversification, a stalled population and a housing pivot to rental

    Why is Vancouver's economy under pressure while the province's export base is diversifying, and what is changing in housing?

    British Columbia's population barely grew over the past year, the province has cut its 2026 growth forecast, and Vancouver's rental vacancy rate in CMHC's October 2025 survey was its highest in more than thirty years

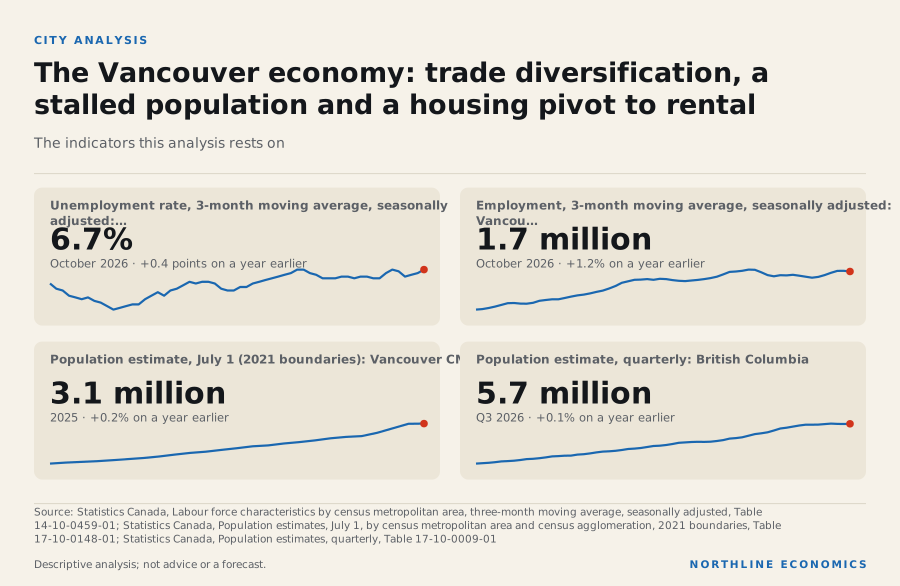
    Graphic: The Vancouver economy: trade diversification, a stalled population …The Vancouver economy: trade diversification, a stalled population and a housing pivot to rental.…

    What happened

    Vancouver's unemployment rate was 6.7% in October 2026 and employment was 1.7 million, 1.2% on a year earlier. The metropolitan population changed 0.2% in the year to July 2025; the province's population changed 0.1% in the four quarters to 1 July 2026. Housing starts over twelve months were 26,601. The average two-bedroom rent in purpose-built rental apartments was C$2,364 in the October 2025 survey and the vacancy rate was 3.7%, from 1.6% a year earlier.

    Why it happened

    Historical context

    The Government of British Columbia's first-quarterly report says the province's population on April 1, 2026 was down 0.9 per cent from a year earlier because of a sharp reversal in international migration, driven by significant declines in non-permanent residents, that the labour force has decreased slightly amid tighter federal immigration policy, and that net interprovincial migration has increased for four consecutive quarters, partly offsetting the outflow. Statistics Canada's estimates, revised in September 2026, show the province up 0.3% from April 1, 2025 to April 1, 2026 instead, and 0.1% over the four quarters to 1 July 2026.

    Evidence: Government of British Columbia, Ministry of Finance: First Quarterly Report 2026/27; Statistics Canada: The Daily: Canada's population estimates, second quarter 2026

    Historical context

    Statistics Canada reports that the Vancouver area grew only slowly in the year to July 2025 because of a net loss of non-permanent residents, against a net gain a year earlier, and that it was the second consecutive year of net losses to other provinces after ten years of gains. The components are in the population section: the net change in non-permanent residents was -10 thousand in the latest year against 92 thousand a year earlier.

    Evidence: Statistics Canada: The Daily: Canada's population estimates: Subprovincial areas, 2025

    Historical context

    The province says its exposure to US tariffs is concentrated in forestry, aluminum and manufacturing, that exports to the United States are down largely because of lower softwood lumber exports, and that exports to other destinations have risen, supported by rising LNG production and higher prices for key commodities.

    Evidence: Government of British Columbia, Ministry of Finance: First Quarterly Report 2026/27

    Historical context

    The province's first-quarterly report says the United States took less than half (47.2 per cent) of B.C.'s goods exports in the first half of 2026 and that the US share has declined for the last three years. In 2025 the US share was 51%, the second lowest of the provinces after Newfoundland and Labrador's 35%.

    Evidence: Government of British Columbia, Ministry of Finance: First Quarterly Report 2026/27

    Historical context

    On the labour market the same report says employment in the first seven months of 2026 was down 0.7 per cent from a year earlier, with the largest declines in wholesale and retail trade, transportation and warehousing, and finance, insurance, real estate, rental and leasing. That is the provincial picture; the metropolitan labour market is in the labour section.

    Evidence: Government of British Columbia, Ministry of Finance: First Quarterly Report 2026/27

    Why it matters

    Historical context

    CMHC's fall 2026 Housing Supply Report says Vancouver's housing market is increasingly centred on rental development, with rental apartments about 60 per cent of starts in 2026 against less than 20 per cent in 2016, that condominium apartment starts fell a further 40 per cent in the first half of 2026, the weakest first half-year since 2011, and that developers favour rental because it carries less risk than condominiums under current conditions. It adds that condominiums have traditionally been Vancouver's primary source of new ownership housing and that the pace of starts remains below what is needed to restore pre-pandemic affordability.

    Evidence: Canada Mortgage and Housing Corporation: Fall 2026 Housing Supply Report

    Historical context

    CMHC's rental report says the vacancy rate across the Vancouver census metropolitan area rose to its highest level in over 30 years, that federal policy changes affecting non-permanent residents softened demand, that rent growth slowed to the lowest same-sample change in 20 years, and that only about 1% – 2% of rental units affordable to lower-income households were vacant.

    Evidence: Canada Mortgage and Housing Corporation: Rental Market Report 2025: major centres (web edition)

    Historical context

    Its mid-year report says landlords report increased competition from new supply as the primary driver of lower asking rents and that, in Toronto and Vancouver, newly completed condominium apartments rented out also contributed.

    Evidence: Canada Mortgage and Housing Corporation: 2026 Mid-Year Rental Market Update

    History

    Vancouver's unemployment rate has ranged from 4.0% (February 2018) to 13.1% (June 2020) over ten years, and the metropolitan population grew 21.7% over ten years.

    Historical context

    The province says its economy grew 2.0 per cent in 2025, and attributes a downward revision to 2026 to temporary weakness in the labour and housing markets weighing on consumer spending and residential investment. Statistics Canada's revised series of 5 November 2026 put 2025 growth at 2.2% in real output at basic prices and 2.2% in real GDP at market prices (2017 constant prices).

    Evidence: Government of British Columbia, Ministry of Finance: First Quarterly Report 2026/27

    Across geographies

    Historical context

    The province reports that homebuilding activity across British Columbia's census metropolitan areas was lower in the first seven months of 2026 than a year earlier, including Vancouver (starts down 9.6 per cent and units permitted down 11.1 per cent), and that benchmark house prices fell in Greater Vancouver and the Fraser Valley.

    Evidence: Government of British Columbia, Ministry of Finance: First Quarterly Report 2026/27

    Historical context

    CMHC says British Columbia and Ontario are likely to see the weakest growth in home prices because of slower population growth, affordability challenges and higher supply.

    Evidence: CMHC: Summer Update: 2026 Housing Market Outlook

    What it influences

    Historical context

    The Prime Minister's office announced on September 29, 2026 that LNG Canada Phase 2 will double the terminal's capacity to 28 million tonnes a year, unlocking a 33-billion-dollar private investment, with more than 4,000 direct construction jobs; the terminal is at Kitimat, not in the metropolitan area.

    Evidence: Prime Minister of Canada: Prime Minister Carney welcomes LNG Canada Phase 2, the second-largest single private investment in Canadian history

    Historical context

    The Budget 2026 fiscal plan allocated 37.7 billion dollars to taxpayer-supported capital investment over three years; the first-quarterly report of September 2026 forecasts 36.4 billion dollars over the same fiscal plan period.

    Evidence: Government of British Columbia, Ministry of Finance: Budget 2026: Fiscal Plan (web summary); Government of British Columbia, Ministry of Finance: First Quarterly Report 2026/27

    Historical context

    The province says the Broadway Subway is scheduled to enter service in fall 2027, serving the province's second-largest jobs centre.

    Evidence: Government of British Columbia: Broadway Subway Project news release (rebuilding Broadway above new SkyTrain stations)

    Risks

    Historical context

    The province lists its main downside risks as a worsening global trade conflict, broadening inflationary pressure from the conflict in the Middle East, a global climate of uncertainty that slows investment, and housing market weakness, and forecasts deficits of 13.8 billion dollars in 2026-27 and 12.7 billion in 2027-28.

    Evidence: Government of British Columbia, Ministry of Finance: First Quarterly Report 2026/27

    Hypothesis, not established

    The Bank of Canada's July 2026 deliberations raised the possibility that the recovery in housing activity could stall given the large inventory of condominiums in Toronto and Vancouver, low population growth and ongoing affordability challenges; that is a possibility the Governing Council raised, not a finding.

    Evidence: Statistics Canada: The Daily: Canada's population estimates, second quarter 2026; Bank of Canada: Summary of Governing Council deliberations: Fixed announcement date of July 15, 2026

    What to watch

    Historical context

    The provincial first-quarterly report forecasts real GDP growth of 0.9 per cent in 2026, revised down from 1.3 per cent at budget, an unemployment rate averaging 6.4 per cent in 2026, and a population decline of 0.9 per cent in 2026 before it rises again from 2027. These are the province's forecasts, not Northline's; for the population, Statistics Canada's estimate for 1 July 2026, published after the report, shows growth of 0.1% over the year instead. Statistics Canada's Labour Force Survey and population estimates and CMHC's starts and Rental Market Survey (release calendar) show how the year is unfolding.

    Evidence: Government of British Columbia, Ministry of Finance: First Quarterly Report 2026/27

    Prepared with AI assistance.

    Follow the relationships

    Sources for this section (9 datasets, 11 documents)

    Data

    Documents cited

    Each dataset is used under its licence; attribution and series-level detail are in each chart’s “About this data” panel. Limitations: Every explanation here is a statement by the named organisation. Most labour, wage, trade and fiscal statements describe British Columbia, not the metropolitan area; Metro Vancouver statements describe the regional district, which is close to but not the same as the census metropolitan area; each is said where it is used. Metropolitan wages, GDP by industry, port volumes, technology and film employment and productivity are not held, so those parts of the story are not told. Forecasts are the publishers' and are not Northline forecasts.
    0.6 · Vancouver's local economy: a port, head-office and visitor city whose expansion projects are large, whose population has stalled and whose housing pipeline is turning to rental

    Who and what are the local drivers of the Vancouver economy, which large projects are under way, and where do the sources describe only British Columbia, the port or the regional district?

    Vancouver's economy rests on a trade gateway, mining and technology head offices, tourism and services; the large projects (a container terminal, a subway, a pipeline terminal) are mostly federal or provincial, population growth has almost stopped, and many sources describe British Columbia rather than the metropolitan area

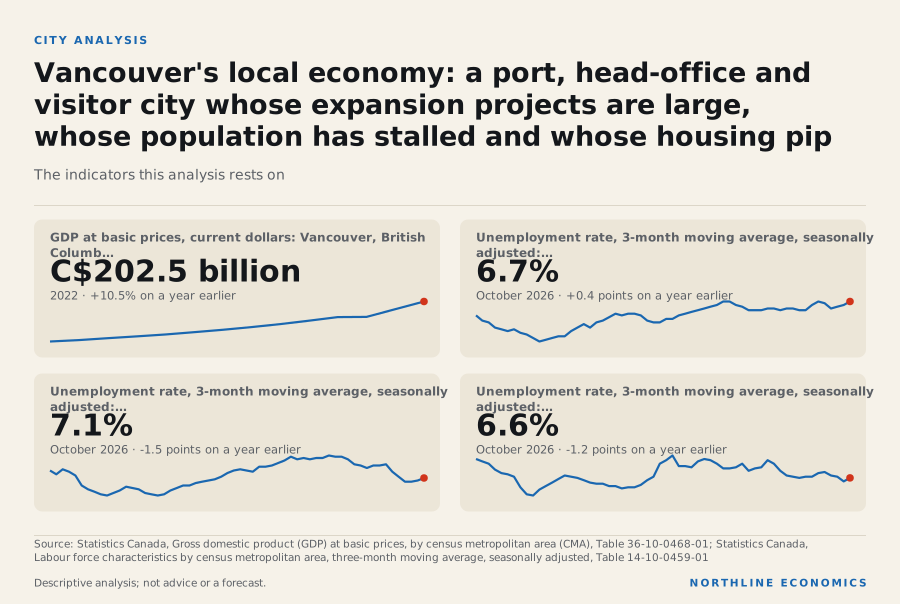
    Graphic: Vancouver's local economy: a port, head-office and visitor city who…Vancouver's local economy: a port, head-office and visitor city whose expansion projects are large, whose…

    What happened

    In the 2021 Census, 1.2 million jobs were located in the Vancouver metropolitan area. Professional, scientific and technical services accounted for 12.6% of them, health care and social assistance 12.5% and retail trade 12.2%. Accommodation and food services were 6.3%, construction 4.2%, finance and insurance 5.4%, transportation and warehousing 4.8% and manufacturing 6.6%. The area's output at basic prices was C$202.5 billion in 2022, the latest year in Statistics Canada's table.

    In October 2026 the unemployment rate (three-month average) was 6.7%, against 7.1% in Toronto, 6.6% in Calgary and 6.9% in Montréal. Employment changed +1.2% in the twelve months to October 2026, against +1.9% in Toronto and +6.2% in Calgary; the participation rate is 68.0% and the employment rate 63.4%. Manufacturing shipments from the area were C$3.6 billion in August 2026, 21.2% on a year earlier.

    The census shares are a 2021 snapshot of where people work, not a list of employers. The rest of this section uses organisations' own statements to say what sits behind them.

    Why it happened

    The port, energy exports and logistics

    Historical context

    Inside Logistics, a trade publication, reports the Vancouver Fraser Port Authority's statement that the port moved 170.4 million tonnes in 2025, nearly eight per cent above the previous record, that international trade rose to a record 147 million tonnes with more than three-quarters tied to Indo-Pacific markets, and that crude oil exports doubled to 24.4 million tonnes, which it attributes to expanded pipeline capacity. Containerized cargo reached 3.8 million twenty-foot units. The port's own statement is not cited. These are whole-port figures, mostly bulk exports; none of the sources held here says how many jobs or how much output in the metropolitan area they represent.

    Evidence: Inside Logistics (trade press, reporting Vancouver Fraser Port Authority): Port of Vancouver posts record cargo volumes in 2025

    Historical context

    The Canada Energy Regulator says the Trans Mountain Expansion came online in May 2024, nearly tripling system capacity to 890 thousand barrels a day, that an average of 23 vessels a month left the Westridge marine terminal between June 2024 and July 2025, and that Canadian crude exports to countries other than the United States have more than tripled.

    Evidence: Canada Energy Regulator: Market Snapshot: Trans Mountain Expansion eases pipeline constraints and increases exports to overseas markets

    Historical context

    Trans Mountain, a Crown corporation, says Westridge in Burnaby has export capacity of up to 630,000 barrels a day and has loaded 528 vessels since May 2024; its plans to raise system capacity are subject to final investment decisions and regulatory approvals.

    Evidence: Trans Mountain Corporation (Crown corporation): Trans Mountain Q1 2026 Corporation Financial Fact Sheet

    Historical context

    The Major Projects Office describes Roberts Bank Terminal 2 at Delta as a proposed three-berth container terminal that would raise the port's container capacity by approximately 50 per cent, with an estimated 17,000 jobs in the supply chain during operations, built on 168 hectares of new industrial land. It says the Government of Canada approved the project in April 2023, subject to conditions, after an environmental assessment by an independent review panel, and that the project is pending final permits. After a notice published on August 28, 2026, it was listed as a project of national interest under Schedule 1 of the Building Canada Act on October 30, 2026. The job and trade figures are the federal office's description of the proponent's project, not an independent estimate.

    Evidence: Major Projects Office (Government of Canada): Roberts Bank Terminal 2 (RBT2); Department of Finance Canada: Budget 2026, Chapter 2: A more competitive and connected Canada

    Resource head offices

    Historical context

    The Mining Association of British Columbia, an industry body, says in a study of 2024 data that Metro Vancouver and Vancouver Island, despite having no mines, account for approximately 20 per cent of the economic benefits of mining in the province, through head-office, professional-service and procurement activity. It counts about 12,360 supported jobs in that combined region, forty per cent of them in the City of Vancouver, and about 957 listed mining and exploration companies headquartered in Metro Vancouver. These are modelled impacts prepared by the industry body, for a region wider than the metropolitan area.

    Evidence: Mining Association of British Columbia (industry association): Mining and Metro Vancouver Economic Impact Study 2026

    Technology, clean technology and film

    Historical context

    Invest Vancouver, Metro Vancouver's economic development service, says the technology sector employed almost 125,000 people, nearly one in every ten jobs in the region, and that the region hosts 77 per cent of the province's sector employment; its data end in 2021. It lists housing-driven cost of living, low productivity growth, scarce industrial land and the unpredictable effect of artificial intelligence as risks to the sector.

    Evidence: Invest Vancouver (Metro Vancouver economic development service): The Expanding Tech Sector in the Metro Vancouver region

    Historical context

    The same agency's newsletter says the region has 260 cleantech companies and that cleantech firms headquartered there raised 5.4 billion US dollars between 2020 and 2024. This is promotional material.

    Evidence: Invest Vancouver (Metro Vancouver economic development service): Invest Vancouver newsletter, July 2025: cleantech

    Historical context

    The Government of British Columbia says, citing Creative BC, that the motion-picture industry supported more than 37,000 jobs in the province in 2022 and 26,000 in 2023, after strike action and a fall in global production, and that foreign productions are more than 80 per cent of production spending on average. It raised the production services credit from 28 to 36 per cent from 2025. These are provincial figures from 2022 and 2023; the sources cited give no later film employment and no metropolitan figure.

    Evidence: Government of British Columbia: Action! B.C. sets the scene to attract more film, TV productions

    Tourism

    Historical context

    Destination Vancouver, the visitor bureau, reports tourism revenues of 8.8 billion dollars, over 66,000 jobs and 11.3 million overnight visitors in 2025 for Vancouver, and downtown hotel occupancy of 73 per cent in June 2026, down 18 percentage points; the page gives no reason. It warns that if hotel rooms in Metro Vancouver stay unchanged, more visitors will be unable to find accommodation. The page does not say whether "Vancouver" in its economic figures means the city or the region, and these are the bureau's own estimates.

    Evidence: Destination Vancouver (Metro Vancouver Convention and Visitors Bureau): Research & Insights

    Wood products and trade exposure

    Historical context

    The province says its exposure to United States tariffs is concentrated in forestry, aluminum and manufacturing, and that year-to-date exports to the United States to June 2026 fell largely because of softwood lumber (down 35.1 per cent), machinery and equipment, natural gas and unwrought aluminum, while exports to other destinations rose.

    Evidence: Government of British Columbia, Ministry of Finance: First Quarterly Report 2026/27

    Opinion

    These are provincial export figures. The sources held here do not give the share of lumber or aluminum activity inside the metropolitan area, so the direct effect of the tariff on Vancouver's own jobs is not measured.

    Why it matters

    Strategy and land

    Historical context

    Metro Vancouver, the regional district, describes Metro 2050 as its long-term plan for managing population, housing and job growth, with tools to direct more growth to transit-oriented locations and to protect the supply of trade-oriented industrial lands.

    Evidence: Metro Vancouver: About Metro 2050: Regional Growth Strategy

    Historical context

    Its 2024 monitoring report says land designated for industrial or employment use in the region decreased slightly from 10,335 hectares in 2015 to 10,250 in 2020, with the developed share rising from 79 to 83 per cent. It also reports that Urban Centres lost 60,870 jobs between 2016 and 2021, and that average regional employment has risen steadily since 2021.

    Evidence: Metro Vancouver: Metro 2050 2024 Annual Performance Monitoring Report

    Historical context

    Metro Vancouver's updated employment projections expect the region to add an average of approximately 20,500 jobs a year between 2024 and 2051; this is a regional district projection, not a forecast by Northline.

    Evidence: Metro Vancouver: Board in Brief, January 30, 2026

    Opinion

    No City of Vancouver economic strategy, budget or staff report is cited, so the City's own economic priorities are not described here. Regional investment promotion is described only through Invest Vancouver's own material.

    Transit and infrastructure

    Historical context

    The province says the Broadway Subway is a 5.7-kilometre extension of the Millennium Line with six new underground stations, serving the province's second-largest jobs centre, and is scheduled to enter service in fall 2027.

    Evidence: Government of British Columbia: Broadway Subway Project news release (rebuilding Broadway above new SkyTrain stations)

    Historical context

    Daily Hive reports the provincial government's September 2026 statement that all track installation is complete and that opening remains scheduled for late 2027; remaining work includes utilities, station interiors and rebuilding streets.

    Evidence: Daily Hive (reporting a Government of British Columbia announcement): Broadway Subway track installation reached 100% completion this week

    Historical context

    The provincial Budget 2026 fiscal plan put taxpayer-supported capital investment at 37.7 billion dollars over three years, including 13.8 billion for transit and transportation, province-wide; the first-quarterly report of September 2026 forecasts 36.4 billion dollars over the same fiscal plan period.

    Evidence: Government of British Columbia, Ministry of Finance: Budget 2026: Fiscal Plan (web summary); Government of British Columbia, Ministry of Finance: First Quarterly Report 2026/27

    Housing

    Historical context

    CMHC says Vancouver's pace of starts is still 5,000 to 7,000 units below what is needed to restore pre-pandemic affordability by 2036, that rental apartments were around 60 per cent of 2026 starts, and that condominium starts fell 40 per cent further in the first half of 2026.

    Evidence: Canada Mortgage and Housing Corporation: Fall 2026 Housing Supply Report

    Historical context

    Metro Vancouver's February 2025 Regional Housing Needs Report says housing development needs to double to address regional housing pressures, that development has not kept pace with population growth and that housing costs have been rising faster than incomes for decades. Its definition of the region is the regional district, not the metropolitan area.

    Evidence: Metro Vancouver: Regional Housing Needs Report (February 2025)

    Historical context

    The regional district's Housing 2050 roadmap is now intended to be adopted by its Board in 2027, whereas its March 2025 factsheet expected completion by the end of 2025; the sources are both Metro Vancouver's and the later page is used here. The roadmap defines affordable housing as affordable to households earning up to 108,000 dollars a year.

    Evidence: Metro Vancouver: Housing 2050: A Roadmap to Implement Metro 2050’s Housing Goal

    Population, migration and labour

    Historical context

    Statistics Canada reports that the Vancouver area grew 0.2 per cent in the year to July 2025, against 3.7 per cent a year earlier, because of a net loss of 10,098 non-permanent residents, against a net gain of 91,573 a year earlier; it also lost 4,656 people to other provinces, the second consecutive year of net losses, and 16,166 to the rest of British Columbia.

    Evidence: Statistics Canada: The Daily: Canada's population estimates: Subprovincial areas, 2025

    Historical context

    Metro Vancouver's October 2025 projections lowered expected growth to an annual average of 42,500 net new residents, reaching 4.1 million people by 2050, which it attributes to recent federal immigration policy changes.

    Evidence: Metro Vancouver: Regional Planning Bulletin, October 2025

    Historical context

    For the province, year-to-date employment to July 2026 was down 20,700 jobs, with the largest declines in wholesale and retail trade (22,500 fewer), transportation and warehousing (10,500) and finance, insurance, real estate, rental and leasing (8,700), and gains led by construction (11,100 more). The report says the labour force has decreased slightly amid tighter federal immigration policy and that average hourly wages rose 2.6 per cent year to date. These are provincial industry figures; metropolitan employment by industry is available only as an annual Labour Force Survey sample estimate, noisy for small groups.

    Evidence: Government of British Columbia, Ministry of Finance: First Quarterly Report 2026/27

    History

    Historical context

    The province says its economy grew 2.0 per cent in 2025, and revised its 2026 forecast down to 0.9 per cent from 1.3 per cent at budget. Statistics Canada's revised series of 5 November 2026 put 2025 growth at 2.2% in real output at basic prices and 2.2% in real GDP at market prices (2017 constant prices).

    Evidence: Government of British Columbia, Ministry of Finance: First Quarterly Report 2026/27

    Historical context

    Invest Vancouver's data show technology employment growing faster than the broader regional economy between 2009 and 2021, with investment in regional technology firms peaking in 2021; the series ends in 2021.

    Evidence: Invest Vancouver (Metro Vancouver economic development service): The Expanding Tech Sector in the Metro Vancouver region

    Across geographies

    Opinion

    The sources in this section use five different boundaries: the whole port (all cargo, mostly passing through), Metro Vancouver and Vancouver Island (mining), the regional district (planning, technology, housing need), the City of Vancouver (tourism), and the province (film, wood-products trade, labour by industry, forecasts). They cannot be added together or read as the Vancouver metropolitan area's economy.

    Historical context

    The province reports that homebuilding was lower in the first seven months of 2026 than a year earlier across its metropolitan areas, including Vancouver (starts down 9.6 per cent), and that units permitted in Vancouver were down 11.1 per cent.

    Evidence: Government of British Columbia, Ministry of Finance: First Quarterly Report 2026/27

    What it influences

    Historical context

    The Major Projects Office says the North Coast Transmission Line has the potential to create 10 billion dollars in new economic activity; the line serves northern British Columbia, so any metropolitan effect is not stated by the source.

    Evidence: Major Projects Office, Government of Canada: North Coast Transmission Line

    Historical context

    The Prime Minister's office says LNG Canada Phase 2 will double the terminal's capacity and unlock 33 billion dollars of private investment; the terminal is at Kitimat, and the release does not say what share flows to Metro Vancouver.

    Evidence: Prime Minister of Canada: Prime Minister Carney welcomes LNG Canada Phase 2, the second-largest single private investment in Canadian history

    Risks

    Historical context

    The province lists its main downside risks as a worsening global trade conflict, inflationary pressure from the conflict in the Middle East, a global climate of uncertainty that slows investment, and housing market weakness.

    Evidence: Government of British Columbia, Ministry of Finance: First Quarterly Report 2026/27

    Historical context

    CMHC's mid-year rental update says landlords report that increased competition from new supply is the primary driver of lower asking rents, and that in Vancouver and Toronto newly completed condominium apartments rented out also contributed.

    Evidence: Canada Mortgage and Housing Corporation: 2026 Mid-Year Rental Market Update

    Historical context

    Of the largest projects named here, the container terminal is listed as a project of national interest but still pending final permits; construction of the transmission line's first phase was announced on September 3, 2026, and LNG Canada reached its final investment decision on Phase 2 on September 29, 2026, both in northern British Columbia. The sources do not quantify how much of the area's output depends on any of them.

    Evidence: Major Projects Office (Government of Canada): Roberts Bank Terminal 2 (RBT2); Major Projects Office, Government of Canada: North Coast Transmission Line; Prime Minister of Canada: Prime Minister Carney welcomes LNG Canada Phase 2, the second-largest single private investment in Canadian history

    What to watch

    Historical context

    The medium-term picture depends on conditions the sources themselves name. The provincial Budget 2026 fiscal plan expects growth to improve over 2028 to 2030, averaging 2.1 per cent a year, as immigration levels normalise and trade uncertainty subsides (source-stated conditions, for the province). For Vancouver specifically, the sources point to four things to follow: whether Roberts Bank Terminal 2, now listed as a project of national interest, receives its final permits; whether population growth returns, which both Metro Vancouver and the province link to federal immigration policy; whether rental completions absorb the condominium slowdown; and whether the Broadway Subway opens on its late 2027 schedule. Statistics Canada's Labour Force Survey and population estimates, CMHC's starts and rental survey, and the port authority's annual statistics would show each.

    Evidence: Government of British Columbia, Ministry of Finance: Budget 2026: Fiscal Plan (web summary); Major Projects Office (Government of Canada): Roberts Bank Terminal 2 (RBT2)

    Not covered by the sources cited, and so not described here: the Port of Vancouver's own statistics, Vancouver International Airport traffic, the City of Vancouver's economic strategy and the dissolved Vancouver Economic Commission's successor arrangements, Vancouver metropolitan wages by industry, metropolitan labour productivity, the Surrey-Langley SkyTrain, Burrard Inlet dredging, Conference Board and Bank of Canada metropolitan outlooks, and any estimate of how many Vancouver jobs depend on wood products.

    Prepared with AI assistance.

    Follow the relationships

    Sources for this section (7 datasets, 25 documents)

    Data

    Documents cited

    Each dataset is used under its licence; attribution and series-level detail are in each chart’s “About this data” panel. Limitations: Every explanation here is a statement by the named organisation. Several sources are promotional or industry-commissioned (Invest Vancouver, the Mining Association of British Columbia, Destination Vancouver, Trans Mountain) and are labelled as such. Port volumes come from a trade-press report of the port authority's statement, not from the Port of Vancouver itself, and the airport's and the City of Vancouver's own figures are not cited. Port, mining, film and tourism statements use different boundaries (the whole port, Metro Vancouver and Vancouver Island, British Columbia, the City of Vancouver) and are not additive. Census industry shares are for 2021 and describe jobs by place of work. Metropolitan unemployment and employment are three-month averages and are noisier than provincial figures. No Vancouver wage series, productivity series, City economic strategy or metropolitan forecast is cited. Forecasts are the publishers' and are not Northline forecasts.
    1 · Labour market

    Is Vancouver's labour market keeping pace with the other large metropolitan areas?

    In October 2026, Vancouver's participation rate was 68.0%, employment was up 1.2% on a year earlier and unemployment was 6.7%

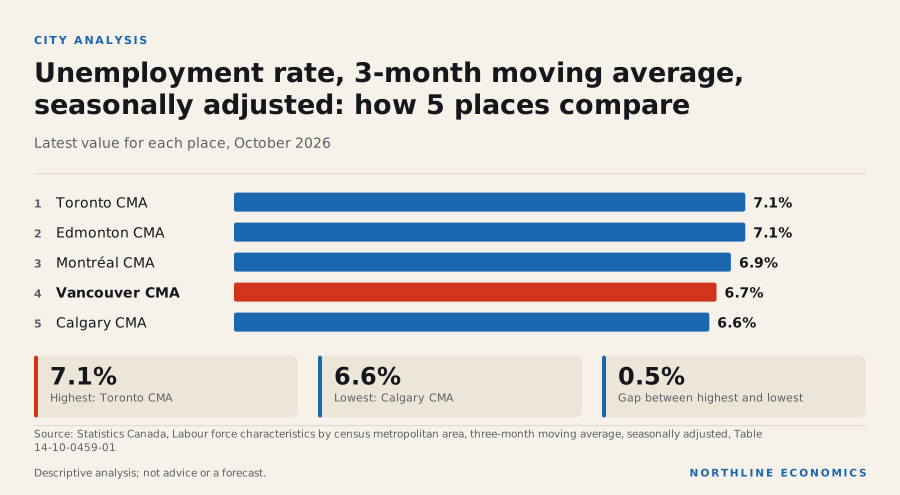
    Graphic: Unemployment rate, 3-month moving average, seasonally adjusted: how…Unemployment rate, 3-month moving average, seasonally adjusted: how 5 places compare. Toronto CMA 7.1%;…

    What happened

    Vancouver's seasonally adjusted unemployment rate (three-month average) was 6.7% in October 2026, from 6.3% a year earlier. Calgary's was 6.6%, Toronto's 7.1%, Montréal's 6.9% and Edmonton's 7.1%. Employment of 1.7 million is 1.2% higher than a year ago, against 6.2% in Calgary, 1.9% in Toronto and -0.9% in Montréal.

    Unemployment rate by metropolitan area

    Percent, three-month moving average, seasonally adjusted. Census metropolitan areas only; do not compare with provincial monthly rates (different smoothing).

    Chart loads when it comes into view.

    Latest values: Vancouver 6.7 (2026-10); Calgary 6.6 (2026-10); Edmonton 7.1 (2026-10); Toronto 7.1 (2026-10); and 2 more in the data table.

    Employment by metropolitan area, indexed

    Three-month moving average, seasonally adjusted; start of period = 100.

    Chart loads when it comes into view.

    Latest values: Vancouver 1,705,000 (2026-10); Calgary 1,053,000 (2026-10); Edmonton 889,000 (2026-10); Toronto 3,792,000 (2026-10); and 2 more in the data table.

    The participation rate is 68.0% (3rd of 6 among the six areas) and the employment rate 63.4% (3rd of 6).

    Participation rate by metropolitan area

    Percent, three-month moving average, seasonally adjusted.

    Chart loads when it comes into view.

    Latest values: Vancouver 68 (2026-10); Calgary 71.4 (2026-10); Edmonton 68.7 (2026-10); Toronto 66.9 (2026-10); and 2 more in the data table.

    By industry, Statistics Canada's annual Labour Force Survey estimates (table 14-10-0468-01, annual averages, not seasonally adjusted) put average employment in Vancouver at 1.7 million in 2025, a change of 1.8% on the year before and of 12.0% since 2019. Goods-producing industries account for 15.4% of employed persons and services-producing industries for 84.6%; among the individual groups, wholesale and retail trade 14.8%, professional, scientific and technical services 13.2% and health care and social assistance 12.9% of employment. The table counts people by the industry of their main job and by where they live, so it is a measure of employment, not of output, wages or the number of businesses. Estimates for a single industry group in one metropolitan area come from a small survey sample and are less steady than the total: Statistics Canada suppresses some cells, and the table is annual, so a one-year move in a small group should not be read as a trend. No sampling-error range is held with these series, so none is quoted; the monthly metropolitan rates above are three-month averages and are noisier than the annual figures. Wages for the metropolitan area are not held here; the Statistics Canada wage tables used cover provinces and Canada.

    Employment in Vancouver: goods and services, indexed

    Annual average of employed persons, Labour Force Survey (Statistics Canada table 14-10-0468-01); first year shown = 100. Goods-producing and services-producing sectors against all industries. Annual estimates, not seasonally adjusted.

    Chart loads when it comes into view.

    Latest values: All industries 1,698,000 (2025); Goods-producing sector 261,300 (2025); Services-producing sector 1,437,000 (2025).

    Employment by industry group in fourteen metropolitan areas, 2025

    Share of employed persons living in each metropolitan area who work in each group (annual average, Labour Force Survey; the survey classifies jobs by the industry of the person’s main job, not by where the employer sits). Single-sector estimates for one metropolitan area rest on small samples; a city is left out of a chart where Statistics Canada suppresses the estimate. Shares are computed by this project from Statistics Canada table 14-10-0468-01.

    Chart loads when it comes into view.

    Top values: Kitchener–Cambridge–Waterloo 25.3%; Edmonton 20.8%; Calgary 20%.

    Why it happened

    The data show where Vancouver stands, not why. Since the end of 2019 employment is up 11.8% in Vancouver, against 27.1% in Calgary and 10.9% in Toronto, so Vancouver's job growth has been far slower than Calgary's and close to Toronto's over the period; this report cannot attribute that to industry mix or population. The annual industry employment shown above describes the mix of jobs, not exposure.

    Historical context

    Statistics Canada reports that employment rose in British Columbia in October, along with Newfoundland and Labrador, and fell in Alberta and Prince Edward Island. That is the provincial picture.

    Evidence: Statistics Canada: Labour Force Survey, October 2026 (The Daily)

    Why it matters

    The participation rate ranks 3rd of 6; how many residents are in or seeking work matters for household income and for the housing demand discussed below.

    History

    Over ten years Vancouver's unemployment rate has averaged 5.9%, with a high of 13.1% in June 2020 and a low of 4.0% in February 2018.

    Across geographies

    Vancouver's rate minus Calgary's is 0.1 percentage points. As context, on a different definition (monthly, province-wide), British Columbia's unemployment rate is 6.3% and Canada's 6.7%; these must not be read against the metropolitan averages.

    What it influences

    Jobs matter for household income and housing demand in the Vancouver region.

    Risks

    Not assessed: exposure of Vancouver's employment to particular industries (for example the port, film and technology). The annual industry employment shown above describes the mix of jobs, not exposure.

    What to watch

    Statistics Canada's Labour Force Survey (calendar).

    Prepared with AI assistance.

    Follow the relationships

    Upcoming releases

    Sources for this section (3 datasets, 1 documents)

    Data

    Documents cited

    Each dataset is used under its licence; attribution and series-level detail are in each chart’s “About this data” panel. Limitations: Metropolitan rates are three-month moving averages from the Labour Force Survey and are noisier than national figures. They are not comparable with provincial or national monthly rates and are never charted with them. Wages and demographic breakdowns for the Vancouver metropolitan area are not included; annual employment by industry group (Labour Force Survey, annual averages, with suppressed cells and small-sample variability) is held, but it is not seasonally adjusted and is not output or wages.

    2 · Prices and inflation

    Is inflation in Vancouver higher or lower than in the other large cities?

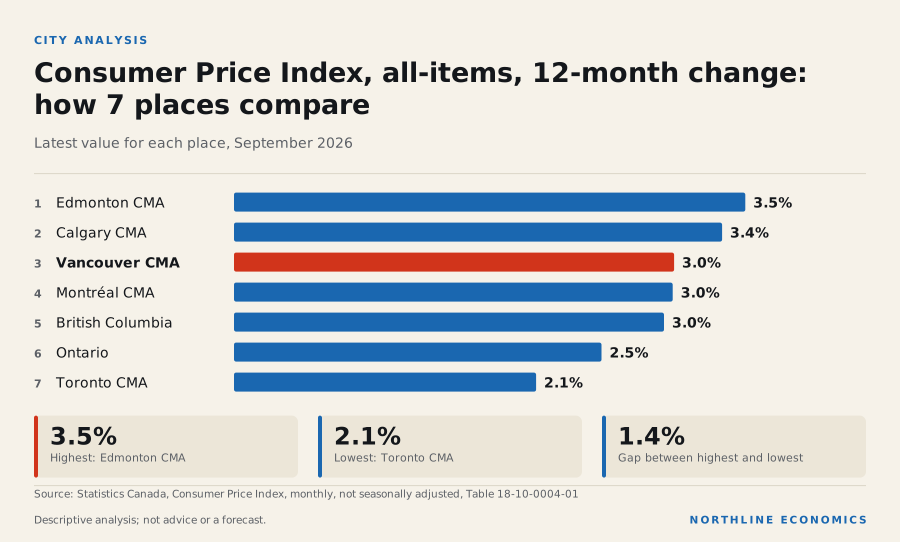
    Vancouver's inflation rate was 3.0% in September 2026, below the Canadian rate of 3.1%

    Graphic: Consumer Price Index, all-items, 12-month change: how 7 places compareConsumer Price Index, all-items, 12-month change: how 7 places compare. Edmonton CMA 3.5%; Calgary CMA…

    What happened

    Vancouver's consumer prices were 3.0% higher in September 2026 than a year earlier, against 2.1% in Toronto, 3.4% in Calgary, 3.5% in Edmonton and 3.0% in Montréal, and 3.1% for Canada.

    Consumer price inflation by city

    12-month change in the all-items CPI (derived). Ottawa–Gatineau is the Ontario part only.

    Chart loads when it comes into view.

    Latest values: Vancouver 3.03 (2026-09); Calgary 3.36 (2026-09); Edmonton 3.52 (2026-09); Toronto 2.08 (2026-09); and 2 more in the data table.

    In February, before the rise in world energy prices described in the Global report, Vancouver's rate was 1.9% against 1.8% for Canada; it has moved by 1.2 percentage points since, against 1.3 percentage points nationally (both computed before the rates are rounded). Calgary's rate went from 1.7% to 3.4% and Toronto's from 1.0% to 2.1% over the same months.

    Why it happened

    Historical context

    Statistics Canada reports that national inflation accelerated in September on gasoline and fuel oil. Only the city's all-items index is held here, so this report cannot say what drives Vancouver's rate.

    Evidence: Statistics Canada: The Daily: Consumer Price Index, September 2026

    Why it matters

    The CPI measures the change in prices, not their level. Vancouver's rate of change says nothing about how expensive the city is.

    History

    Vancouver's rate has averaged 2.9% over ten years and peaked at 8.2% in May 2022.

    Across geographies

    Vancouver's rate minus Canada's is -0.1 percentage points; Toronto's is the lowest of the six. As provincial context only, British Columbia's CPI changed 3.0% over the year and Ontario's 2.5%; the provincial and metropolitan indexes cover different areas and are not interchangeable. Nationally, the CPI gasoline index is 27.8% higher than a year earlier.

    Historical context

    Statistics Canada reported that higher gasoline prices led the national acceleration in September.

    Evidence: Statistics Canada: The Daily: Consumer Price Index, September 2026

    What it influences

    Not measured for Vancouver; see the Canada report for the national links.

    Risks

    The risks that published sources attribute to Vancouver specifically are in the local-economy section of this page; beyond those, see the national risks (energy prices, tariffs).

    What to watch

    Statistics Canada's monthly Consumer Price Index release (calendar).

    Prepared with AI assistance.

    Follow the relationships

    Upcoming releases

    Sources for this section (1 datasets, 1 documents)

    Data

    Documents cited

    Each dataset is used under its licence; attribution and series-level detail are in each chart’s “About this data” panel. Limitations: The city CPI is held here for all items only. The table used publishes shelter and its parts for cities, but not food or gasoline, and the shelter series are not held here, so the drivers of differences with other cities are not measured.

    3 · Population and growth

    Is Vancouver still growing, and how does that compare with the other large cities?

    Vancouver's population changed 0.2% in the year to July 2025 (5th of 6 among the six metros), against 2.9% in Calgary

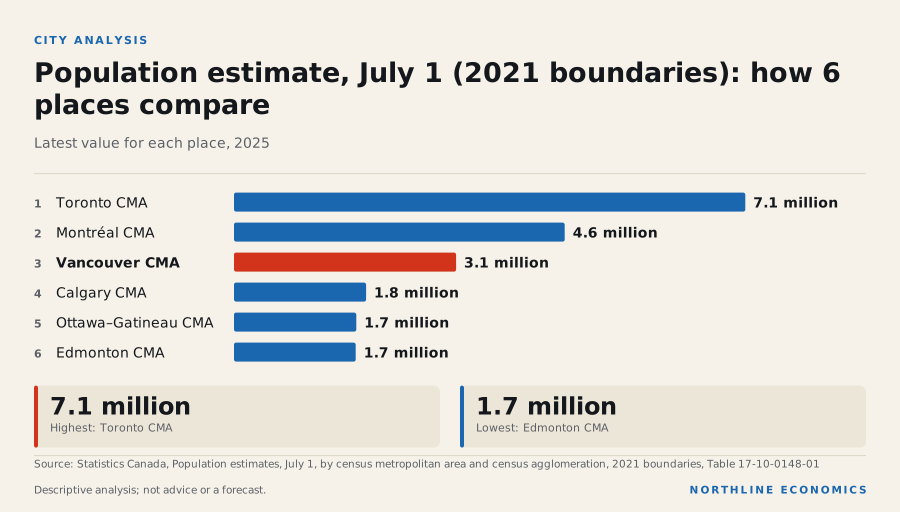
    Graphic: Population estimate, July 1 (2021 boundaries): how 6 places comparePopulation estimate, July 1 (2021 boundaries): how 6 places compare. Toronto CMA 7.1 million; Montréal CMA…

    What happened

    The Vancouver metropolitan area had 3.1 million residents on July 1, 2025, a change of 0.2% from a year earlier. Over five years it grew 12.3%, against 20.1% in Calgary and 9.5% in Toronto. In the latest year Toronto's change was 0.0%, Montréal's 0.5%, Ottawa–Gatineau's 2.3% and Edmonton's 3.1%.

    Population by metropolitan area, indexed

    July 1 estimates, 2021 boundaries; start of period = 100.

    Chart loads when it comes into view.

    Latest values: Vancouver 3,088,000 (2025); Calgary 1,836,000 (2025); Edmonton 1,692,000 (2025); Toronto 7,109,000 (2025); and 2 more in the data table.

    Why it happened

    Historical context

    Statistics Canada reports that from July 1, 2025, to July 1, 2026, national population growth continued to slow to its lowest since 1944/1945, that non-permanent residents fell by the largest annual amount on record with study-permit holders most of the decline, and that Ontario, Quebec and British Columbia, which receive the largest shares of international migrants, grew slowest among the provinces. The metropolitan population estimates end in July 2025, before that decline, so they cannot show it. The components of the metropolitan change are shown below.

    Evidence: Statistics Canada: The Daily: Canada's population estimates, second quarter 2026

    Historical context

    Statistics Canada's January 2026 release on subprovincial estimates reports that the population growth rate from July 2024 to July 2025 was lower for all 41 census metropolitan areas than in the previous year. It reports that the Montréal and Vancouver areas saw significantly slower growth, mainly because of much lower increases in the number of non-permanent residents, and that for Vancouver this was the second consecutive year of net losses from interprovincial migration.

    Evidence: Statistics Canada: The Daily: Canada's population estimates: Subprovincial areas, 2025

    In the demographic year that began in July 2024, the Vancouver metropolitan area recorded 24 thousand births and 18 thousand deaths, 42 thousand immigrants, a net change of -10 thousand non-permanent residents, net interprovincial migration of -4,656 and net intraprovincial migration (movement to and from the rest of the province) of -16 thousand. The year before, immigrants numbered 49 thousand and the net change in non-permanent residents was 92 thousand. Net non-permanent residents averaged 37 thousand a year over the latest five demographic years.

    Where Vancouver's population change came from

    Persons over the twelve months from July 1 of the year shown (so 2024 is July 2024 to June 2025), 2021 boundaries. Net movements: negative = net outflow. Statistics Canada table 17-10-0149-01.

    Chart loads when it comes into view.

    Latest values: Immigrants 42,030 (2024); Net non-permanent residents -10,100 (2024); Net interprovincial migration -4,656 (2024); Net intraprovincial migration -16,170 (2024).

    Why it matters

    Population growth adds workers and households, which can add to demand for housing and services.

    History

    Over ten years Vancouver's population grew 21.7%.

    Across geographies

    British Columbia's population grew 0.1% in the four quarters to 1 July 2026, against 1.5% in Alberta and 0.3% in Ontario; BC's net change in non-permanent residents over four quarters was -32 thousand. These are provincial figures.

    What it influences

    Hypothesis, not established

    The fall in non-permanent residents could reduce demand for rental housing in cities that host many international students. The metropolitan change in non-permanent residents to June 2025 is shown among the components above; it does not cover the 2026 fall.

    Evidence: Statistics Canada: The Daily: Canada's population estimates, second quarter 2026

    Risks

    Not assessed for Vancouver specifically.

    What to watch

    Statistics Canada's quarterly provincial and annual metropolitan population estimates and the federal levels plan.

    Prepared with AI assistance.

    Follow the relationships

    Sources for this section (4 datasets, 2 documents)

    Data

    Documents cited

    Each dataset is used under its licence; attribution and series-level detail are in each chart’s “About this data” panel. Limitations: City population is an annual July 1 estimate on 2021 boundaries and ends a year before the latest provincial figures. Components of change come from a separate table (17-10-0149-01) whose demographic year runs from July 1 to June 30; each is labelled by the year in which that year starts, so the latest covers July 2024 to June 2025. They describe how much each component contributed and do not explain why. Births and deaths are not netted here; net emigration, returning emigrants and the table's residual are not shown, so the components shown need not add to the total change.

    4 · Housing and construction

    Is Vancouver building enough homes, and what is happening to prices?

    Vancouver's new-home prices changed -2.1% in the twelve months to September 2026, units under construction were 61,680 and building permits totalled C$17.1 billion over the twelve months to August 2026

    Graphic: Housing and constructionHousing and construction. Housing starts, total units (CMHC data): Vancouver CMA 2,491 (September 2026);…

    What happened

    Vancouver started 26,601 homes over the past twelve months and completed 27,830; 61,680 were under construction at the end of September 2026, -2.3% on a year earlier. Toronto started 23,355 and Montréal 27,474 over the same twelve months.

    Housing starts by metropolitan area (12-month total)

    Total units started over the previous 12 months; CMHC data distributed by Statistics Canada.

    Chart loads when it comes into view.

    Latest values: Vancouver 26,600 (2026-09); Calgary 24,400 (2026-09); Edmonton 19,060 (2026-09); Toronto 23,360 (2026-09); and 2 more in the data table.

    Housing under construction by metropolitan area

    Units under construction at month end, total units; CMHC data distributed by Statistics Canada.

    Chart loads when it comes into view.

    Latest values: Vancouver 61,680 (2026-09); Calgary 26,250 (2026-09); Edmonton 18,490 (2026-09); Toronto 88,110 (2026-09); and 2 more in the data table.

    The New Housing Price Index for Vancouver is 123.4, -2.1% on a year ago and -3.6% since February 2022, against -8.5% in Toronto and 9.0% in Montréal.

    New housing price index by city, indexed

    Total (house and land); start of period = 100. Ottawa–Gatineau is the Ontario part only.

    Chart loads when it comes into view.

    Latest values: Vancouver 123.4 (2026-09); Calgary 129.7 (2026-09); Edmonton 105.7 (2026-09); Toronto 105 (2026-09); and 2 more in the data table.

    Historical context

    CMHC's Fall 2026 Housing Supply Report puts the additional units Vancouver needs each year at 5,000 to 7,000, against 20,000 to 26,000 for Toronto and 42,000 to 56,000 for Montréal in its summary table. It reports that rental construction is carrying supply while ownership construction has weakened sharply.

    Evidence: Canada Mortgage and Housing Corporation: Fall 2026 Housing Supply Report

    In the October 2025 Rental Market Survey the average rent for a two-bedroom unit in purpose-built rental structures of three or more units in Vancouver was C$2,364 a month, 2.2% higher than a year earlier (CMHC's same-sample figure, for structures surveyed in both years, is 2.2%) and 31.4% higher than five years earlier, ranking 1st of 14 among fourteen cities (highest = 1); the same measure was C$1,908 in Calgary, C$2,045 in Toronto. The vacancy rate was 3.7%, from 1.6% a year earlier, ranking 5th of 14 among the fourteen (against 4.9% in Calgary, 3.0% in Toronto). The table covers purpose-built rental structures only; condominium, house and basement-suite rentals, and the asking rents on new listings, are not in it.

    Average rent, two-bedroom units: fourteen cities

    Current dollars per month, October survey each year; row and apartment structures of three units and over only (condominium, house and basement-suite rentals are not in this table). CMHC data distributed by Statistics Canada.

    Chart loads when it comes into view.

    Latest values: Vancouver 2,364 (2025); Calgary 1,908 (2025); Edmonton 1,598 (2025); Toronto 2,045 (2025); and 10 more in the data table.

    Rental vacancy rate: fourteen cities

    Percent of units vacant, October survey each year; row and apartment structures of three units and over. CMHC data distributed by Statistics Canada.

    Chart loads when it comes into view.

    Latest values: Vancouver 3.7 (2025); Calgary 4.9 (2025); Edmonton 3.8 (2025); Toronto 3 (2025); and 10 more in the data table.

    Why it happened

    The data show falling new-home prices and a pipeline of units under construction that is below its peak.

    Interpretation

    CMHC links supply to affordability and describes a gap for Vancouver; the data here cannot separate the influences on Vancouver's prices (demand, interest rates, land and construction costs, incomes).

    Evidence: Canada Mortgage and Housing Corporation: Housing starts and construction data, September 2026; Canada Mortgage and Housing Corporation: Fall 2026 Housing Supply Report

    Historical context

    CMHC's 2025 Rental Market Report says Vancouver's vacancy rate rose to its highest level in over 30 years, that British Columbia's population growth fell sharply because of a substantial decline in net international migration, and that in Toronto and Vancouver there was more competition from rented condominium apartments. These are CMHC's stated reasons; the data held here do not test them.

    Evidence: Canada Mortgage and Housing Corporation: Rental Market Report 2025: major centres (web edition)

    Why it matters

    Housing is a large household expense. A supply gap estimate is CMHC's model-based figure, not a forecast of what will be built.

    History

    The peak of units under construction in the past ten years was 65,624 in November 2024. Permits totalled C$17.1 billion over the twelve months to August 2026, +18.1% on the twelve months before.

    Housing completions by metropolitan area (12-month total)

    Units completed over the previous 12 months, total units; CMHC data distributed by Statistics Canada.

    Chart loads when it comes into view.

    Latest values: Vancouver 27,830 (2026-09); Calgary 23,830 (2026-09); Edmonton 18,250 (2026-09); Toronto 26,690 (2026-09); and 2 more in the data table.

    Across geographies

    Over the twelve months to August 2026 permits totalled C$17.1 billion in Vancouver, C$29.3 billion in Toronto, C$9.2 billion in Calgary and C$13.8 billion in Montréal.

    What it influences

    The links between housing supply and affordability are national and not estimated for Vancouver.

    Risks

    Historical context

    CMHC's deputy chief economist said a key risk for Canada is not building enough during this period of softening housing markets.

    Evidence: Canada Mortgage and Housing Corporation: Housing starts and construction data, September 2026

    What to watch

    CMHC monthly starts, the New Housing Price Index and building permits (calendar), and the Bank of Canada's next announcement on 9 December 2026.

    Prepared with AI assistance.

    Follow the relationships

    Upcoming releases

    Sources for this section (5 datasets, 3 documents)

    Data

    Documents cited

    Each dataset is used under its licence; attribution and series-level detail are in each chart’s “About this data” panel. Limitations: Starts, completions and units under construction are CMHC counts for the metropolitan area (all unit types). The New Housing Price Index covers new homes only; resale prices are not included, and rents are the October Rental Market Survey for purpose-built rental structures only. Building permit values are in current dollars, seasonally adjusted.

    5 · Industry, investment and exposure

    What does Vancouver make, and how is it exposed?

    Vancouver's manufacturing shipments of C$3.6 billion in August 2026 were 21.2% above a year earlier; energy products were 30% of British Columbia's exports in 2025

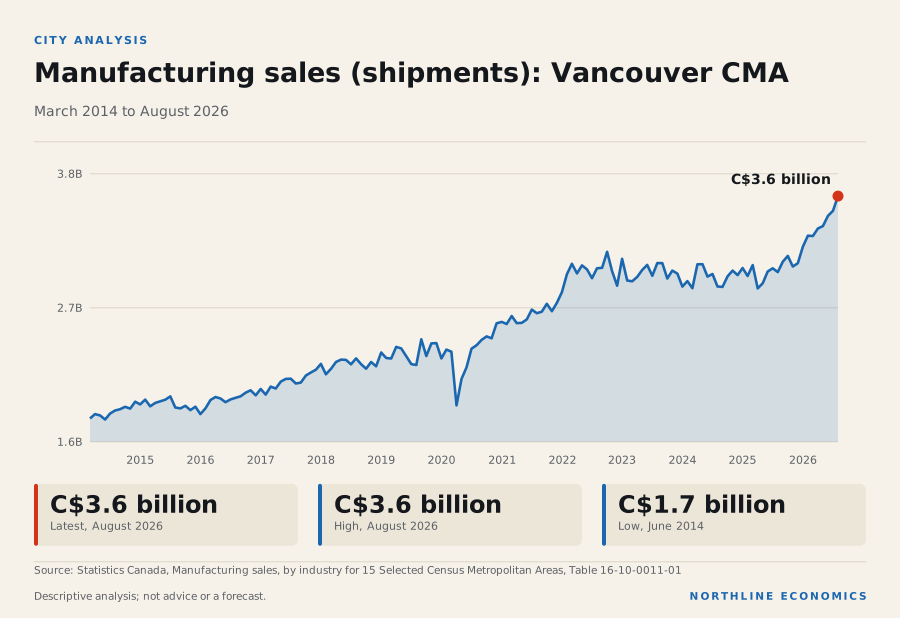
    Graphic: Manufacturing sales (shipments): Vancouver CMAManufacturing sales (shipments): Vancouver CMA. Latest, August 2026 C$3.6 billion; High, August 2026 C$3.6…

    What happened

    Vancouver manufacturing shipments were C$3.6 billion in August 2026, 21.2% above a year earlier and 51.0% above December 2019, against 11.6% over the year in Toronto and 16.1% in Montréal. Shipments of petroleum and coal products for Vancouver are suppressed by Statistics Canada and are not shown.

    Manufacturing shipments by metropolitan area, indexed

    Seasonally adjusted, current dollars (so prices are included); start of the period = 100. Cities whose latest value is suppressed are not shown.

    Chart loads when it comes into view.

    Latest values: Vancouver 3,594,000,000 (2026-08); Calgary 1,720,000,000 (2026-08); Edmonton 5,326,000,000 (2026-08); Toronto 12,680,000,000 (2026-08); and 2 more in the data table.

    Value of building permits by metropolitan area (12-month total)

    Seasonally adjusted, current dollars, all types of building and work. Ottawa–Gatineau is published only for its Ontario and Quebec parts and is not shown.

    Chart loads when it comes into view.

    Latest values: Vancouver 17.06 (2026-08); Calgary 9.156 (2026-08); Edmonton 6.99 (2026-08); Toronto 29.27 (2026-08); and 1 more in the data table.

    Building permits (all types) totalled C$17.1 billion over the twelve months to August 2026, +18.1% on the twelve months before.

    Why it happened

    The metropolitan series are not broken down by industry, so this report cannot say which products drive Vancouver's shipments or whether the rise is price or volume.

    Interpretation

    Statistics Canada reports that the Industrial Product Price Index rose 14.5% over the year to September, so current-dollar shipments are likely to include a price effect nationally; the Vancouver split is not measured.

    Evidence: Statistics Canada: The Daily: Industrial product and raw materials price indexes, September 2026

    Why it matters

    Vancouver's role in the economy includes functions this report does not measure directly: port activity, film and technology. Annual employment for broad groups such as transportation and warehousing and professional services is in the labour section. The absence of the others from the data is a gap, not a finding.

    History

    Vancouver's shipments peaked at C$3.6 billion in August 2026, the highest in the past ten years.

    Across geographies

    As provincial context only: in 2025 British Columbia sent 51% of its domestic merchandise exports to the United States, the second-lowest share among the provinces after Newfoundland and Labrador (35%), against 72% for Ontario and 85% for Alberta; energy products were 30% of BC's exports. The destinations of the rest of BC's exports are not shown here. BC's workers are employed 5.3% in transportation and warehousing, 10.7% in professional, scientific and technical services and 8.9% in construction (shares of employment, 2025). These are provincial shares and must not be read as describing Vancouver.

    How much of each province’s employment is in one industry

    Share of provincial employment, 2025 annual average (Labour Force Survey). A measured exposure to an industry, not an estimate of how much output or income depends on it. “Resources” combines forestry, fishing, mining, quarrying and oil and gas.

    Chart loads when it comes into view.

    Top values: Newfoundland and Labrador 6.37%; Alberta 5.58%; Saskatchewan 3.76%.

    What it influences

    Vancouver's construction and manufacturing feed local employment and incomes; no measured effect on Vancouver is recorded.

    Risks

    Historical context

    Statistics Canada notes that new US tariffs on a range of Canadian products took effect at the end of August. The exposure of Vancouver's businesses is not measured.

    Evidence: Statistics Canada: The Daily: Canadian international merchandise trade, August 2026

    What to watch

    Statistics Canada's monthly manufacturing and merchandise trade releases (calendar).

    Prepared with AI assistance.

    Follow the relationships

    Upcoming releases

    Sources for this section (2 datasets, 2 documents)

    Data

    Documents cited

    Each dataset is used under its licence; attribution and series-level detail are in each chart’s “About this data” panel. Limitations: Manufacturing sales are current-dollar shipments and move with prices. Annual employment by industry is a Labour Force Survey sample estimate (noisy for small groups) and is in the labour section; wages, output by industry, and port and logistics activity for the Vancouver metropolitan area are not held. British Columbia figures are provincial and are context only, never a description of Vancouver. Shipments for some industries and cities are suppressed by Statistics Canada.

    5.5 · Industry structure (2021 Census)

    What do the people who work in Vancouver do for a living?

    Professional, scientific and technical services was the largest source of Vancouver jobs in 2021 at 12.6%, and Arts, entertainment and recreation was the sector in which Vancouver's share of jobs stood furthest above the other five areas combined

    What happened

    In the 2021 Census, 1.2 million jobs were located in the Vancouver metropolitan area (people who worked at home or had a usual workplace there; people with no fixed workplace address are not in the table). The three largest sectors were Professional, scientific and technical services (12.6% of jobs), Health care and social assistance (12.5%) and Retail trade (12.2%).

    Measured as its share of jobs divided by the other five metropolitan areas' combined share (among sectors that make up at least one fiftieth of Vancouver's jobs), the sector in which Vancouver stood furthest above the rest was Arts, entertainment and recreation: 2.1% of its jobs, against 1.6% in Calgary, 1.4% in Edmonton, 1.4% in Toronto, 1.5% in Montréal and 1.4% in Ottawa–Gatineau.

    Jobs by industry sector in six metropolitan areas, 2021 Census

    Share of jobs located in each metropolitan area (persons who worked at home or had a usual place of work there; people with no fixed workplace address are not in the table), May 2021 reference week, pandemic conditions. Industry structure at one date, not current conditions. Shares are computed by this project from the Census counts.

    Chart loads when it comes into view.

    Top values: Edmonton 6%; Calgary 4.9%; Vancouver 4.2%.

    Why it happened

    Not assessed. The table counts jobs by sector at one date and says nothing about why a metropolitan area has the mix it has. Attributed descriptions of Vancouver's industry structure are in the local-economy section of this page.

    Why it matters

    The industry mix shows what a local economy does for a living, which bears on how it is exposed to changes in demand, prices and policy. It does not measure output, wages or how the economy is performing; those need other tables.

    History

    Not available from this table: the Census is taken every five years and the platform holds only the 2021 reference week (May 2021). Annual industry employment for the metropolitan area comes from the Labour Force Survey and is in the labour section of this page.

    Across geographies

    The six metropolitan areas come from one table with one definition, so the shares can be compared with one another. They are shares of jobs located in the area, not of residents' employment, and not comparable with provincial Labour Force Survey industry shares, which use a different survey, year and definition. British Columbia is not described here.

    What it influences

    Not assessed. No relationship in the recorded graph links the metropolitan industry mix to another variable.

    Risks

    Historical context

    The reference week was in May 2021, during public-health restrictions: Statistics Canada named retail trade, accommodation and food services, and information, culture and recreation among the industries most affected, and said working from home remained an important adaptation. The data are more than five years old and cannot show what has changed since.

    Evidence: Statistics Canada: The Daily: Labour Force Survey, May 2021

    What to watch

    The release of 2026 Census results on industry for metropolitan areas. No release date for them is in the calendar this site holds, and none is assumed.

    Prepared with AI assistance.

    Follow the relationships

    Sources for this section (1 datasets, 1 documents)

    Data

    Documents cited

    Each dataset is used under its licence; attribution and series-level detail are in each chart’s “About this data” panel. Limitations: Census 2021, one reference week (May 2021) under pandemic conditions; counts are rounded by Statistics Canada. Jobs located in the metropolitan area (at home or usual workplace); people with no fixed workplace address are excluded. Not current conditions and not output, wages or productivity.

    6 · Connections to national and global trends

    How do global and national developments reach Vancouver, and what does the evidence show?

    British Columbia sold 51% of its goods exports to the United States in 2025; Vancouver-specific evidence for global links is thin

    Graphic: Conventional 5-year mortgage rate (posted)Conventional 5-year mortgage rate (posted). Latest, 28 October 2026 6.2%; High, 20 December 2023 7.0%;…

    What happened

    Most recorded connections that reach Vancouver are provincial or national. British Columbia's exposure to the United States was 51% of its goods exports in 2025; the national export shares that year were 72% to the United States and 4.5% to China.

    Oil prices and Vancouver's employment are not compared in the relationship graph; only Calgary, Edmonton and Toronto are, with correlations of 0.37, 0.41 and 0.37.

    Why it happened

    The role of the port, as the port authority and federal agencies describe it, is in the local-economy section of this page. The structure of Vancouver's links to Asia and the Pacific is not assessed, and no city-level trade data are held.

    Why it matters

    The currency, interest rates and trade partners that matter for Vancouver are covered at national level in the Global report: one US dollar cost an average of C$1.4135 in October 2026; Canada's posted five-year mortgage rate was 6.19% in the week of 28 October 2026.

    History

    Not assessed.

    Across geographies

    Interpretation

    Bond yields and the posted five-year mortgage rate tend to move together, which matters for a market where new-home prices are falling; the Vancouver-specific effect is not measured.

    Evidence: relationship: Government of Canada bond yields and Prime and posted mortgage rates

    What it influences

    Three chains bear on Vancouver: US trade measures to exports (hypotheses), rates to mortgage costs and housing (documented nationally) and immigration policy to population (documented nationally and, with no measured size, for the metropolitan area).

    Risks

    The risks that published sources attribute to this city specifically are in the local-economy section of this page; beyond those, see the national risks in the Canada report and the global risks in the Global report.

    What to watch

    The Bank of Canada's next announcement on 9 December 2026, tariff changes and Statistics Canada's monthly trade release (calendar).

    Prepared with AI assistance.

    Follow the relationships

    Upcoming releases

    Sources for this section (2 datasets, 0 documents)

    Data

    Each dataset is used under its licence; attribution and series-level detail are in each chart’s “About this data” panel. Limitations: Vancouver-specific evidence is thin. Most recorded relationships are national or provincial; highlighting a province or a path in the explorer is not a measured effect on Vancouver. No port, shipping or Asia-trade series is held for the city, so those connections, often cited for Vancouver, are not measured here.

    What is missing

    What this page does not cover

    Stated plainly rather than hidden.

    Data requirements

    Output and wages by industry for the metropolitan area
    Annual employment by industry group (Labour Force Survey, table 14-10-0468-01), the 2021 Census industry mix and total metropolitan GDP (annual, no industry detail) are now ingested. Output by industry for the metropolitan area is not, and no wage series for the metropolitan area is held: the open Statistics Canada wage tables cover provinces and Canada, not metropolitan areas.
    not covered
    Resale prices, rents outside purpose-built rental, and household incomes
    Resale data are licensed. Average rent and vacancy for purpose-built rental structures (CMHC Rental Market Survey) are ingested; condominium, house and basement-suite rents and household income tables for the metropolitan area are not.
    not covered
    Commercial real estate, office and industrial markets
    Proprietary sources; licensing required.
    not covered
    Infrastructure, major projects and public investment
    A project is listed only once its source, status and value have been checked.
    not covered
    Municipal finance and policynot covered
    Method and sources

    How this report is built

    Same pipeline, gates and editorial rules as every other page.

    Every number is a reference to a published, licence-checked series for the same geography (ca.bc.cma_vancouver); metropolitan series are never mixed with provincial or national ones. Statistics Canada tables 14-10-0459-01 (labour), 18-10-0004-01 (CPI), 17-10-0148-01 (population), 34-10-0154-01 (starts, completions, under construction; CMHC data), 18-10-0205-01 (new housing price index), 34-10-0292-01 (building permits) and 16-10-0011-01 (manufacturing shipments, six large cities only), 17-10-0149-01 (components of population change), 34-10-0133-01 and 34-10-0130-01 (rents and vacancy, CMHC Rental Market Survey), 36-10-0468-01 (GDP at basic prices) 98-10-0492-01 (2021 Census jobs by industry) and 14-10-0468-01 (annual employment by industry group). Methodology and sources · Editorial policy.