GlobalCanadaCities

Atlas · YHM · Ontario

Hamilton

871,143 people, July 2025. Metropolitan area measures, beside the 13 other cities Northline covers.

Map of Canada with provincial boundaries. The 14 cities Northline covers are listed in the text.

Unemployment rateHamilton among 14 cities

Measure
2021202220232024202520264.0%6.0%8.0%10.0%12.0%7.6%Hamilton7.1%Edmonton6.7%Vancouver6.6%Calgary

Pin up to four cities

    Three-month moving average, seasonally adjusted. Statistics Canada, Labour Force Survey.

    Table view
    Latest value for each city.
    CityLatestPeriod
    London8.1%Oct 2026
    Hamilton7.6%Oct 2026
    Toronto7.1%Oct 2026
    Ottawa–Gatineau7.1%Oct 2026
    Edmonton7.1%Oct 2026
    Kitchener–Waterloo7.1%Oct 2026
    Montréal6.9%Oct 2026
    Vancouver6.7%Oct 2026
    Calgary6.6%Oct 2026
    Saskatoon5.9%Oct 2026
    Regina5.9%Oct 2026
    Halifax5.4%Oct 2026
    Winnipeg5.0%Oct 2026
    Québec4.5%Oct 2026

    Vital signs

    Hamilton in seven numbers

    Vital signs for Hamilton
    MeasureLatestPeriod and rank among 14 citiesContextTrend
    Unemployment rate7.6%Oct 2026, second highest of 14Ontario 7.3%, Canada 6.7% (monthly measures)
    Employment rate60.7%Oct 2026, thirteenth highest of 14
    Population871,143July 2025
    Population growth1.0%Year to July 2025, ninth highest of 14
    Housing starts, last 12 months2,334To Sep 2026, thirteenth highest of 14
    Average two-bedroom rentC$1,659October 2025, seventh highest of 14
    Rental vacancy rate3.5%October 2025, sixth highest of 14

    City figures are metropolitan-area measures. National and provincial unemployment rates are monthly, so they are close to but not the same measure as the three-month city averages.

    What it is built on

    Jobs by industry

    1. Health care and social assistance15.8% vs 13.5%
    2. Retail trade12.0% vs 11.6%
    3. Manufacturing11.4% vs 8.4%
    4. Educational services9.6% vs 8.3%
    5. Professional and technical services9.2% vs 11.4%
    6. Finance and insurance5.5% vs 6.3%
    7. Accommodation and food4.9% vs 4.9%
    8. Wholesale trade4.6% vs 4.0%
    9. Agriculture and forestry1.0% vs 0.6%

    Share of jobs by place of work, 2021 Census. The tick marks the 14 cities combined. Total jobs counted: 309,015.

    See Hamilton’s skyline in the Field

    Rates and housing here

    Where the ripple reaches Hamilton

    A reading path through recorded links, not a forecast. Effects along a chain are never added or multiplied.

    Follow the ripple

    Where to go next

    ServicesGet a full profileA sourced profile of Hamilton for a lender, board or council. AtlasCompare placesSet Hamilton beside other cities and provinces. StudioOpen in StudioA workspace prepared from these measures, with the gaps stated.
    YHM · Hamilton CMA · city dashboard

    The Hamilton economy: steel under tariff pressure, a decarbonization project that has changed shape, and a housing market adjusting

    Hamilton's unemployment rate in October 2026 was above Kitchener's and Toronto's and below London's, Stelco is idling its Hamilton finishing lines and the port reports a sharp fall in steel cargo. It does not cover wages by city or resale prices; the page lists what is missing.

    Analyze Hamilton in Intelligence Studio

    Opens a workspace prepared from the published Hamilton measures above, with the gaps stated.

    Hamilton versus Calgary in Studio → · Choose other places to compare →

    30 secondsRead the vital signs above; each measure links to its chart or section. Go to the indicators
    5 minutesRead the findings at the top, then the sourced story of what drives this economy. Go to the outlook
    20 minutesRead the local-economy section, then work through the charts and the relationships that reach the city. Go to the charts
    Hamilton at a glance

    What are the main things to know about Hamilton's economy right now?

    Hamilton had 445 thousand workers in October 2026, with unemployment at 7.6%; its housing, prices and population are covered in the sections below

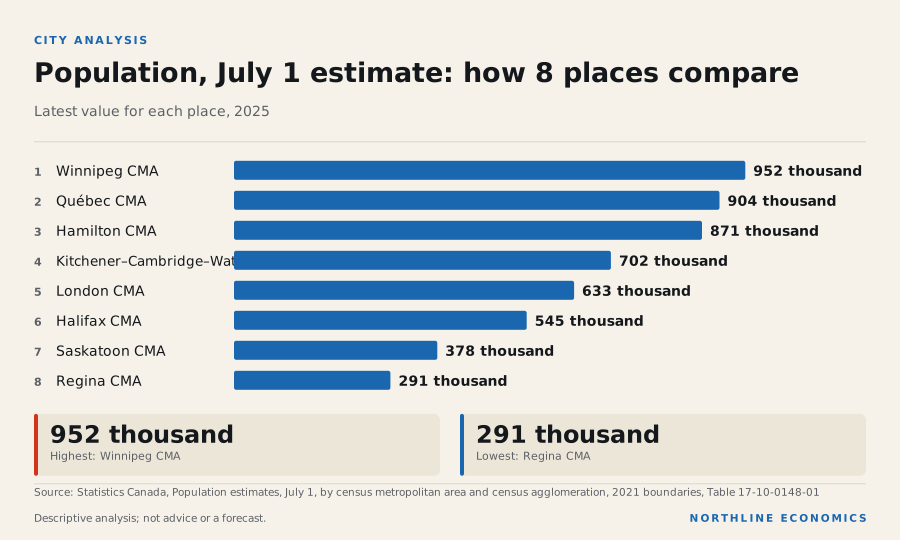
    Graphic: Population, July 1 estimate: how 8 places comparePopulation, July 1 estimate: how 8 places compare. Winnipeg CMA 952 thousand; Québec CMA 904 thousand;…

    Hamilton: weaker on prices, jobs and arrivals

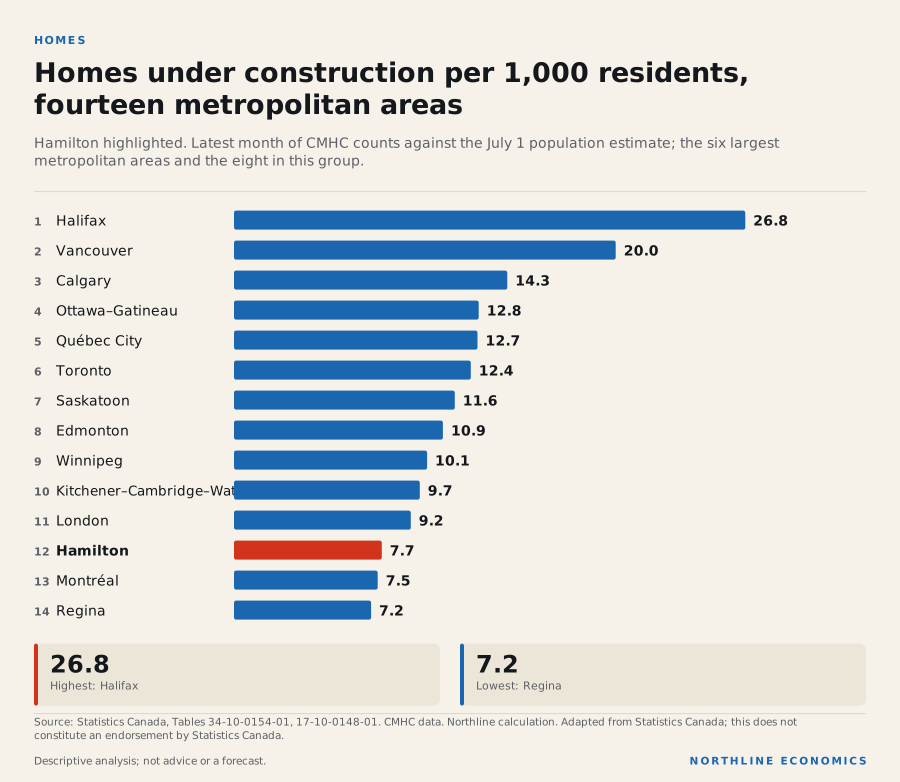
    Hamilton looks weaker than most of its peers on housing and migration. New-home prices changed -4.0% in the twelve months to September 2026, the largest fall of the eight metropolitan areas in this group, ahead of Kitchener–Cambridge–Waterloo's -2.0% and London's -1.9%. Builders began only 72 homes in September 2026, and 6,733 are under construction, 7.7 per 1,000 residents, the third lowest of the fourteen metropolitan areas in the library.

    Homes under construction per 1,000 residents, fourteen metropolitan areasHomes under construction per 1,000 residents, fourteen metropolitan areas. Halifax 26.8; Vancouver 20.0; Calgary 14.3; Ottawa–Gatineau 12.8; Québec City 12.7; Toronto 12.4; Saskatoon 11.6; Edmonton 10.9.HOMESHomes under construction per 1,000 residents,fourteen metropolitan areasHamilton highlighted. Latest month of CMHC counts against the July 1 population estimate; the six largestmetropolitan areas and the eight in this group.1Halifax26.82Vancouver20.03Calgary14.34Ottawa–Gatineau12.85Québec City12.76Toronto12.47Saskatoon11.68Edmonton10.99Winnipeg10.110Kitchener–Cambridge–Waterloo9.711London9.212Hamilton7.713Montréal7.514Regina7.226.8Highest: Halifax7.2Lowest: ReginaSource: Statistics Canada, Tables 34-10-0154-01, 17-10-0148-01. CMHC data. Northline calculation. Adapted from Statistics Canada; this does notconstitute an endorsement by Statistics Canada.NORTHLINE ECONOMICSDescriptive analysis; not advice or a forecast.
    The data behind this graphic
    Homes under construction per 1,000 residents, fourteen metropolitan areas
    ItemValue
    Halifax26.8
    Vancouver20.0
    Calgary14.3
    Ottawa–Gatineau12.8
    Québec City12.7
    Toronto12.4
    Saskatoon11.6
    Edmonton10.9
    Winnipeg10.1
    Kitchener–Cambridge–Waterloo9.7
    London9.2
    Hamilton7.7
    Montréal7.5
    Regina7.2

    Download this graphic (SVG, with source)

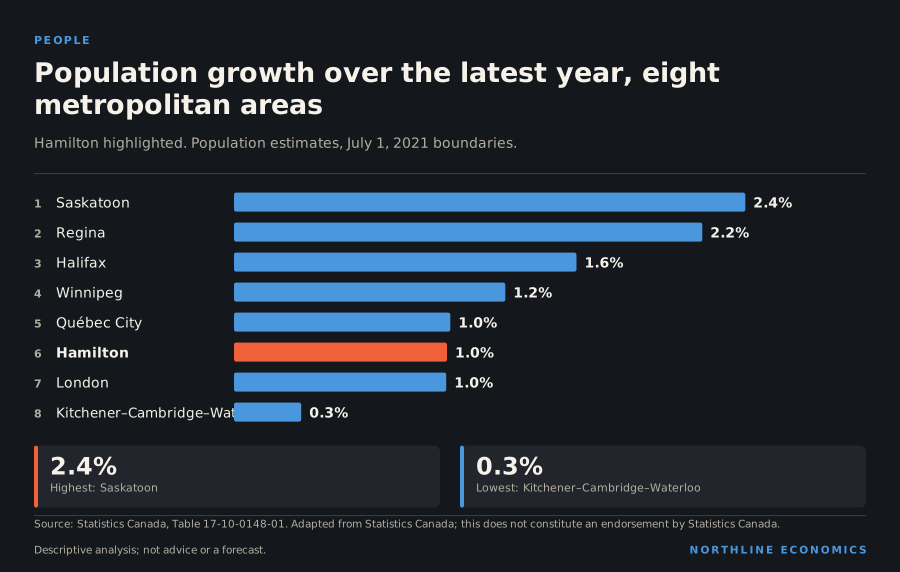
    Arrivals are also modest. Immigrants numbered 7,006 in the twelve months from July 2024, 8.0 per 1,000 residents and the lowest of the fourteen. Net non-permanent residents changed -1,695 and net interprovincial migration -524. The population grew 1.0% in the year to July 2025.

    Population growth over the latest year, eight metropolitan areasPopulation growth over the latest year, eight metropolitan areas. Saskatoon 2.4%; Regina 2.2%; Halifax 1.6%; Winnipeg 1.2%; Québec City 1.0%; Hamilton 1.0%; London 1.0%; Kitchener–Cambridge–Waterloo 0.3%.PEOPLEPopulation growth over the latest year, eightmetropolitan areasHamilton highlighted. Population estimates, July 1, 2021 boundaries.1Saskatoon2.4%2Regina2.2%3Halifax1.6%4Winnipeg1.2%5Québec City1.0%6Hamilton1.0%7London1.0%8Kitchener–Cambridge–Waterloo0.3%2.4%Highest: Saskatoon0.3%Lowest: Kitchener–Cambridge–WaterlooSource: Statistics Canada, Table 17-10-0148-01. Adapted from Statistics Canada; this does not constitute an endorsement by Statistics Canada.NORTHLINE ECONOMICSDescriptive analysis; not advice or a forecast.
    The data behind this graphic
    Population growth over the latest year, eight metropolitan areas
    ItemValue
    Saskatoon2.4%
    Regina2.2%
    Halifax1.6%
    Winnipeg1.2%
    Québec City1.0%
    Hamilton1.0%
    London1.0%
    Kitchener–Cambridge–Waterloo0.3%

    Download this graphic (SVG, with source)

    Jobs: fewer employed, higher unemployment

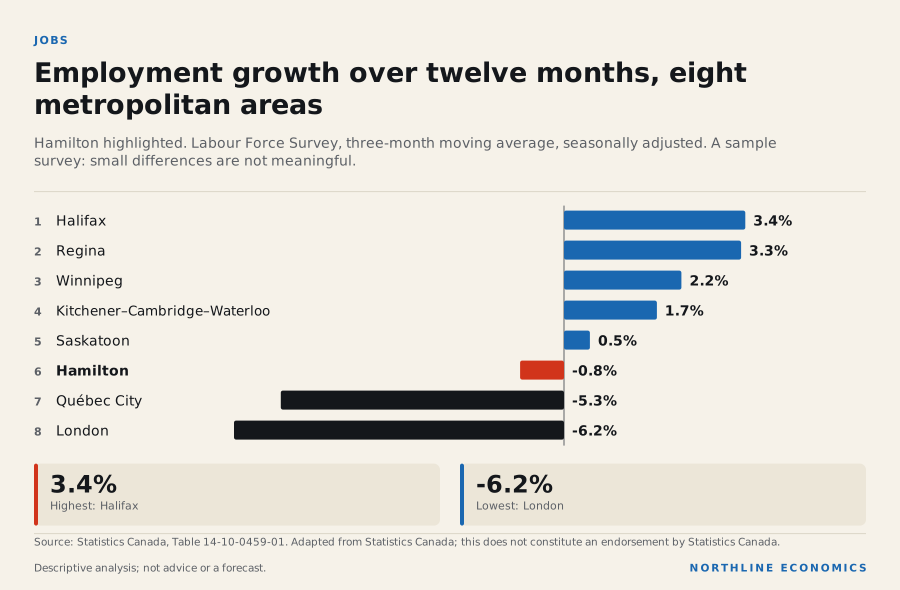
    Employment changed -0.8% against a year earlier, one of only three declines among the eight, and unemployment rose to 7.6% in October 2026 from 6.9% a year earlier. The employment rate of 60.7% is the second lowest of the eight. A sample survey for one metropolitan area can move for reasons that disappear in the next release.

    Employment growth over twelve months, eight metropolitan areasEmployment growth over twelve months, eight metropolitan areas. Halifax 3.4%; Regina 3.3%; Winnipeg 2.2%; Kitchener–Cambridge–Waterloo 1.7%; Saskatoon 0.5%; Hamilton -0.8%; Québec City -5.3%; London -6.2%.JOBSEmployment growth over twelve months, eightmetropolitan areasHamilton highlighted. Labour Force Survey, three-month moving average, seasonally adjusted. A samplesurvey: small differences are not meaningful.1Halifax3.4%2Regina3.3%3Winnipeg2.2%4Kitchener–Cambridge–Waterloo1.7%5Saskatoon0.5%6Hamilton-0.8%7Québec City-5.3%8London-6.2%3.4%Highest: Halifax-6.2%Lowest: LondonSource: Statistics Canada, Table 14-10-0459-01. Adapted from Statistics Canada; this does not constitute an endorsement by Statistics Canada.NORTHLINE ECONOMICSDescriptive analysis; not advice or a forecast.
    The data behind this graphic
    Employment growth over twelve months, eight metropolitan areas
    ItemValue
    Halifax3.4%
    Regina3.3%
    Winnipeg2.2%
    Kitchener–Cambridge–Waterloo1.7%
    Saskatoon0.5%
    Hamilton-0.8%
    Québec City-5.3%
    London-6.2%

    Download this graphic (SVG, with source)

    Output

    Gross domestic product at basic prices was C$44.1 billion in 2022, up 27.2% in five years in current dollars, the second slowest of the eight.

    What it means for decisions

    For a builder or lender, falling new-home prices and low starts together describe a market that is not expanding; for an employer, the numbers suggest more available workers than a year ago; for a household, resale prices are not held, so the data cannot show whether they are falling too.

    What the data cannot say: they do not give resale prices, wages, or the industries behind the job losses; the 2021 Census industry mix is in the Industry section. Nothing here is a forecast.

    1. Jobs: 445 thousand people are employed, -0.8% against a year ago; unemployment is 7.6%. The employment rate, 60.7%, is 7th of 8 among the eight metropolitan areas in this group. Labour
    1. Prices: new-home prices changed -4.0% in the twelve months to September 2026. There is no metropolitan consumer price index. Prices
    1. People: the population changed 1.0% in the year to July 2025. Net non-permanent residents changed -1,695 in the twelve months from July 2024. Population
    1. Housing: new-home prices changed -4.0% in the twelve months to September 2026, with 6,733 homes under construction. Housing
    1. Output: the economy produced C$44.1 billion in 2022. Output The industry mix from the 2021 Census is in Industry.
    1. Connections: the links that reach Hamilton are national or provincial, and none is measured for the city. Connections

    Prepared with AI assistance.

    Follow the relationships

    Sources for this section (6 datasets, 0 documents)

    Data

    Each dataset is used under its licence; attribution and series-level detail are in each chart’s “About this data” panel. Limitations: Metropolitan labour series are sample-survey estimates, three-month averages, and move more than provincial ones. Output is annual, in current dollars and about four years old; population is the July 1 estimate and migration series cover the twelve months from July 1 of the year shown; both are updated once a year, and the figures for 2024-25 were published before Statistics Canada revised its non-permanent resident estimates back to July 2021 in September 2026. Rankings compare only the eight metropolitan areas in this group (and fourteen for the figures per 1,000 residents). Consumer price indices exist for five of the eight, not including Hamilton, and are held here for all items only. No wages, resale prices, rents on the whole housing stock or commercial real estate data are held.

    0.5 · Output and economic size

    How large is the Hamilton economy and how has its output changed?

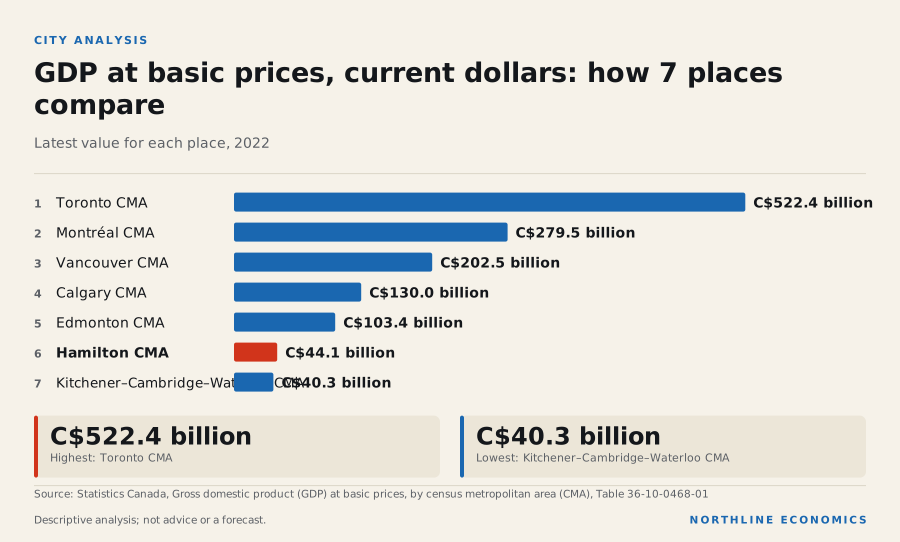
    The Hamilton economy produced C$44.1 billion of output in 2022, 70.9% more in current dollars than in 2009

    Graphic: GDP at basic prices, current dollars: how 7 places compareGDP at basic prices, current dollars: how 7 places compare. Toronto CMA C$522.4 billion; Montréal CMA…

    What happened

    At basic prices and in current dollars, the Hamilton economy produced C$44.1 billion of output in 2022, the latest reference year in Statistics Canada's table. Measured in current dollars, output was 70.9% higher in 2022 than in 2009 and 17.3% higher than in 2019. Over the same period since 2009 Kitchener–Cambridge–Waterloo grew 92.6%, Calgary 72.4%, Edmonton 54.6%, Toronto 85.0%, Vancouver 98.1% and Montréal 75.3%. Ontario's real GDP changed 13.3% from 2019 to 2025; that is a different measure (market prices at 2017 constant prices, province) and is not comparable with the metropolitan current-dollar figures.

    GDP at basic prices: eight more metropolitan areas, indexed

    Annual, current dollars; start of period = 100. Statistics Canada table 36-10-0468-01; the reference year lags the present by about three and a half years.

    Chart loads when it comes into view.

    Latest values: Hamilton CMA 44,090,000,000 (2022); Winnipeg CMA 52,090,000,000 (2022); Halifax CMA 30,310,000,000 (2022); Québec CMA 59,040,000,000 (2022); and 4 more in the data table.

    Why it happened

    Not assessed. The table is in current dollars, so these changes include price increases, and it is not divided by population, so the figures do not separate growth in the number of people from growth in output per person. This section reports the data; attributed explanations of the differences are in the economic story and local-economy sections of this page.

    Why it matters

    GDP at basic prices is the broadest measure of local production that Statistics Canada publishes for metropolitan areas. It shows how large the local economy is, but not who earns the income, what is produced, or how the economy is doing now.

    History

    The series starts in 2009 and ends in 2022. A fall in output in any year in between would show in the chart; no year-by-year explanation is offered here.

    Across geographies

    The metropolitan series are comparable with each other because they come from one table with one definition and one price basis. Levels depend on city size; use growth rates for comparison.

    What it influences

    Not assessed. No relationship in the recorded graph links metropolitan output to another variable.

    Risks

    The table ends in 2022 and describes nothing since; it cannot show the effects of recent changes in interest rates, trade policy, population or commodity prices on Hamilton.

    What to watch

    Statistics Canada's next release of table 36-10-0468-01. No release date for it is in the calendar this site holds, and none is assumed.

    Prepared with AI assistance.

    Follow the relationships

    Sources for this section (2 datasets, 0 documents)

    Data

    Each dataset is used under its licence; attribution and series-level detail are in each chart’s “About this data” panel. Limitations: GDP at basic prices for metropolitan areas is in current dollars, so changes include price increases, and the reference year lags the present by almost four years. No provincial share is stated.

    0.5 · The Hamilton economy: steel under tariff pressure, a decarbonization project that has changed shape, and a housing market adjusting

    What drives Hamilton's economy, why does it differ from Toronto and its Ontario peers, and what pressures sit underneath the headline labour numbers?

    Hamilton's unemployment rate in October 2026 was above Kitchener's and Toronto's and below London's, Stelco is idling its Hamilton finishing lines and the port reports a sharp fall in steel cargo

    Graphic: The Hamilton economy: steel under tariff pressure, a decarbonizatio…The Hamilton economy: steel under tariff pressure, a decarbonization project that has changed shape, and a…

    What happened

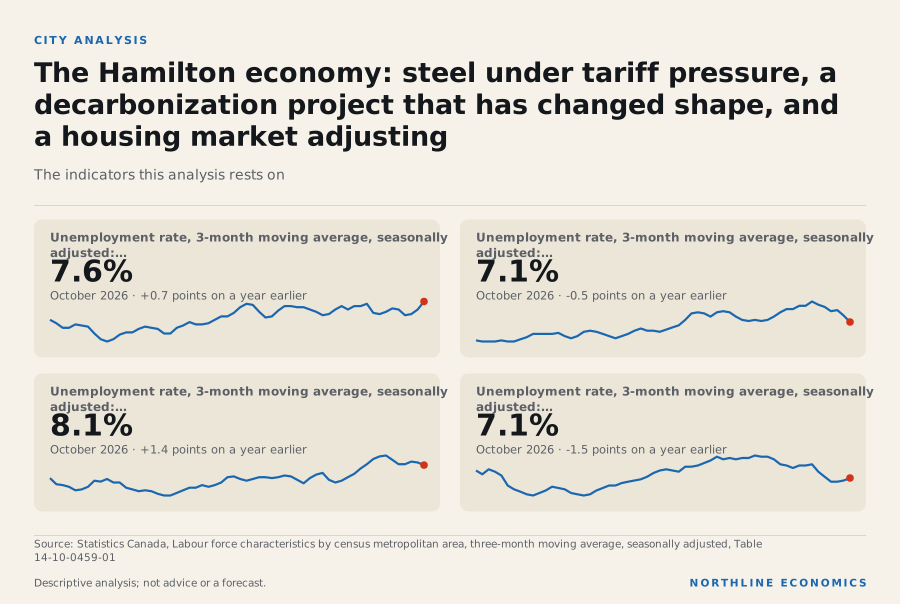
    Hamilton's unemployment rate was 7.6% in October 2026, against 7.1% in Kitchener-Cambridge-Waterloo, 8.1% in London and 7.1% in Toronto. Employment was 445 thousand, -0.8% on a year earlier, so the unemployment rate is higher than in Kitchener-Cambridge-Waterloo and Toronto and lower than in London, and employment is falling. The twelve months to September 2026 account for 2,334 of the 5,085 homes started over two years, and the new-housing price index changed -4.0% in the twelve months to September 2026. The average two-bedroom rent in the October 2025 survey was C$1,659, with a vacancy rate of 3.5%, up from 2.4% a year earlier. The net change in non-permanent residents was -1,695 in the twelve months from July 2024, after 9,210 the year before, on Statistics Canada's metropolitan estimates released 14 January 2026 (it revised its non-permanent resident estimates back to July 2021 in September 2026).

    Why it happened

    Historical context

    Innovation, Science and Economic Development Canada describes ArcelorMittal Dofasco as Canada's largest producer of flat-rolled steel and Hamilton's largest private sector employer. Hamilton's own economic development office says 60 per cent of Canada's steel output comes from Hamilton; that is a promotional claim and the sources cited do not test it.

    Evidence: Innovation, Science and Economic Development Canada: Important milestone for ArcelorMittal Dofasco project that is creating good jobs in the Hamilton steel industry (news release); City of Hamilton, Invest in Hamilton (Economic Development): Manufacturing (sector page)

    Historical context

    CTV News reports that Stelco, which Cleveland-Cliffs bought in 2024 in a 3.4 billion dollar deal, said its Hamilton Works is idling its finishing operations while it concentrates steel production at Lake Erie, and the United Steelworkers local confirmed 350 layoffs at the Hamilton plant.

    Evidence: CTV News / CP24 (Bell Media): Stelco to lay off 350 steelworkers at Hamilton plant, union says

    Historical context

    The Canadian Press reports that Stelco announced layoffs of up to 500 across Hamilton and Lake Erie, citing the trade crisis, weak demand and import pressure, and that the head of Cleveland-Cliffs said the Canadian market is too small to support galvanized steel from both Stelco and ArcelorMittal Dofasco along with imports. He called the layoff temporary, with workers to be recalled if Canada and the United States reach a steel trade deal; a Stelco spokesperson, quoted by CTV, called the Hamilton idle indefinite. The union's Hamilton count was 350 in late September and, in the later report, roughly 330 over three weeks, with further cuts at Lake Erie; the company's ceiling covers both plants.

    Evidence: The Canadian Press, via BNN Bloomberg: Stelco workers would be recalled if trade deal reached; CTV News / CP24 (Bell Media): Stelco to lay off 350 steelworkers at Hamilton plant, union says

    Historical context

    The port shows the same pressure from a different side. HOPA Ports reported, in a release carried by Maritime Magazine, that the Port of Hamilton handled 10,350,606 metric tonnes in 2025, that its three-port network handled 10,814,699 against 11.4 million in 2024, and that steel cargo experienced a sharp decline largely due to tariff instability, while gypsum rose 33 per cent on regional housing construction.

    Evidence: Maritime Magazine, reporting a HOPA Ports (Hamilton-Oshawa Port Authority) press release: HOPA Ports reports 10.8 million tonnes of cargo handled in 2025

    Interpretation

    The Financial Accountability Office of Ontario says Ontario is expected to be disproportionately affected by uncertainty in Canada-US trade relations because its manufacturing sector continues to face significant pressure from US tariffs. It is a provincial statement and does not name Hamilton; the steel decisions above are the metropolitan evidence.

    Evidence: Financial Accountability Office of Ontario: Economic and Budget Outlook, Summer 2026

    Historical context

    The US White House fact sheet of April 2026 says articles made entirely or almost entirely of steel, aluminum or copper pay a flat 50% on their full value, and that the steel and aluminum rate was raised to that level in June 2025.

    Evidence: The White House (Fact Sheet): Fact Sheet: President Donald J. Trump Strengthens Tariffs on Steel, Aluminum, and Copper Imports

    Why it matters

    Historical context

    Ottawa announced in 2021 a federal investment of 400 million dollars in ArcelorMittal Dofasco, supporting a 1.765 billion dollar project to phase out coal-fired steelmaking in Hamilton and cut emissions by up to 3 million tonnes a year by 2030.

    Evidence: Innovation, Science and Economic Development Canada: Government investing in Hamilton’s steel industry to support good jobs and significantly reduce emissions (news release)

    Historical context

    Environmental Defence, an advocacy organisation, reports that the federal department told it Dofasco had altered its plans to source reduced iron from its furnace in Contrecoeur, Quebec rather than building a new facility in Hamilton, that the company cited tariffs and business uncertainty, and that, according to the group, ArcelorMittal's most recent quarterly report showed the plant prospering despite American tariffs. The group also reports a federal funding agreement pushed from 2028 to 2050.

    Evidence: Environmental Defence (advocacy organisation; statement reporting CBC Hamilton and ISED): Environmental Groups Demand Answers from ArcelorMittal on Hamilton Decarbonization Project

    Historical context

    Its April statement says federal officials stated that project timelines remain the same, and that Dofasco is closing its No. 3 coke plant and reassigning that plant's 50 employees. The January and April accounts disagree on whether the timeline moved; neither the department nor ArcelorMittal is cited directly, so what is built, where and when is not established here.

    Evidence: Environmental Defence (advocacy organisation): Dofasco Shuts Coke Plant but Remains Silent on Decarbonization Project

    Historical context

    On 21 October the Prime Minister and the Premier announced a new action plan, including more than 5 billion dollars to steel mills so that steelworkers in Hamilton and Sault Ste. Marie can keep working. This is an announced commitment; the page does not say how much goes to Hamilton or on what conditions.

    Evidence: Prime Minister of Canada: Prime Minister Carney and Premier Ford launch new action plan to protect workers from tariffs and strengthen Ontario industries

    The steel firms are large employers but the metropolitan job base is wider. By the 2021 Census, health care and social assistance accounted for 15.8% of jobs located in the area, retail trade 12.0% and manufacturing 11.5%. Manufacturing is a larger share of jobs in Kitchener-Cambridge-Waterloo (16.1%) than in Hamilton, and about the same in London (11.2%).

    History

    Hamilton's unemployment rate has ranged from 3.5% (March 2019) to 13.0% (June 2020) over ten years, and the metropolitan population grew 14.2% over ten years. The Labour Force Survey's annual manufacturing employment was 50 thousand in 2011 and 46 thousand in 2025; survey estimates for a single metropolitan area are volatile from year to year (the 2024 value was 43 thousand), so no single year's change should be read as a trend.

    Across geographies

    Historical context

    Statistics Canada reports that 36,795 people living in the Hamilton CMA commuted to Toronto in the 2021 Census, just over 93 per cent of them by automobile, and that 75.8 per cent of Hamilton's transit commuters faced 60 minutes or more.

    Evidence: Statistics Canada (StatsCAN Plus): GTA: Getting there by automobile

    Historical context

    Statistics Canada reports that the Toronto CMA had a net loss of 64,794 people to the rest of Ontario in the year to July 2025, and that other CMAs and census agglomerations have continued to see higher gains from exchanges with urban areas within their provinces, the leading contributor to their growth in Ontario and Quebec. The release does not name Hamilton. Hamilton's own net intraprovincial migration was 5,083 in the twelve months from July 2024, but no source cited says how much of it comes from Toronto.

    Evidence: Statistics Canada: The Daily: Canada’s population estimates: Subprovincial areas, 2025

    What it influences

    Hypothesis, not established

    The fall in non-permanent residents could reduce demand for rental housing; Hamilton's vacancy rate rose from 2.4% to 3.5% over a similar period, which is consistent with that but cannot show it.

    Evidence: Statistics Canada: The Daily: Canada's population estimates, second quarter 2026

    Historical context

    The City reports that the Ministry of Finance's 2025 projection puts the City of Hamilton's 2051 population at 853,130, down from 903,270 in the 2024 projection, and that the Ministry names a planned decrease in federal immigration targets as the primary driver. The projections include no explicit economic assumptions.

    Evidence: City of Hamilton, Planning and Economic Development: Updated Ministry of Finance Population Projections for the City of Hamilton to the Year 2051 (communication update, 25 August 2025)

    Historical context

    CMHC's July 2026 outlook forecasts Hamilton total starts falling from 3,146 in 2025 to 2,300 in 2026 in its baseline, then 2,700 in 2027 and 2,900 in 2028, with the rental vacancy rate rising from 3.6 per cent in 2025 to 4.3 per cent in 2028. Starts in the nine months to September 2026 were 1,253.

    Evidence: Canada Mortgage and Housing Corporation: Summer Update: 2026 Housing Market Outlook

    Historical context

    Ottawa says it is investing up to 1.7 billion dollars in the Hamilton LRT, with Ontario paying the balance. The first major civil and utility package went to the Hamilton Transit Alliance, led by Aecon, which will spend the next two years on detailed design and construction planning and a target price. The release gives no opening date.

    Evidence: Housing, Infrastructure and Communities Canada: Federal government highlights progress on Hamilton LRT (news release)

    Risks

    Historical context

    The Financial Accountability Office projects Ontario real GDP growth of 0.6 per cent in 2026, slowing from 1.3 per cent in 2025 as US tariffs hindered exports and investment, with the provincial unemployment rate at 7.7 per cent in 2025. Statistics Canada's revised market-price series at 2017 constant prices, released on 5 November 2026, shows Ontario's growth at 1.8% in 2025. This is Ontario, not Hamilton.

    Evidence: Financial Accountability Office of Ontario: Economic and Budget Outlook, Summer 2026

    Opinion

    Hamilton's steel exposure is concentrated in a few firms, one of which has a US-based parent, and whose output depends on US and Canadian trade policy, so the metropolitan labour numbers can change faster than local demand would explain. The sources do not measure how many metropolitan jobs depend directly on the two mills.

    What to watch

    Whether Stelco recalls its workers and what Ottawa does about the 2024 acquisition commitments, which the press reports include keeping unionized staff for five years; any ArcelorMittal Dofasco statement on where its iron will be made; the allocation of the announced steel funding; the Hamilton LRT target price; CMHC's autumn Rental Market Survey; and Statistics Canada's monthly Labour Force Survey and next population estimates. These are the publishers' forecasts and reports, not Northline's.

    Prepared with AI assistance.

    Follow the relationships

    Sources for this section (10 datasets, 16 documents)

    Data

    Documents cited

    Each dataset is used under its licence; attribution and series-level detail are in each chart’s “About this data” panel. Limitations: Every explanation here is a statement by the named organisation. Geographies are mixed and labelled where used: Statistics Canada's census metropolitan area (larger than the City) for unemployment, employment, starts, rents and population; the City of Hamilton (also a census division) for the City's own claims and its building-permit and starts figures; Ontario for the Financial Accountability Office's and the Province's statements. Metropolitan wages, GDP by industry or after 2022 and a sourced ranking of the largest employers are not held. Statements about the ArcelorMittal Dofasco project come from an advocacy organisation (Environmental Defence) relaying what it says federal officials and the company told it; neither the federal department nor the company is cited directly, and the two Environmental Defence statements differ on timing. Stelco statements come from press reports of company and union remarks. Forecasts are the publishers' and are not Northline forecasts.
    0.6 · Hamilton's local economy: a steel and port city whose largest employers are now hospitals and universities, with a transit line and two steel decisions that will shape it

    What is Hamilton's local economy made of, which employers, clusters and projects does it depend on, and how do the sources separate funded commitments, announced proposals and observed outcomes?

    Health care and social assistance is Hamilton's largest industry by jobs, steel is the best-known one, and the City, the Province and Ottawa each describe a different pipeline of investment: some funded, some announced, some already changed

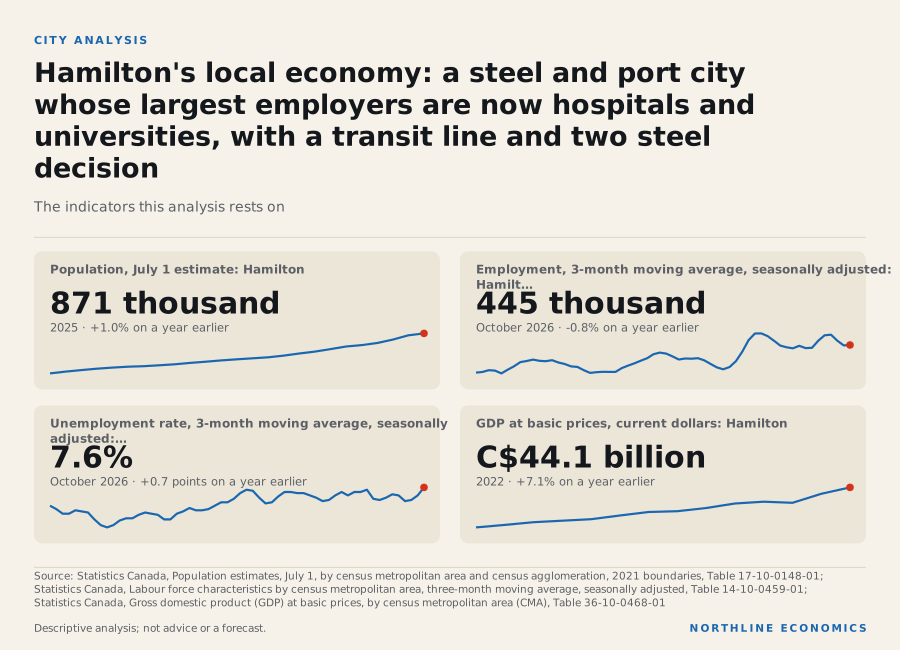
    Graphic: Hamilton's local economy: a steel and port city whose largest emplo…Hamilton's local economy: a steel and port city whose largest employers are now hospitals and…

    What happened

    Hamilton's census metropolitan area had 871 thousand people on 1 July 2025, 1.0% on the year before. Employment was 445 thousand in October 2026 and the unemployment rate 7.6%. Its gross domestic product at basic prices was C$44.1 billion in 2022, the latest year Statistics Canada has published for the area.

    Historical context

    The City of Hamilton, whose figures cover the City and not the whole metropolitan area, reports an estimated 2.30 billion dollars of building permit construction value in 2025, a 47.3 per cent increase over 2024. The same page says large employers of 500 or more people are only 0.2 per cent of the City's businesses.

    Evidence: City of Hamilton, Invest in Hamilton (Economic Development): Insights & Data

    Why it happened

    By the 2021 Census, health care and social assistance was the largest industry among jobs located in the area (15.8% of 309 thousand), followed by retail trade (12.0%), manufacturing (11.5%), educational services (9.5%) and professional, scientific and technical services (9.2%). These are 2021 Census counts of jobs by place of work.

    Historical context

    The City's economic development office says more than 750 manufacturing companies provide 25,000 jobs in Hamilton, 11 per cent of employment in the City, that the sector generates a combined 21 billion dollars of imports and exports, and that it spans steel, automotive, aerospace and food processing. The census count for the metropolitan area is larger (35 thousand jobs in 2021); the two cover different geographies, years and definitions, and neither source reconciles them.

    Evidence: City of Hamilton, Invest in Hamilton (Economic Development): Manufacturing (sector page)

    Historical context

    The City's 2022 Manufacturing Sector Strategy names steel and metal and decarbonization technologies among its spotlighted subsectors, and records that federal and provincial investments aimed at supporting innovation and decarbonization totalled 900 million dollars in 2021, which is the Dofasco support described below. It is a City strategy document, not an assessment of results.

    Evidence: City of Hamilton, Economic Development (prepared with consultants): Manufacturing Sector Strategy (November 2022)

    Historical context

    The City's economic development office calls Hamilton home to the busiest of all Canadian Great Lake ports and the country's largest overnight express cargo airport, with CN and CPKC rail. The airport, which is owned by the City of Hamilton and managed under an agreement by TradePort International Corporation, reports that it handled 750 million kilograms of billable cargo aircraft weight in 2025 with partners including Cargojet, DHL Express, UPS, Purolator, Canada Post and Amazon/Prime Air.

    Evidence: City of Hamilton, Invest in Hamilton (Economic Development): Goods Movement (sector page); John C. Munro Hamilton International Airport: Hamilton International releases its 2025 Year in Review

    Historical context

    HOPA, the Hamilton-Oshawa Port Authority, which runs the Port of Hamilton, oversees more than 1,400 acres and more than 160 tenant companies employing approximately 40,000 people, according to the City's 2024 announcement. That count is for HOPA's ports in Hamilton, Oshawa and Niagara together, not Hamilton alone.

    Evidence: City of Hamilton, Invest in Hamilton (Economic Development): Hamilton now home to Canada’s largest sugar refinery (SucroCan announcement, 16 January 2024)

    Historical context

    Hamilton Health Sciences calls itself the largest employer in the Greater Hamilton region, a community of 18,000 staff, physicians, researchers and volunteers.

    Evidence: Hamilton Health Sciences: About Us

    Historical context

    McMaster University says it is one of the five largest employers in Hamilton, directly employing more than 8,000 faculty and staff and creating more than 14,000 jobs through its annual operating spending, and that McMaster Innovation Park hosts 70 companies and over 800 employees. These counts are not comparable: the hospital figure includes volunteers and physicians, and the university's second figure includes indirect jobs. ISED separately calls ArcelorMittal Dofasco Hamilton's largest private sector employer.

    Evidence: McMaster University: Economic Impact (Discover McMaster)

    Why it matters

    The Labour Force Survey's annual employment by industry for the area shows which sectors have grown since 2019. Health care and social assistance changed 8.6%, public administration 57.0%, construction 15.1% and manufacturing -9.0%, while accommodation and food services changed -19.2%, educational services 19.5% and agriculture -61.5%. Professional, scientific and technical services was 39 thousand in 2023, 48 thousand in 2024 and 41 thousand in 2025, a swing that shows how noisy single-area annual estimates are. The very large moves in public administration and agriculture are probably partly sampling noise, and even health care, the largest group, has moved by several thousand from one year to the next, so no one of these changes should be read as a trend.

    Historical context

    Ottawa announced in 2021 a federal investment of 400 million dollars in ArcelorMittal Dofasco, supporting a 1.765 billion dollar conversion to phase out coal-fired steelmaking in Hamilton, expected to support as many as 2,500 construction jobs. ISED's October 2022 release records the groundbreaking, so this was a funded commitment with construction announced.

    Evidence: Innovation, Science and Economic Development Canada: Government investing in Hamilton’s steel industry to support good jobs and significantly reduce emissions (news release); Innovation, Science and Economic Development Canada: Important milestone for ArcelorMittal Dofasco project that is creating good jobs in the Hamilton steel industry (news release)

    Historical context

    CBC Hamilton reported in September 2024 that construction had yet to begin on the upgrades, which were to phase out coal at the plant and cut emissions 60 per cent by 2028; Dofasco told CBC it remained committed with no changes to its targets, timelines or budgets, and the federal government said in a statement that Dofasco aims to hit its emission goal in 2030, two years after the announced project deadline.

    Evidence: CBC News (Hamilton): ArcelorMittal Dofasco misses key milestones in $1.8B green steel project promised for 2028 (3 September 2024)

    Historical context

    Environmental Defence reports that the project was planned to start in January 2023 and end in 2026 with 900 million dollars of government support, that the plant is Ontario's single largest source of industrial greenhouse gas emissions at 4.16 megatonnes in 2023, that a federal department indicated Dofasco now plans to source reduced iron from Contrecoeur, Quebec rather than build a new facility in Hamilton, and that Dofasco has operated one electric arc furnace in Hamilton since 1996. The group's January and April statements disagree on whether the funding timeline moved to 2050 or remains unchanged. The delay against the original schedule is reported by an advocacy group: the company and the department are not cited directly.

    Evidence: Environmental Defence (advocacy organisation; statement reporting CBC Hamilton and ISED): Environmental Groups Demand Answers from ArcelorMittal on Hamilton Decarbonization Project; Environmental Defence (advocacy organisation): Dofasco Shuts Coke Plant but Remains Silent on Decarbonization Project

    Historical context

    CTV News and The Canadian Press report that Stelco's Hamilton Works, which produces cold-rolled and galvanized steel, is idling its finishing operations. When Cleveland-Cliffs bought Stelco in 2024 it made commitments that include keeping at least the same number of unionized employees and the vast majority of non-unionized employees for five years; the federal industry minister has demanded a plan to honour them and rejected the suggestion that US tariffs relieve the company of them, and the Cleveland-Cliffs chief called her comments unfair. The company says steel output will not change but its product mix will.

    Evidence: CTV News / CP24 (Bell Media): Stelco to lay off 350 steelworkers at Hamilton plant, union says; The Canadian Press, via BNN Bloomberg: Stelco workers would be recalled if trade deal reached

    Historical context

    The 21 October action plan from the Prime Minister and Premier lists more than 5 billion dollars for steel mills in Hamilton and Sault Ste. Marie. It is an announcement; the page gives no split, no timing and no conditions.

    Evidence: Prime Minister of Canada: Prime Minister Carney and Premier Ford launch new action plan to protect workers from tariffs and strengthen Ontario industries

    Historical context

    SucroCan Sourcing announced in January 2024 a 135 million dollar refinery at the Port of Hamilton with annual capacity of 1 million metric tonnes, scheduled to open in 2025. The City's June 2026 newsletter says the company completed work on Canada's largest sugar refinery, against a scheduled opening in 2025; the newsletter gives no opening date and no jobs or output figure.

    Evidence: City of Hamilton, Invest in Hamilton (Economic Development): Hamilton now home to Canada’s largest sugar refinery (SucroCan announcement, 16 January 2024); City of Hamilton, Invest in Hamilton (Economic Development): Invest in Hamilton newsletter, June 2026

    Historical context

    Other items the City lists are smaller or earlier-stage: Rain Carbon opened a new research centre, and Hanwha Ocean signed a memorandum of understanding with Ontario Shipyards and Mohawk College for shipbuilding training programs at the Hamilton facility. A memorandum for training is not an investment or a contract to build.

    Evidence: City of Hamilton, Invest in Hamilton (Economic Development): Invest in Hamilton newsletter, February 2026; City of Hamilton, Invest in Hamilton (Economic Development): Invest in Hamilton newsletter, June 2026

    History

    The metropolitan population was 689 thousand in 2001 and 871 thousand in 2025, 14.2% higher than ten years earlier. In the twelve months from July 2024 births were 7,921 and deaths 7,619, so natural increase was small; immigrants numbered 7,006, net intraprovincial migration 5,083 and net interprovincial migration -524. Net non-permanent residents were 9,210 the year before and -1,695 in the latest year, on Statistics Canada's metropolitan estimates released 14 January 2026 (it revised its non-permanent resident estimates back to July 2021 in September 2026).

    Historical context

    Statistics Canada's 2021 Census release counted 36,795 people living in the Hamilton CMA who worked in the Toronto CMA, just over 93 per cent of them travelling by automobile. That is the only commuting link between the two quantified in the sources cited; it comes from the 2021 Census, taken during the pandemic, and is not a measure of how much Toronto's economy supports Hamilton's.

    Evidence: Statistics Canada (StatsCAN Plus): GTA: Getting there by automobile

    Historical context

    The City reported 4,142 construction starts in the City of Hamilton in 2023, and that the Province has set a target for Hamilton to deliver 47,000 by 2031.

    Evidence: City of Hamilton: Housing Briefing Note (September 2024)

    Across geographies

    Historical context

    The City's economic development office reports housing starts in the Hamilton census division of 1,481 in 2024 and 2,577 in 2025. CMHC's table for Hamilton gives 2,627 for 2024 and 3,146 for 2025, matching Statistics Canada's metropolitan series (2,334 in the twelve months to September 2026). The City's and CMHC's numbers differ by hundreds to over a thousand units a year; the sources do not state why, but the City's figures are for the census division and Statistics Canada's series is for the larger metropolitan area.

    Evidence: City of Hamilton, Invest in Hamilton (Economic Development): Insights & Data; Canada Mortgage and Housing Corporation: Summer Update: 2026 Housing Market Outlook

    Hamilton's unemployment rate was 7.6% in October 2026, against 7.1% in Kitchener-Cambridge-Waterloo, 8.1% in London and 7.1% in Toronto. By census jobs, manufacturing is a smaller share in Hamilton (11.5%) than in Kitchener-Cambridge-Waterloo (16.1%), while health care is a larger one (15.8% against 11.3%), and London's mix (11.2% manufacturing, 17.4% health care) is close to Hamilton's.

    Historical context

    Statistics Canada says the share of Ontario's new immigrants who settled in the Toronto CMA fell from 76.1 per cent to 60.5 per cent over five years, with all other CMAs gaining share. The release does not give Hamilton's share.

    Evidence: Statistics Canada: The Daily: Canada’s population estimates: Subprovincial areas, 2025

    What it influences

    Historical context

    The Hamilton LRT is a funded commitment with construction contracting under way, not an operating line. Ottawa is contributing up to 1.7 billion dollars and Ontario the balance; the line will run 14 kilometres with 17 stops and carry up to 50,000 riders, with stops at McMaster University and Eastgate Square. The first major civil and utility package went to a Hamilton Transit Alliance led by Aecon, which will spend two years on detailed design, schedules and a target price, so the cost and opening date are not yet fixed in the source.

    Evidence: Housing, Infrastructure and Communities Canada: Federal government highlights progress on Hamilton LRT (news release)

    Historical context

    CMHC's July 2026 baseline forecast for Hamilton puts the rental vacancy rate at 4.0 per cent in 2026 and 4.3 per cent in 2028, and the average two-bedroom rent at 1,710 dollars in 2026 and 1,824 in 2028. It says Ontario will see historically low levels of construction, particularly in condominiums, and the weakest price growth because of slower population growth, affordability and higher supply. Observed values: the average two-bedroom rent was C$1,659 and the vacancy rate 3.5% in 2025, with 6,733 homes under construction in September 2026.

    Evidence: Canada Mortgage and Housing Corporation: Summer Update: 2026 Housing Market Outlook

    Historical context

    The Ministry of Finance's projections are the main long-run forecast the sources give. The City reports its 2051 population at 853,130 in the 2025 update, down from 903,270 a year earlier, with the Ministry citing a planned decrease in federal immigration targets. The Ministry's 2026 release still has Hamilton among the census divisions growing by over 30 per cent to 2051, with natural increase turning negative by 2051, and says the projections are not policy targets and carry no explicit economic assumptions.

    Evidence: City of Hamilton, Planning and Economic Development: Updated Ministry of Finance Population Projections for the City of Hamilton to the Year 2051 (communication update, 25 August 2025); Ontario Ministry of Finance: Ontario Population Projections, 2025-2051

    Historical context

    The City's 2026-2030 Economic Development Action Plan, the document that would set local priorities, was delayed because the uncertainty created by rapid changes to the US-Canada trade relationship in 2025 forced staff into tariff-focused projects, including research to measure the risks and forecast impacts of tariffs on Hamilton's economy. No published plan appears in the sources cited.

    Evidence: City of Hamilton, Planning and Economic Development: 2026-2030 Economic Development Action Plan Production Updates (communication update to Council)

    Risks

    Historical context

    The City's economic development office says more than 500 products are now subject to a 50 per cent US import tariff and that its preliminary estimate is that approximately 12 per cent of Hamilton's goods-producing companies may be affected. The product list it links is alcohol, dairy and agriculture and finished products, not steel; steel and aluminum remain under separate Section 232 tariffs, as the City's February newsletter says.

    Evidence: City of Hamilton, Invest in Hamilton (Economic Development): Trade and Tariff Update – August 25, 2026; City of Hamilton, Invest in Hamilton (Economic Development): Invest in Hamilton newsletter, February 2026

    Historical context

    HOPA Ports reports, in a release carried by Maritime Magazine, that steel cargo experienced a sharp decline largely due to tariff instability, while gypsum rose 33 per cent on regional housing construction; the port handled 10,350,606 metric tonnes at Hamilton in 2025.

    Evidence: Maritime Magazine, reporting a HOPA Ports (Hamilton-Oshawa Port Authority) press release: HOPA Ports reports 10.8 million tonnes of cargo handled in 2025

    Historical context

    The Bayfront Industrial Area is a 1,607 hectare mixed industrial area on the shore of Hamilton Harbour which the City says it is revitalizing to create development opportunities for manufacturers. The page gives no timetable or funding.

    Evidence: City of Hamilton, Invest in Hamilton (Economic Development): Manufacturing (sector page)

    Opinion

    The sources show a local economy with three kinds of anchor: public-sector institutions (hospitals, McMaster, City) whose scale is described by the institutions themselves; heavy industry tied to US trade policy; and logistics tied to the port, rail and airport. The first has grown in the Labour Force Survey data; the second is where the announced layoffs and project changes are; the third reports a mixed port year. The sources do not quantify how many metropolitan jobs depend on each.

    What to watch

    The Stelco dispute with Ottawa and any recall; ArcelorMittal Dofasco's statement on where it will make iron and what the federal funding now covers; the split of the announced steel funding; the Hamilton LRT target price and opening date; the 2026-2030 Economic Development Action Plan once published; CMHC's autumn Rental Market Survey against its forecast; the Statistics Canada population estimates for the area; and the Ministry of Finance's next projections. Not held here: metropolitan wages, GDP by industry or after 2022, a sourced employer ranking, an independent metropolitan outlook, and a Hamilton-specific figure for migration from Toronto.

    Prepared with AI assistance.

    Follow the relationships

    Sources for this section (9 datasets, 28 documents)

    Data

    Documents cited

    Each dataset is used under its licence; attribution and series-level detail are in each chart’s “About this data” panel. Limitations: Every explanation is a statement by the named organisation. Three geographies are mixed and labelled where used: Statistics Canada's census metropolitan area (which includes Burlington and Grimsby) for the series; the City of Hamilton, which is also a single-tier census division, for the City's own statistics and claims; and Ontario for provincial statements. Metropolitan wages, GDP by industry or after 2022 and a sourced ranking of the largest employers are not held: Hamilton Health Sciences calls itself the largest employer in the Greater Hamilton region, ISED calls ArcelorMittal Dofasco the largest private sector employer and McMaster says it is one of the five largest, but no source ranks them with headcounts on a common basis. The Conference Board / Signal49 Hamilton outlook and the City's trade-and-tariffs hub page are not cited. Economic development figures are the City's and are promotional. Statements about the ArcelorMittal Dofasco project come from an advocacy organisation relaying federal and company remarks. Annual industry employment is from the Labour Force Survey, whose single-area estimates are volatile. Forecasts are the publishers', not Northline forecasts.

    1 · Labour market

    Is Hamilton's labour market keeping pace with the large metropolitan areas?

    In October 2026, Hamilton had 445 thousand workers, employment had changed -0.8% over the year and unemployment was 7.6%, with 60.7% of adults employed

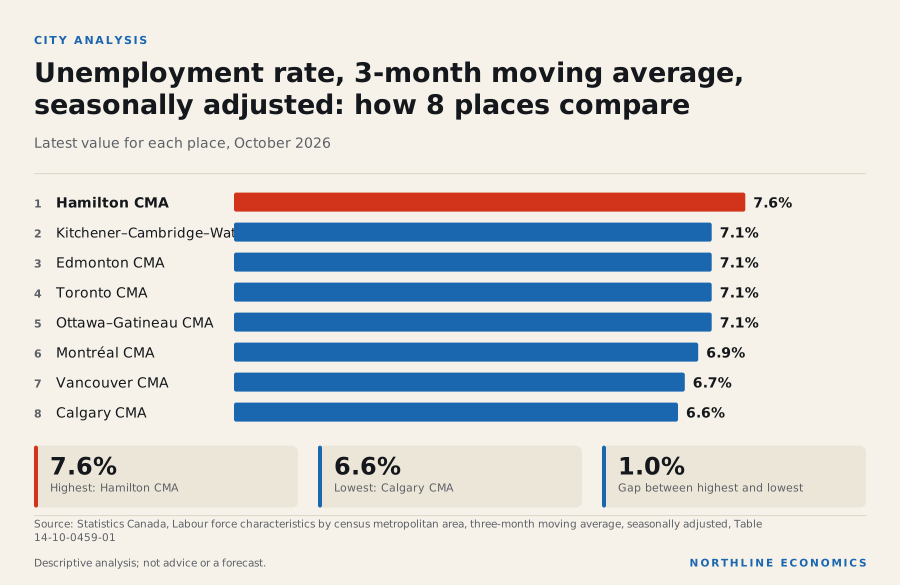
    Graphic: Unemployment rate, 3-month moving average, seasonally adjusted: how…Unemployment rate, 3-month moving average, seasonally adjusted: how 8 places compare. Hamilton CMA 7.6%;…

    What happened

    Hamilton's seasonally adjusted unemployment rate (three-month average) was 7.6% in October 2026, from 6.9% a year earlier. For comparison, Kitchener–Cambridge–Waterloo's was 7.1%; among the six large metropolitan areas: Calgary's 6.6%, Edmonton's 7.1%, Toronto's 7.1%, Vancouver's 6.7%, Montréal's 6.9%, Ottawa–Gatineau's 7.1%. Employment of 445 thousand changed -0.8% over the year, against 6.2% in Calgary, 1.9% in Toronto and 1.2% in Vancouver.

    Unemployment rate: eight more metropolitan areas

    Percent, three-month moving average, seasonally adjusted (same table as the six large cities).

    Chart loads when it comes into view.

    Latest values: Hamilton CMA 7.6 (2026-10); Winnipeg CMA 5 (2026-10); Halifax CMA 5.4 (2026-10); Québec CMA 4.5 (2026-10); and 4 more in the data table.

    Employment, indexed: Hamilton, other mid-size cities and the six large cities

    Three-month moving average, seasonally adjusted; start of period = 100.

    Chart loads when it comes into view.

    Latest values: Hamilton CMA 444,600 (2026-10); Winnipeg CMA 523,000 (2026-10); Halifax CMA 303,200 (2026-10); Québec CMA 478,100 (2026-10); and 10 more in the data table.

    The participation rate is 65.7% and the employment rate 60.7%, against 66.7% in Calgary, 62.2% in Toronto and 63.4% in Vancouver. Among the eight smaller metropolitan areas covered here (Winnipeg, Halifax, Québec, Hamilton, Kitchener, London, Saskatoon, Regina) its employment rate ranks 7th of 8.

    Employment rate: eight more metropolitan areas

    Percent of the population aged 15 and over, three-month moving average, seasonally adjusted.

    Chart loads when it comes into view.

    Latest values: Hamilton CMA 60.7 (2026-10); Winnipeg CMA 64.3 (2026-10); Halifax CMA 65 (2026-10); Québec CMA 63.4 (2026-10); and 4 more in the data table.

    Participation rate: Hamilton, other mid-size cities and the six large cities

    Percent of the population aged 15 and over, three-month moving average, seasonally adjusted.

    Chart loads when it comes into view.

    Latest values: Hamilton CMA 65.7 (2026-10); Winnipeg CMA 67.8 (2026-10); Halifax CMA 68.7 (2026-10); Québec CMA 66.4 (2026-10); and 10 more in the data table.

    By industry, Statistics Canada's annual Labour Force Survey estimates (table 14-10-0468-01, annual averages, not seasonally adjusted) put average employment in Hamilton at 442 thousand in 2025, a change of 2.1% on the year before and of 6.2% since 2019. Goods-producing industries account for 18.7% of employed persons and services-producing industries for 81.3%; among the individual groups, health care and social assistance 13.7%, wholesale and retail trade 16.4% and manufacturing 10.5% of employment. The table counts people by the industry of their main job and by where they live, so it is a measure of employment, not of output, wages or the number of businesses. Estimates for a single industry group in one metropolitan area come from a small survey sample and are less steady than the total: Statistics Canada suppresses some cells, and the table is annual, so a one-year move in a small group should not be read as a trend. No sampling-error range is held with these series, so none is quoted. Wages for the metropolitan area are not held here; the Statistics Canada wage tables used cover provinces and Canada.

    Employment in Hamilton: goods and services, indexed

    Annual average of employed persons, Labour Force Survey (Statistics Canada table 14-10-0468-01); first year shown = 100. Goods-producing and services-producing sectors against all industries. Annual estimates, not seasonally adjusted.

    Chart loads when it comes into view.

    Latest values: All industries 442,200 (2025); Goods-producing sector 82,900 (2025); Services-producing sector 359,300 (2025).

    Employment by industry group in fourteen metropolitan areas, 2025

    Share of employed persons living in each metropolitan area who work in each group (annual average, Labour Force Survey; the survey classifies jobs by the industry of the person’s main job, not by where the employer sits). Single-sector estimates for one metropolitan area rest on small samples; a city is left out of a chart where Statistics Canada suppresses the estimate. Shares are computed by this project from Statistics Canada table 14-10-0468-01.

    Chart loads when it comes into view.

    Top values: Kitchener–Cambridge–Waterloo 25.3%; Edmonton 20.8%; Calgary 20%.

    Why it happened

    The data show where Hamilton stands, not why. Since the end of 2019 employment has changed 4.8% in Hamilton, 19.7% in Kitchener–Cambridge–Waterloo, 27.1% in Calgary and 10.9% in Toronto; the data held here cannot say why those paths differ.

    Historical context

    Statistics Canada reports that in October employment fell in Alberta and Prince Edward Island, rose in British Columbia and Newfoundland and Labrador, and was little changed in Ontario. That is the provincial picture and not a statement about Hamilton.

    Evidence: Statistics Canada: Labour Force Survey, October 2026 (The Daily)

    Why it matters

    Jobs matter for household income and housing demand. The employment rate says more than the unemployment rate about how much of the adult population is working, because people who stop looking for work leave the unemployment count.

    History

    Over ten years Hamilton's unemployment rate has averaged 6.1%, with a high of 13.0% in June 2020 and a low of 3.5% in March 2019. The Labour Force Survey series for the metropolitan area start in 2011 for employment and participation (earlier months are not held).

    Across geographies

    Hamilton's rate minus Kitchener–Cambridge–Waterloo's is 0.5 percentage points. As context, on a different definition (monthly, province-wide), Ontario's unemployment rate is 7.3% and Canada's 6.7%; these must not be read against the metropolitan three-month averages.

    What it influences

    Jobs matter for household income and housing demand in the region. No link from Hamilton's employment to another variable is measured here.

    Risks

    Not assessed: the exposure of Hamilton's employment to particular industries or to US demand over time, beyond what the annual industry employment shown above describes; that table does not measure exposure to US demand.

    What to watch

    Statistics Canada's Labour Force Survey (release dates in the calendar).

    Prepared with AI assistance.

    Follow the relationships

    Sources for this section (3 datasets, 1 documents)

    Data

    Documents cited

    Each dataset is used under its licence; attribution and series-level detail are in each chart’s “About this data” panel. Limitations: Metropolitan rates are three-month moving averages from the Labour Force Survey and are noisier than national figures. They are not comparable with provincial or national monthly rates and are never charted with them. Annual employment by industry is a Labour Force Survey sample estimate (noisy for small groups); wages and demographic breakdowns for the metropolitan area are not held; the 2021 Census industry mix is in a separate section.

    2 · Prices

    What do the price data show for Hamilton, given that no metropolitan consumer price index exists?

    Hamilton's new-home prices changed -4.0% over the year to September 2026; Statistics Canada publishes no consumer price index for the metropolitan area

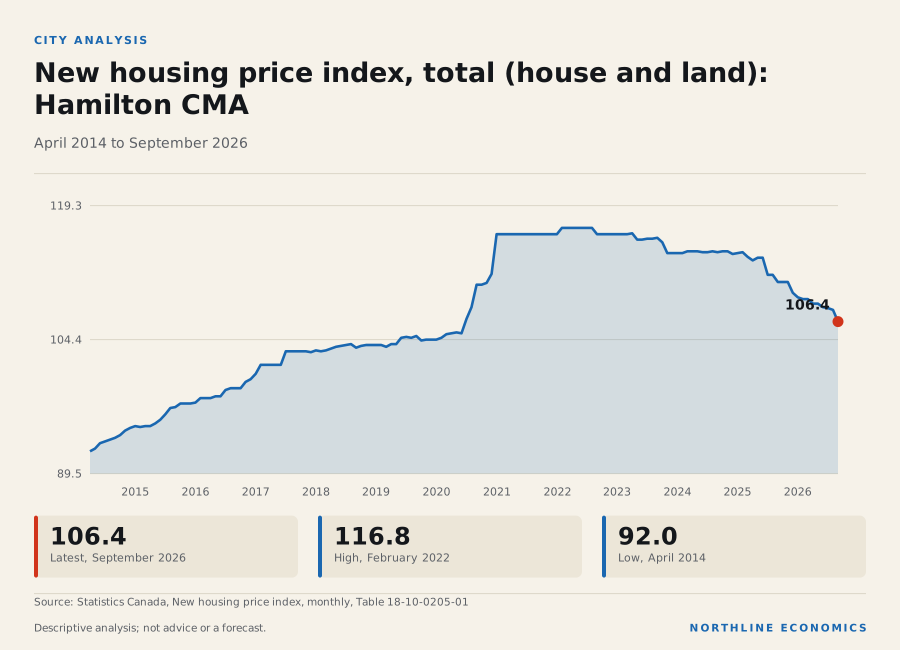
    Graphic: New housing price index, total (house and land): Hamilton CMANew housing price index, total (house and land): Hamilton CMA. Latest, September 2026 106.4; High,…

    What happened

    Hamilton's new housing price index changed -4.0% over the twelve months to September 2026 and -8.4% over five years; over the same twelve months the index changed -2.0% in Kitchener–Cambridge–Waterloo, -4.9% in Toronto and 0.0% in Calgary. National consumer price inflation was 3.1% in September 2026.

    New housing price index, rebased: Hamilton, other mid-size cities and the six large cities

    Each city is indexed to its own base, so levels are not comparable; start of period = 100.

    Chart loads when it comes into view.

    Latest values: Hamilton CMA 106.4 (2026-09); Winnipeg CMA 148.6 (2026-09); Halifax CMA 128 (2026-09); Québec CMA 144.2 (2026-09); and 10 more in the data table.

    Why it happened

    The series show the change, not its cause. No source cited in this section explains Hamilton's new-home price movement; the local-economy section of this page states what the published sources say about the city's housing market.

    Why it matters

    A new-housing price index follows the price of a constant-quality new home and so excludes resale homes and rents. It is a partial view of housing costs. Because there is no city CPI, nothing here says how fast the cost of living in Hamilton is rising.

    History

    Hamilton's index has changed 7.5% over ten years. Index levels are not comparable between cities because each is set to its own base.

    Across geographies

    Hamilton's index is on its own base, so its level cannot be compared with another city's; only the twelve-month changes in the first paragraph can, and they cover new homes only.

    What it influences

    Not assessed: the sources cited in this section do not link new-home prices in Hamilton to other outcomes, and no measured link is recorded for the city.

    Risks

    Not assessed: the risks that published sources attribute to Hamilton are in the local-economy section of this page; this section holds only the index.

    What to watch

    Statistics Canada's monthly New Housing Price Index release and the Consumer Price Index release (CPI dates are in the calendar).

    Prepared with AI assistance.

    Follow the relationships

    Sources for this section (2 datasets, 0 documents)

    Data

    Each dataset is used under its licence; attribution and series-level detail are in each chart’s “About this data” panel. Limitations: Statistics Canada does not publish a consumer price index for this metropolitan area, so consumer inflation cannot be stated for it; the provincial or national rate would be a different geography. The new housing price index covers new homes (house and land) only and says nothing about resale prices or rents. Each city's index is on its own base, so levels are not comparable between cities.

    3 · Population and growth

    How quickly is Hamilton growing, and where is the growth coming from?

    Hamilton's population grew 1.0% in the year to July 2025; Ontario's grew 0.3% in the more recent four quarters to 1 July 2026

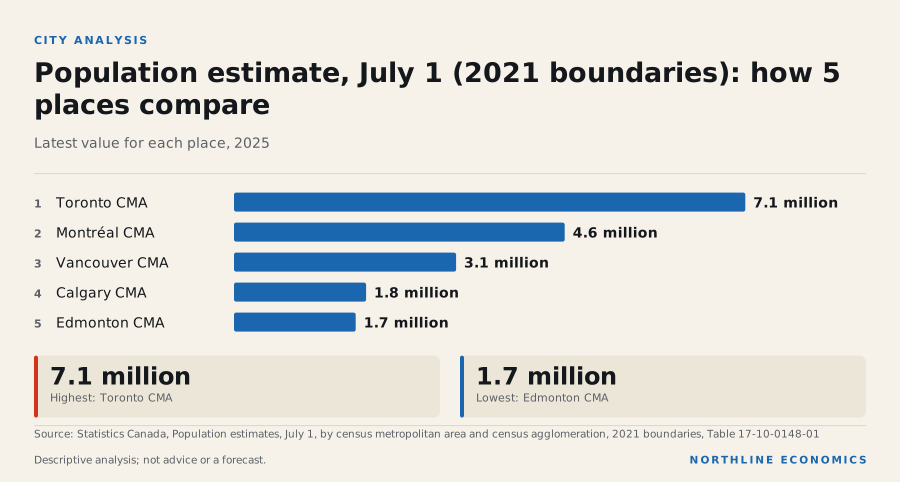
    Graphic: Population estimate, July 1 (2021 boundaries): how 5 places comparePopulation estimate, July 1 (2021 boundaries): how 5 places compare. Toronto CMA 7.1 million; Montréal CMA…

    What happened

    The Hamilton metropolitan area had 871 thousand residents on July 1, 2025, 1.0% more than a year earlier. Over five years it grew 7.3%, against 17.8% in Kitchener–Cambridge–Waterloo, 20.1% in Calgary and 9.5% in Toronto. In the latest year the growth rates were 2.9% in Calgary, 3.1% in Edmonton, 0.0% in Toronto, 0.2% in Vancouver and 0.5% in Montréal. Among the eight smaller metropolitan areas covered here it ranks 3rd of 8 by population.

    Population: eight more metropolitan areas, indexed

    July 1 estimates, 2021 boundaries; start of period = 100.

    Chart loads when it comes into view.

    Latest values: Hamilton CMA 871,100 (2025); Winnipeg CMA 951,800 (2025); Halifax CMA 544,800 (2025); Québec CMA 903,600 (2025); and 4 more in the data table.

    Why it happened

    Historical context

    Statistics Canada reports that from July 1, 2025, to July 1, 2026, national population growth continued to slow to its lowest since 1944/1945, that the number of non-permanent residents fell by the largest annual amount on record with study-permit holders accounting for most of the decline, and that Ontario, Quebec and British Columbia, which receive the largest shares of international migrants, grew slowest among the provinces. That is the national and provincial explanation; it names Ontario, not Hamilton.

    Evidence: Statistics Canada: The Daily: Canada's population estimates, second quarter 2026

    In the demographic year that began in July 2024, the Hamilton metropolitan area recorded 7,921 births and 7,619 deaths, 7,006 immigrants, a net change of -1,695 non-permanent residents, net interprovincial migration of -524 and net intraprovincial migration (movement to and from the rest of the province) of 5,083. The year before, immigrants numbered 7,230 and the net change in non-permanent residents was 9,210. Net non-permanent residents averaged 2,887 a year over the latest five demographic years.

    Where Hamilton's population change came from

    Persons over the twelve months from July 1 of the year shown (so 2024 is July 2024 to June 2025), 2021 boundaries. Net movements: negative = net outflow. Statistics Canada table 17-10-0149-01.

    Chart loads when it comes into view.

    Latest values: Immigrants 7,006 (2024); Net non-permanent residents -1,695 (2024); Net interprovincial migration -524 (2024); Net intraprovincial migration 5,083 (2024).

    Why it matters

    Population growth adds workers and households. A fast-growing metropolitan area can need more housing, schools and services, and it also gains consumers. Over five years Hamilton's growth was 7.3%.

    History

    Over ten years Hamilton's population grew 14.2%, and since 2001 it has grown 26.4%. The components of change are available from 2001.

    Across geographies

    The provincial population grew 0.3% in the four quarters to 1 July 2026; net interprovincial migration for Ontario over the four quarters to Q2 2026 was -18 thousand. The metropolitan area's own net interprovincial migration is among the components above.

    What it influences

    Population growth bears on housing demand, labour supply and public service needs. Those links are national and not measured for the city.

    Risks

    Hypothesis, not established

    The 2026 fall in non-permanent residents could reduce demand for rental and starter housing in cities that host many international students. The metropolitan change in non-permanent residents to June 2025 is among the components above; it does not cover the 2026 fall.

    Evidence: Statistics Canada: The Daily: Canada's population estimates, second quarter 2026

    What to watch

    Statistics Canada's next annual metropolitan population estimates and quarterly provincial estimates.

    Prepared with AI assistance.

    Follow the relationships

    Sources for this section (4 datasets, 1 documents)

    Data

    Documents cited

    Each dataset is used under its licence; attribution and series-level detail are in each chart’s “About this data” panel. Limitations: City population is an annual July 1 estimate on 2021 boundaries and ends a year before the latest provincial figures. Components of change come from a separate table (17-10-0149-01) whose demographic year runs from July 1 to June 30; each is labelled by the year in which that year starts, so the latest covers July 2024 to June 2025. They describe how much each component contributed and do not explain why. Net emigration, returning emigrants and the table's residual are not shown, so the components shown need not add to the total change. The metropolitan estimates are updated once a year; those for 2024-25 were published before Statistics Canada's September 2026 revision of non-permanent resident estimates, which the provincial figures include.

    4 · Housing supply and prices

    Is Hamilton building homes, and what is happening to new-home prices?

    Hamilton's new-home prices changed -4.0% in the twelve months to September 2026, with 6,733 homes under construction and 2,334 started over the twelve months to September 2026

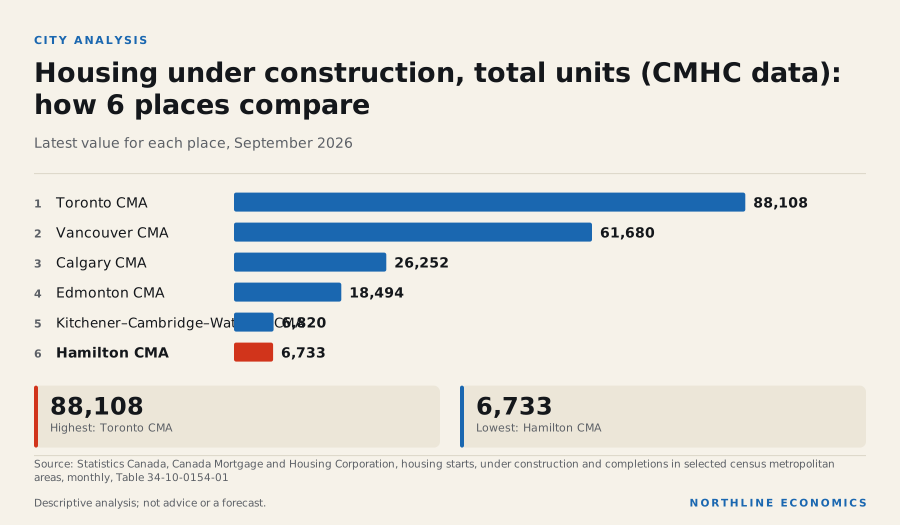
    Graphic: Housing under construction, total units (CMHC data): how 6 places c…Housing under construction, total units (CMHC data): how 6 places compare. Toronto CMA 88,108; Vancouver…

    What happened

    Hamilton started 2,334 homes over the past twelve months and completed 2,456. At the end of September 2026, 6,733 were under construction, -3.7% against a year earlier (Kitchener–Cambridge–Waterloo 6,820, Toronto 88,108, Vancouver 61,680, Calgary 26,252).

    Housing starts (12-month total): Hamilton, other mid-size cities and the six large cities

    Total units started over the previous 12 months; CMHC data distributed by Statistics Canada. Levels differ with city size.

    Chart loads when it comes into view.

    Latest values: Hamilton CMA 2,334 (2026-09); Winnipeg CMA 6,920 (2026-09); Halifax CMA 5,107 (2026-09); Québec CMA 9,293 (2026-09); and 10 more in the data table.

    Housing under construction: Hamilton, other mid-size cities and the six large cities

    Units under construction at month end, total units; CMHC data distributed by Statistics Canada.

    Chart loads when it comes into view.

    Latest values: Hamilton CMA 6,733 (2026-09); Winnipeg CMA 9,615 (2026-09); Halifax CMA 14,570 (2026-09); Québec CMA 11,520 (2026-09); and 10 more in the data table.

    The New Housing Price Index for Hamilton is 106.4, -4.0% on a year ago and -8.9% since February 2022. Kitchener–Cambridge–Waterloo's index changed -2.0% over the year, Vancouver's -2.1% and Toronto's -4.9%. Index levels are not comparable across cities because each is indexed to its own base.

    New housing price index, rebased: Hamilton, other mid-size cities and the six large cities

    Each city is indexed to its own base, so levels are not comparable; start of period = 100.

    Chart loads when it comes into view.

    Latest values: Hamilton CMA 106.4 (2026-09); Winnipeg CMA 148.6 (2026-09); Halifax CMA 128 (2026-09); Québec CMA 144.2 (2026-09); and 10 more in the data table.

    The value of building permits (all types, seasonally adjusted, current dollars) over the twelve months to August 2026 was C$2.2 billion, -14.0% on the twelve months before; the series starts in 2018.

    Value of building permits (12-month total): Hamilton, other mid-size cities and the large cities

    Seasonally adjusted, current dollars, all types of building and work; 12-month total. Ottawa–Gatineau is published only for its Ontario and Quebec parts and is not shown.

    Chart loads when it comes into view.

    Latest values: Hamilton CMA 2.219 (2026-08); Winnipeg CMA 3.714 (2026-08); Halifax CMA 1.769 (2026-08); Québec CMA 3.917 (2026-08); and 9 more in the data table.

    In the October 2025 Rental Market Survey the average rent for a two-bedroom unit in purpose-built rental structures of three or more units in Hamilton was C$1,659 a month, 1.4% higher than a year earlier (CMHC's same-sample figure, for structures surveyed in both years, is 1.6%) and 28.4% higher than five years earlier, ranking 7th of 14 among fourteen cities (highest = 1); the same measure was C$1,908 in Calgary, C$2,045 in Toronto, C$2,364 in Vancouver. The vacancy rate was 3.5%, from 2.4% a year earlier, ranking 6th of 14 among the fourteen (against 4.9% in Calgary, 3.0% in Toronto, 3.7% in Vancouver). The table covers purpose-built rental structures only; condominium, house and basement-suite rentals, and the asking rents on new listings, are not in it.

    Average rent, two-bedroom units: fourteen cities

    Current dollars per month, October survey each year; row and apartment structures of three units and over only (condominium, house and basement-suite rentals are not in this table). CMHC data distributed by Statistics Canada.

    Chart loads when it comes into view.

    Latest values: Hamilton CMA 1,659 (2025); Calgary 1,908 (2025); Edmonton 1,598 (2025); Toronto 2,045 (2025); and 10 more in the data table.

    Rental vacancy rate: fourteen cities

    Percent of units vacant, October survey each year; row and apartment structures of three units and over. CMHC data distributed by Statistics Canada.

    Chart loads when it comes into view.

    Latest values: Hamilton CMA 3.5 (2025); Calgary 4.9 (2025); Edmonton 3.8 (2025); Toronto 3 (2025); and 10 more in the data table.

    Why it happened

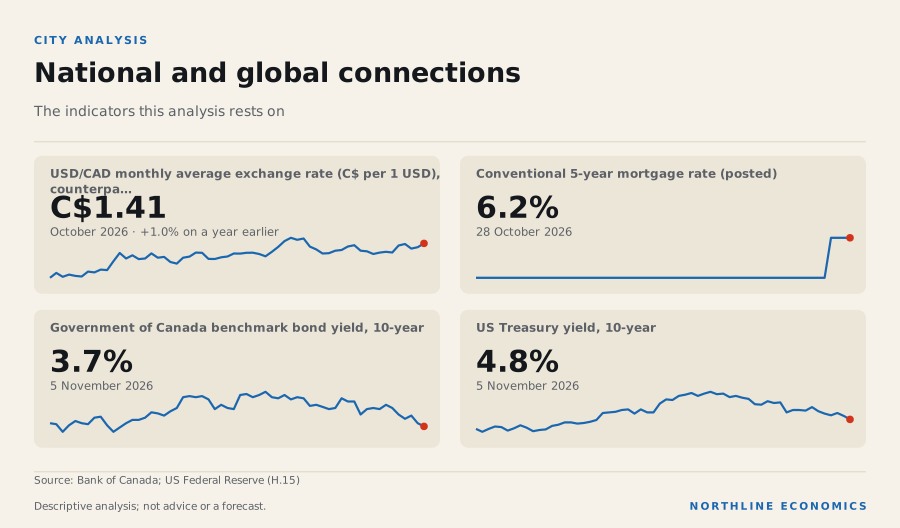
    The data show how much is being built and what is happening to new-home prices; they do not separate demand, land and construction costs, interest rates and incomes. Since January 2026 the posted five-year mortgage rate has gone from 6.09% to 6.19% (week of 28 October 2026) and the posted one-year rate from 5.84% to 5.49%; see the Canada report.

    Interpretation

    CMHC's national assessment is that supply is not keeping up with what is needed for affordability; the data held here cannot say how far that holds for Hamilton specifically.

    Evidence: Canada Mortgage and Housing Corporation: Housing starts and construction data, September 2026; Canada Mortgage and Housing Corporation: Fall 2026 Housing Supply Report

    Why it matters

    Housing is a large household expense. New-home prices are one part of the picture: resale prices are not included, and the rent figures above cover purpose-built rental structures only.

    History

    The monthly peak of units under construction in the past ten years was 7,580 in February 2026, and the lowest was 2,576 in November 2016.

    Housing completions (12-month total): Hamilton, other mid-size cities and the six large cities

    Units completed over the previous 12 months, total units; CMHC data distributed by Statistics Canada.

    Chart loads when it comes into view.

    Latest values: Hamilton CMA 2,456 (2026-09); Winnipeg CMA 5,392 (2026-09); Halifax CMA 3,445 (2026-09); Québec CMA 6,607 (2026-09); and 10 more in the data table.

    Across geographies

    On the comparison with the large cities, units under construction changed over the twelve months to September 2026 by -3.7% in Hamilton, -7.8% in Kitchener–Cambridge–Waterloo, -4.2% in Toronto, -2.3% in Vancouver and 4.0% in Edmonton. Counts depend on city size and are not rates per person.

    What it influences

    The Bank of Canada describes a link between mortgage costs and housing, and CMHC a link between supply and affordability; neither is estimated for Hamilton.

    Risks

    Historical context

    CMHC's deputy chief economist said a key risk for Canada is not building enough during this period of softening housing markets, and that affordability gains since 2023 will be difficult to sustain unless construction rises.

    Evidence: Canada Mortgage and Housing Corporation: Housing starts and construction data, September 2026

    What to watch

    CMHC's monthly starts, Statistics Canada's New Housing Price Index and building permits (release dates in the calendar), and the Bank of Canada's next announcement on 9 December 2026.

    Prepared with AI assistance.

    Follow the relationships

    Sources for this section (7 datasets, 3 documents)

    Data

    Documents cited

    Each dataset is used under its licence; attribution and series-level detail are in each chart’s “About this data” panel. Limitations: Starts, completions and units under construction are CMHC counts for the metropolitan area (all unit types). The New Housing Price Index covers new homes only; resale prices are not included, and rents are the October Rental Market Survey for purpose-built rental structures only. Monthly starts and completions are volatile and are shown as twelve-month sums where compared. Building permit values are in current dollars, seasonally adjusted, and are available from 2018. CMHC's supply-gap estimate is not recorded for this city in the sources held, so none is quoted.

    5.5 · Industry structure (2021 Census)

    What does Hamilton do for a living?

    In the 2021 Census 309 thousand jobs were located in Hamilton; health care and social assistance was the largest sector at 15.8% of jobs

    What happened

    In the 2021 Census, 309 thousand jobs were located in the Hamilton metropolitan area (people who worked at home or had a usual workplace there; people with no fixed workplace address are not in the table). The three largest sectors were Health care and social assistance (15.8% of jobs), Retail trade (12.0%) and Manufacturing (11.5%).

    Measured as its share of jobs divided by the six large metropolitan areas' combined share (among sectors that make up at least one fiftieth of Hamilton's jobs), the sector in which Hamilton stood furthest above them was Manufacturing: 11.5% of its jobs, against 5.1% in Calgary, 6.4% in Edmonton, 9.5% in Toronto, 6.6% in Vancouver, 10.0% in Montréal, 3.4% in Ottawa–Gatineau. The ranking is fixed to these 2021 Census figures.

    Jobs by industry sector in six metropolitan areas, 2021 Census

    Share of jobs located in each metropolitan area (persons who worked at home or had a usual place of work there; people with no fixed workplace address are not in the table), May 2021 reference week, pandemic conditions. Industry structure at one date, not current conditions. Shares are computed by this project from the Census counts.

    Chart loads when it comes into view.

    Top values: Edmonton 6%; Calgary 4.9%; Vancouver 4.2%.

    Why it happened

    Not assessed. The table counts jobs by sector at one date and says nothing about why a metropolitan area has the mix it has. Attributed descriptions of Hamilton's industry structure are in the local-economy section of this page.

    Why it matters

    The industry mix shows what a local economy does for a living, which bears on how it is exposed to changes in demand, prices and policy. It does not measure output, wages or how the economy is performing; those need other tables.

    History

    Not available from this table: the Census is taken every five years and the platform holds only the 2021 reference week (May 2021). Annual industry employment for the metropolitan area comes from the Labour Force Survey and is in the labour section of this page.

    Across geographies

    The metropolitan areas come from one table with one definition, so the shares can be compared with one another. They are not comparable with provincial Labour Force Survey industry shares, which use a different survey, year and definition. Ontario's provincial industry mix is on its province page.

    What it influences

    Not assessed. No relationship in the recorded graph links the metropolitan industry mix to another variable.

    Risks

    Historical context

    The reference week was in May 2021, during public-health restrictions: Statistics Canada named retail trade, accommodation and food services, and information, culture and recreation among the industries most affected, and said working from home remained an important adaptation. The data are more than five years old and cannot show what has changed since.

    Evidence: Statistics Canada: The Daily: Labour Force Survey, May 2021

    What to watch

    The release of 2026 Census results on industry for metropolitan areas. No release date for them is in the calendar this site holds, and none is assumed.

    Prepared with AI assistance.

    Follow the relationships

    Sources for this section (1 datasets, 1 documents)

    Data

    Documents cited

    Each dataset is used under its licence; attribution and series-level detail are in each chart’s “About this data” panel. Limitations: Census jobs are counted by place of work in one reference week in May 2021, during public-health restrictions; people with no fixed workplace address are not in the table. The shares are of jobs located in the area, not of residents' employment, and are not comparable with Labour Force Survey industry shares.

    6 · National and global connections

    How do national and global conditions reach Hamilton?

    Most recorded connections that reach Hamilton are provincial or national: Ontario's exports to the United States were 72% of its goods exports in 2025

    Graphic: National and global connectionsNational and global connections. USD/CAD monthly average exchange rate (C$ per 1 USD), counterpa… C$1.41…

    What happened

    Most recorded connections that reach Hamilton are provincial or national. Ontario's exposure to the United States is 72% of its goods exports in 2025 (total domestic goods exports C$266.0 billion), and energy products are 1% of that total; the national export shares are 72% to the United States and 4.5% to China.

    Oil prices and metropolitan employment are compared in the relationship graph only for Calgary, Edmonton and Toronto; Hamilton is not compared.

    Why it happened

    Not assessed. Trade and investment links that published sources describe for Hamilton are in the local-economy section of this page; no city-level trade data are held.

    Why it matters

    The currency, interest rates and trade partners that matter for Hamilton are covered at national level in the Global report: one US dollar cost C$1.4135 on average in October 2026; Canada's posted five-year mortgage rate is 6.19%, which rose 0.10 percentage points over the past year. On 5 November 2026 the US ten-year Treasury yield was 4.84% and Canada's ten-year yield 3.67%; how much of any move in either reaches Hamilton's housing market is not measured here.

    History

    Not assessed.

    Across geographies

    Interpretation

    Bond yields and the posted five-year mortgage rate tend to move together, which matters for housing; the effect on Hamilton is not measured.

    Evidence: relationship: Government of Canada bond yields and Prime and posted mortgage rates

    What it influences

    Three chains bear on Hamilton: US trade measures to exports and to steel jobs (hypotheses nationally, with sourced provincial statements, and a company statement for Hamilton with no measured size), rates to mortgage costs and housing (documented nationally) and immigration policy to population (documented nationally).

    Risks

    The risks that published sources attribute to this city specifically are in the local-economy section of this page; beyond those, see the national risks in the Canada report and the global risks in the Global report.

    What to watch

    The Bank of Canada's next announcement on 9 December 2026, tariff changes and Statistics Canada's monthly trade release (calendar).

    Prepared with AI assistance.

    Follow the relationships

    Sources for this section (4 datasets, 0 documents)

    Data

    Each dataset is used under its licence; attribution and series-level detail are in each chart’s “About this data” panel. Limitations: Provincial export shares are customs-basis goods only and are assigned to the province of origin. No city-level trade or investment data are held, and no oil-price or other correlation is estimated for this city.

    What is missing

    What this page does not cover

    Stated plainly rather than hidden.

    Data requirements

    Output and wages by industry for the metropolitan area
    Annual employment by industry group (Labour Force Survey, table 14-10-0468-01), the 2021 Census industry mix and total metropolitan GDP (annual, no industry detail) are now ingested. Output by industry for the metropolitan area is not, and no wage series for the metropolitan area is held: the open Statistics Canada wage tables cover provinces and Canada, not metropolitan areas.
    not covered
    Resale prices, rents outside purpose-built rental, and household incomes
    Resale data are licensed. Average rent and vacancy for purpose-built rental structures (CMHC Rental Market Survey) are ingested; condominium, house and basement-suite rents and household income tables for the metropolitan area are not.
    not covered
    Commercial real estate, office and industrial markets
    Proprietary sources; licensing required.
    not covered
    Infrastructure, major projects and public investment
    A project is listed only once its source, status and value have been checked.
    not covered
    Municipal finance and policynot covered
    Method and sources

    How this report is built

    Same pipeline, gates and editorial rules as every other page.

    Every number is a reference to a published, licence-checked series for the same geography (ca.on.cma_hamilton); metropolitan series are never mixed with provincial or national ones. Statistics Canada tables 14-10-0459-01 (labour), 18-10-0004-01 (CPI), 17-10-0148-01 (population), 34-10-0154-01 (starts, completions, under construction; CMHC data), 18-10-0205-01 (new housing price index), 34-10-0292-01 (building permits) and 16-10-0011-01 (manufacturing shipments, six large cities only), 17-10-0149-01 (components of population change), 34-10-0133-01 and 34-10-0130-01 (rents and vacancy, CMHC Rental Market Survey), 36-10-0468-01 (GDP at basic prices) 98-10-0492-01 (2021 Census jobs by industry) and 14-10-0468-01 (annual employment by industry group). Methodology and sources · Editorial policy.