Research · Calgary CMA · Edmonton CMA
Two Canadas in the year to July 2025: Edmonton and Calgary grew fast while Toronto’s population stood still
Six large cities were all growing quickly in 2023 and 2024. In the year to July 2025, Edmonton and Calgary kept growing while Toronto and Vancouver stopped. One flow explains most of the slowdown; moves between and within provinces help explain the gap.
By Northline research deskUpdated 2026-11-0611 min readData to October 2026
The data behind this graphic
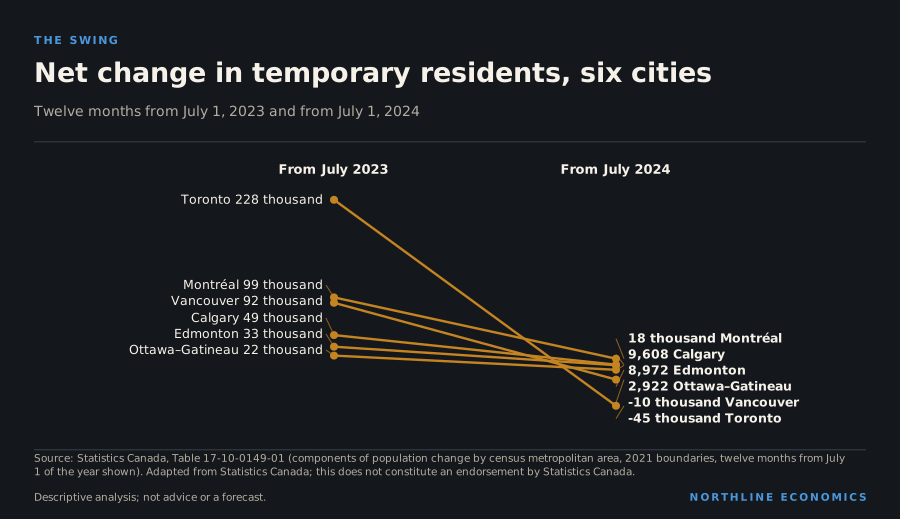
| Item | From July 2023 | From July 2024 |
|---|---|---|
| Toronto | 228 thousand | -45 thousand |
| Montréal | 99 thousand | 18 thousand |
| Vancouver | 92 thousand | -10 thousand |
| Calgary | 49 thousand | 9,608 |
| Edmonton | 33 thousand | 8,972 |
| Ottawa–Gatineau | 22 thousand | 2,922 |
Summary
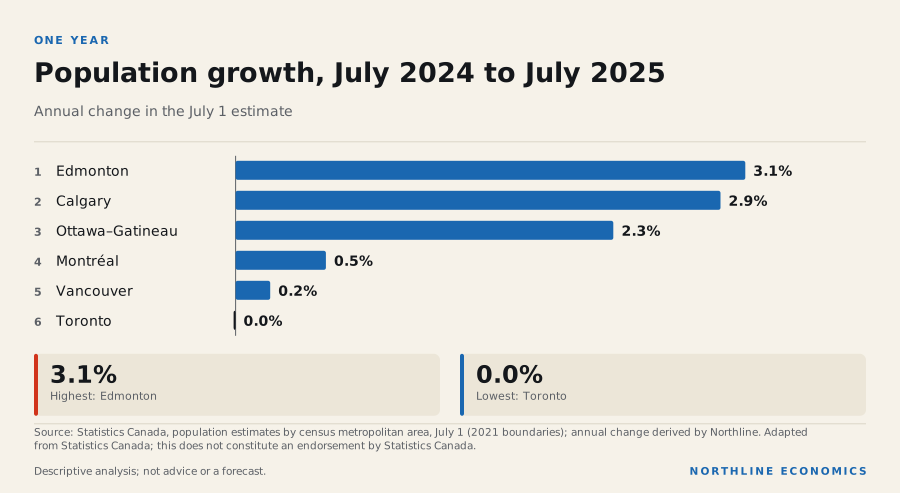
Six large metropolitan areas, one set of estimates, two very different years. In the twelve months to July 2025, Edmonton’s population grew 3.1% and Calgary’s 2.9%. Ottawa–Gatineau’s grew 2.3% and Montréal’s 0.5%. Vancouver’s changed by 0.2% and Toronto’s by 0.0%, essentially nothing. A year before, Toronto’s population had grown 3.9%.
The data behind this graphic
| Item | Value |
|---|---|
| Edmonton | 3.1% |
| Calgary | 2.9% |
| Ottawa–Gatineau | 2.3% |
| Montréal | 0.5% |
| Vancouver | 0.2% |
| Toronto | 0.0% |
A city of about 7.1 million people does not stand still because births and deaths changed. It stands still because other flows reversed. This note takes the components apart.
A surge, and then a stop
The data behind this graphic
| Series | Latest |
|---|---|
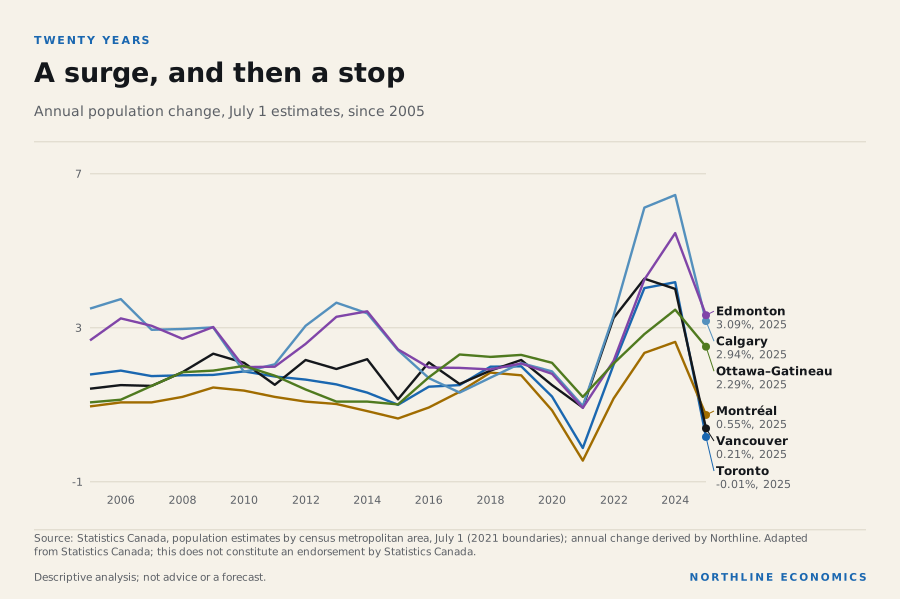
| Toronto | -0.01%, 2025 |
| Montréal | 0.55%, 2025 |
| Vancouver | 0.21%, 2025 |
| Calgary | 2.94%, 2025 |
| Edmonton | 3.09%, 2025 |
| Ottawa–Gatineau | 2.29%, 2025 |
The chart shows annual growth rates since 2005. Growth in the six areas was modest for most of those years, and fell in 2021 in Toronto and Montréal during the pandemic. Then it rose together. Calgary’s growth peaked at 6.15% in the year to July 2024, Edmonton’s at 5.18%, Toronto’s at 3.93% and Vancouver’s, in the year to July 2023, at 4.02%. Each is the highest annual rate in the last twenty years for that city.
The latest year breaks the pattern. All six slowed. The slowdown was close to complete in Toronto and Vancouver, severe in Montréal, and partial in Calgary, Edmonton and Ottawa–Gatineau.
What changed: temporary residents
Population estimates are built from components. Births add and deaths subtract. Immigrants arrive. People move between provinces and, within a province, between cities. And a group that has grown in importance in recent years, non-permanent residents, students and workers on temporary permits, is counted as the net of arrivals and departures.
The data behind this graphic
| Step | What happens |
|---|---|
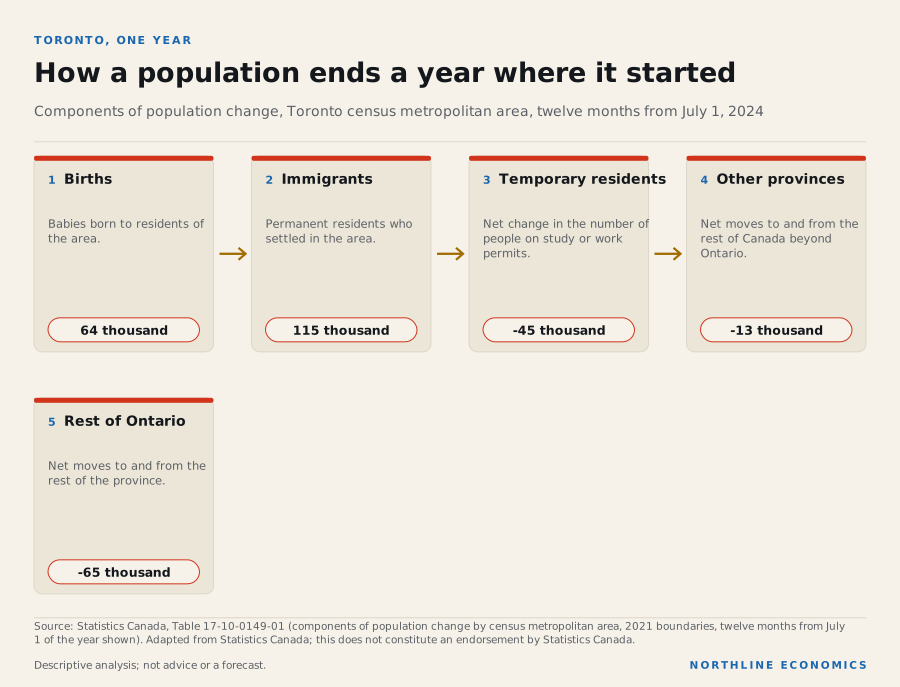
| Births | Babies born to residents of the area. |
| Immigrants | Permanent residents who settled in the area. |
| Temporary residents | Net change in the number of people on study or work permits. |
| Other provinces | Net moves to and from the rest of Canada beyond Ontario. |
| Rest of Ontario | Net moves to and from the rest of the province. |
For Toronto in the twelve months from July 2024, births were 64 thousand and deaths 41 thousand, so natural increase was positive and small. Immigrants added 115 thousand. Net moves to other provinces took 13 thousand and net moves to the rest of Ontario, the largest outflow, took 65 thousand. And the net change in temporary residents was -45 thousand: more of them left, or ceased to be counted, than arrived. In the twelve months before, that number had been 228 thousand.
A swing from 228 thousand to -45 thousand in one component, set against immigrants of 115 thousand and net losses to the rest of Ontario and to other provinces, is enough to take a city from growth of 3.9% to 0.0%. This is the arithmetic of the headline, and it is not a story about births, deaths or a sudden desire of residents to leave.
The same pattern appears in the other cities, differing in size. The hero graphic at the top of this note shows every city’s net change in temporary residents in the two years: Vancouver went from 92 thousand to -10 thousand, Montréal from 99 thousand to 18 thousand, Calgary from 49 thousand to 9,608 and Edmonton from 33 thousand to 8,972. In each, the net change fell; in Toronto and Vancouver it turned negative.
That the fall was so large and so common in one component, within a year, suggests that the cause lies in a policy and a rule, not in each city’s own economy. These data cannot attribute the fall to any specific measure, and Northline does not claim to do so.
Why Calgary and Edmonton kept growing
Two further components separate the Alberta cities from Toronto and Vancouver.
The data behind this graphic
| Item | Value |
|---|---|
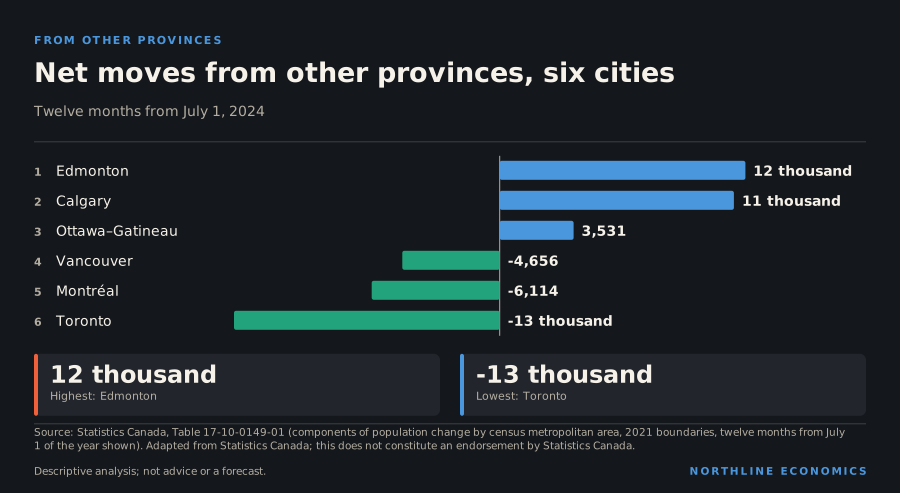
| Edmonton | 12 thousand |
| Calgary | 11 thousand |
| Ottawa–Gatineau | 3,531 |
| Vancouver | -4,656 |
| Montréal | -6,114 |
| Toronto | -13 thousand |
The first is moves from other provinces. In the twelve months from July 2024 Edmonton’s net gain from other provinces was 12 thousand and Calgary’s 11 thousand. Ottawa–Gatineau gained 3,531. Toronto, Montréal and Vancouver lost 13 thousand, 6,114 and 4,656. A person who leaves Toronto for Calgary appears twice in the data, as a loss and as a gain, which is why these figures sum to zero across the country.
The second is the scale of temporary-resident losses. The Alberta cities’ net change in temporary residents stayed positive, 9,608 in Calgary and 8,972 in Edmonton, as did Montréal’s and Ottawa–Gatineau’s, while Toronto’s and Vancouver’s turned negative.
The data behind this graphic
| Item | Value |
|---|---|
| Toronto | 115 thousand |
| Vancouver | 42 thousand |
| Montréal | 38 thousand |
| Calgary | 29 thousand |
| Ottawa–Gatineau | 26 thousand |
| Edmonton | 22 thousand |
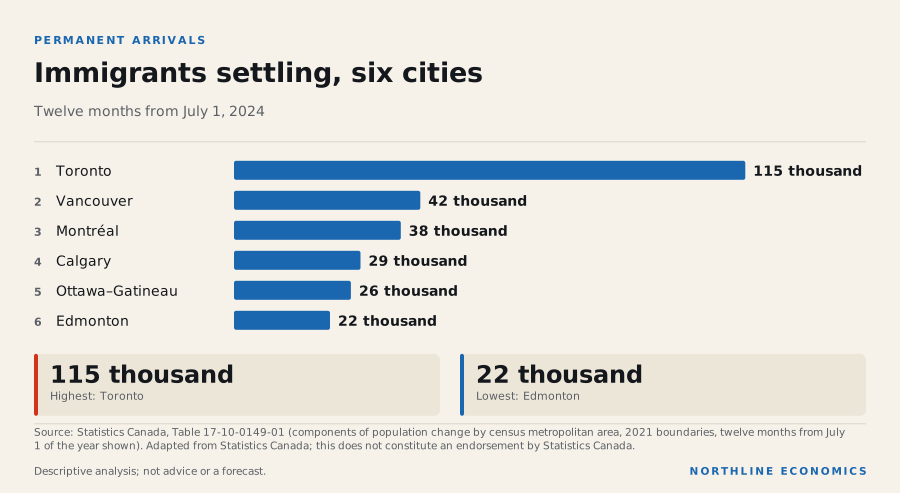
Immigrants matter in every city, and everywhere but Montréal they are the largest single component. Toronto received 115 thousand, Vancouver 42 thousand, Montréal 38 thousand, Calgary 29 thousand, Ottawa–Gatineau 26 thousand and Edmonton 22 thousand. Permanent arrivals alone do not explain the difference between the cities, since all six receive them. What sets the Alberta cities apart from Toronto and Vancouver is the combination of those arrivals with gains from other provinces and temporary-resident flows that stayed positive.
The labour market beside it
The data behind this graphic
| Series | Latest |
|---|---|
| Toronto | 7.10%, October 2026 |
| Montréal | 6.90%, October 2026 |
| Vancouver | 6.70%, October 2026 |
| Calgary | 6.60%, October 2026 |
| Edmonton | 7.10%, October 2026 |
| Ottawa–Gatineau | 7.10%, October 2026 |
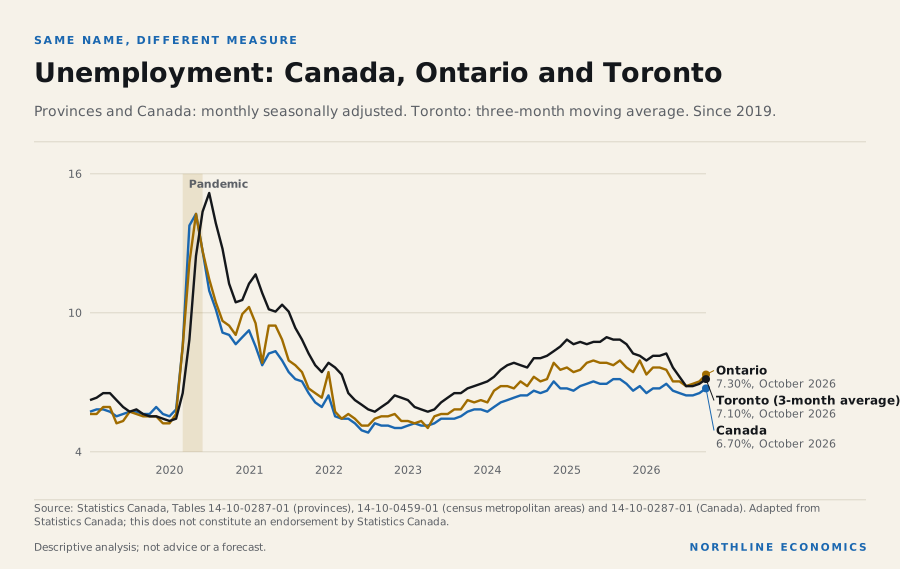
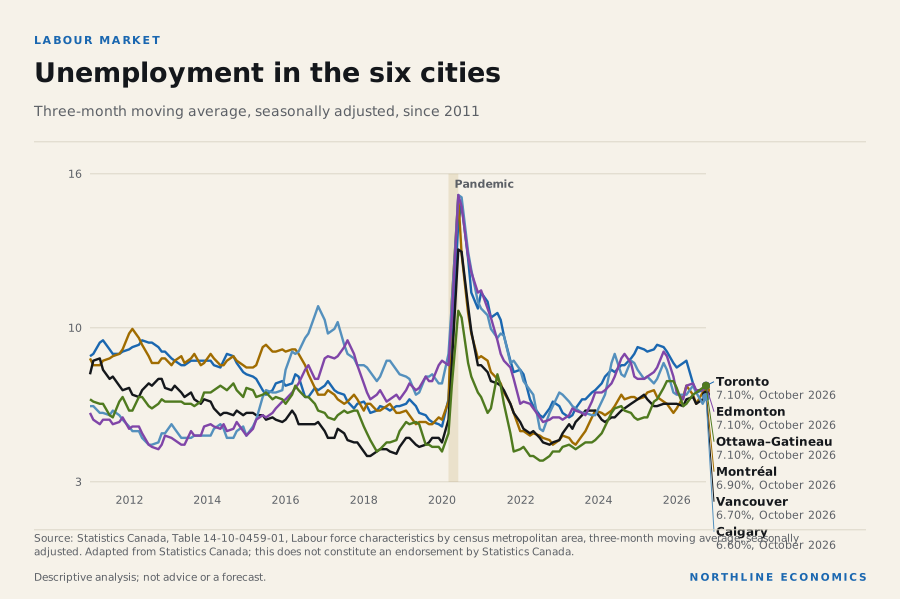
Faster growth does not mean a tighter labour market. In October 2026 the three-month average unemployment rate was 6.6% in Calgary, 7.1% in Edmonton and 7.1% in Toronto, 6.7% in Vancouver, 6.9% in Montréal and 7.1% in Ottawa–Gatineau. A year earlier the rates were 7.8% in Calgary, 8.4% in Edmonton, 8.6% in Toronto, 6.3% in Vancouver, 6.3% in Montréal and 7.3% in Ottawa–Gatineau.
Fast growth and a high unemployment rate can coexist, because new residents add to the labour force before they find work, and the reverse can occur when a city’s population falls and unemployment falls with it. A falling rate in a city whose population has stopped growing is not necessarily a sign of stronger demand for workers. The provincial note, Ten provincial labour markets, explains the same problem at provincial scale.
Supply: what builders did
The data behind this graphic
| Panel | Shows |
|---|---|
| Toronto | timeline |
| Montréal | timeline |
| Vancouver | timeline |
| Calgary | timeline |
| Edmonton | timeline |
| Ottawa–Gatineau | timeline |
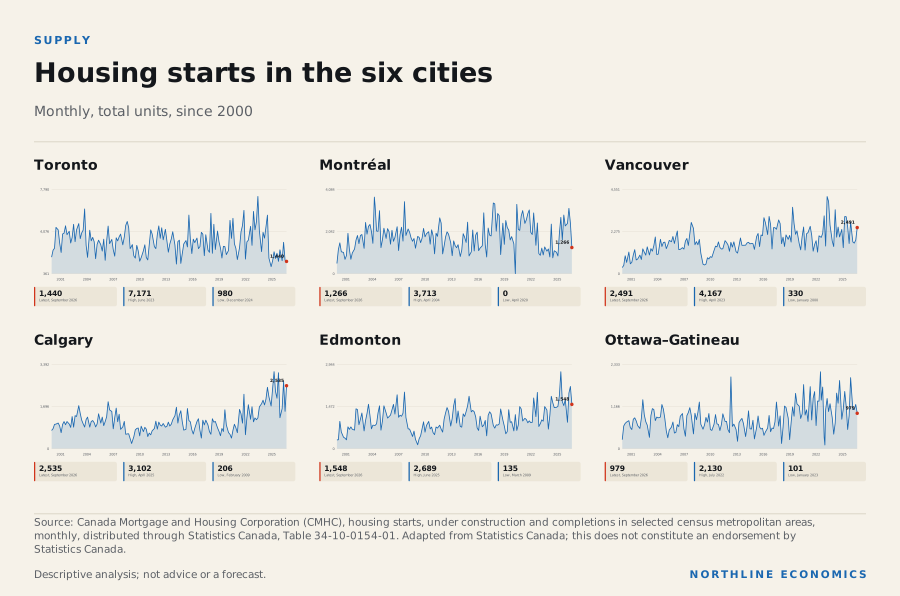
Housing starts show how much new supply builders began. Over the latest twelve months Montréal recorded 27,474, Vancouver 26,601, Calgary 24,403, Toronto 23,355, Edmonton 19,055 and Ottawa–Gatineau 14,228 units. The twelve-month totals before that were different in several cities: Ottawa–Gatineau and Montréal started more in the latest twelve months than in the twelve before, while Toronto, Vancouver, Calgary and Edmonton started fewer.
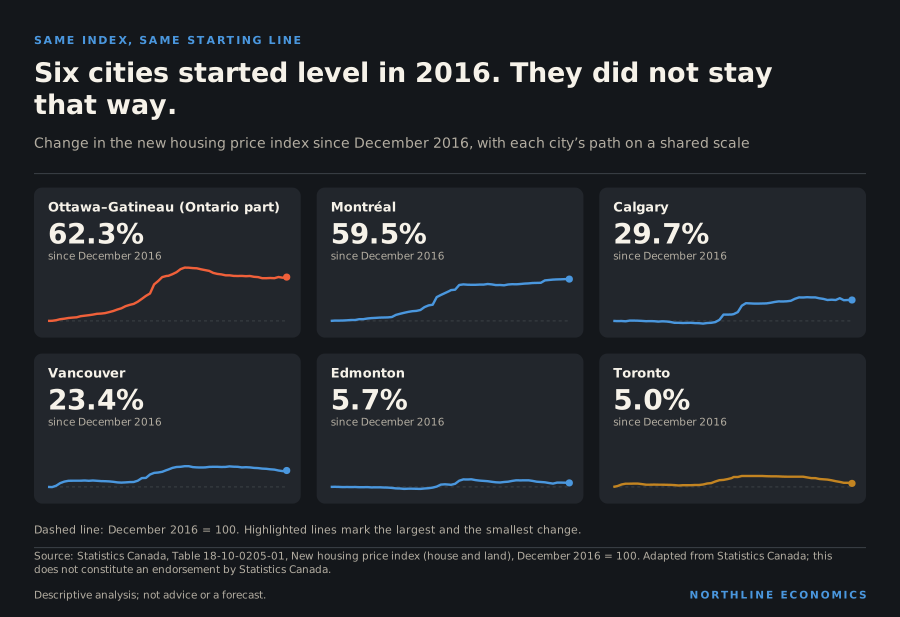
The totals do not scale to the cities’ populations, and starts are only one part of supply. What they do show is that population growth and construction move on different timetables: a unit started today is completed in a year or more, while the flows of people can change in a quarter. The housing note, New-home prices in six cities, takes up prices.
Three things that look wrong and are not
Zero growth is not zero movement. Toronto’s flat population is the net of large flows in both directions: immigrants and births in, temporary residents and people leaving for the rest of Ontario and for other provinces out.
A city can lose to other provinces and still grow. Moves between provinces are one component. Vancouver and Montréal lost to other provinces and also had weak total growth, while Ottawa–Gatineau gained from other provinces and grew faster.
Growth rates and levels are different things. A city with a small population needs fewer arrivals to grow quickly. Edmonton’s and Calgary’s rates are not high only because their base is smaller: in the year to July 2025 Calgary added 52 thousand people and Edmonton 51 thousand, while Toronto’s population changed by -992.
What this means for decisions
For municipal planners, the speed at which a flow can reverse is a planning fact. Schools, transit and water systems are built on a horizon of years, but the temporary-resident component changed sign in a year.
For businesses that serve local demand, the relevant question is which component their customers belong to. Students and temporary workers may rent and spend differently from permanent residents and from households that move between provinces.
For landlords, lenders and investors, population growth is a driver of housing demand, and a sudden stop is a risk to local rents and prices. This note does not measure that link and does not offer investment advice.
What this does not show
Six metropolitan areas are not a census of Canadian cities. Estimates are made as of July 1 on 2021 boundaries and are revised. Components of change are estimated and may not sum exactly to the change in population. Population change is not a measure of economic strength. The notes above describe what the numbers show and do not attribute them to any specific policy or event.
Where to read next
Three ways to grow or shrink follows the same flows at provincial scale and for fourteen cities. New-home prices in six cities compares prices. Open the place comparison to see these six areas side by side, with each series dated and the missing ones listed.
Method
Growth rates are the annual percentage change in Statistics Canada’s July 1 population estimates for the 2021 census-metropolitan-area boundaries, derived by Northline from the parent series. Components are the twelve months from July 1 of the year shown (so the year 2024 in the data covers July 2024 to June 2025). Housing starts are CMHC data distributed through Statistics Canada. Source: Adapted from Statistics Canada tables. This does not constitute an endorsement by Statistics Canada.
Keep exploring
- All city dashboards
- Compare these places
- Three ways to grow or shrink: the flows behind each province’s population
- Same index, different cities: how new-home prices diverged after 2016
- Ten provincial labour markets: who is tight, who is slack, and what the rate hides
Related research
Sources, method and limits
- Limitations
- Six metropolitan areas only, not all Canadian cities. July 1 estimates on 2021 census-metropolitan boundaries. Population change is not a measure of economic strength. Growth rates are not compared with levels.
- Preparation
- Prepared by the Northline research desk with AI assistance; every figure is read from the data library or a cited source at build time.
Data
- Population estimates, July 1, by census metropolitan area and census agglomeration, 2021 boundaries (17-10-0148-01; 9 series; latest 2025; retrieved 2026-10-23). Adapted from Statistics Canada, Population estimates, July 1, by census metropolitan area and census agglomeration, 2021 boundaries, Table 17-10-0148-01. This does not constitute an endorsement by Statistics Canada.
- Components of population change by census metropolitan area and census agglomeration, 2021 boundaries (17-10-0149-01; 20 series; latest 2024; retrieved 2026-10-25). Adapted from Statistics Canada, Components of population change by census metropolitan area and census agglomeration, 2021 boundaries, Table 17-10-0149-01. This does not constitute an endorsement by Statistics Canada.
- Labour force characteristics by census metropolitan area, three-month moving average, seasonally adjusted (14-10-0459-01; 6 series; latest October 2026; retrieved 2026-11-07). Adapted from Statistics Canada, Labour force characteristics by census metropolitan area, three-month moving average, seasonally adjusted, Table 14-10-0459-01. This does not constitute an endorsement by Statistics Canada.
- Canada Mortgage and Housing Corporation, housing starts, under construction and completions in selected census metropolitan areas, monthly (34-10-0154-01; 6 series; latest September 2026; retrieved 2026-10-23). Adapted from Statistics Canada, Canada Mortgage and Housing Corporation, housing starts, under construction and completions in selected census metropolitan areas, monthly, Table 34-10-0154-01. This does not constitute an endorsement by Statistics Canada.
Documents
- Statistics Canada, Table 17-10-0148-01, Population estimates, July 1, by census metropolitan area (2021 boundaries) (retrieved 2026-10-22)
- Canada Mortgage and Housing Corporation, Housing starts, completions and under construction by census metropolitan area (retrieved 2026-10-22)
Approved by an editor on 2026-11-09; published 2026-11-09. See the corrections log.