Research · Calgary CMA · Edmonton CMA
Same index, different cities: how new-home prices diverged after 2016
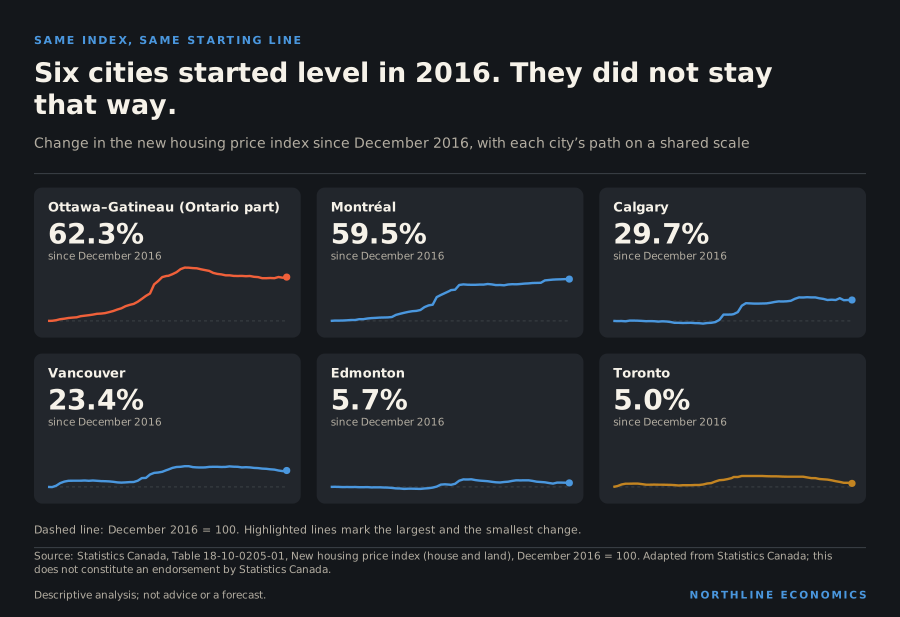
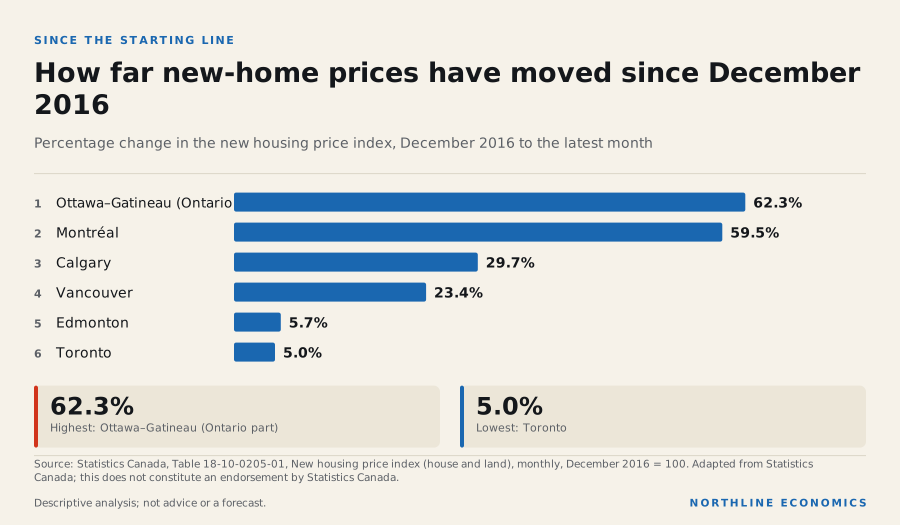
Statistics Canada starts every city’s new-home price index at 100 in December 2016. Nearly ten years on, two cities are up by more than half and two have barely moved.
By Northline research deskUpdated 2026-11-0613 min readData to 28 October 2026
The data behind this graphic
| Item | Change |
|---|---|
| Ottawa–Gatineau (Ontario part) | 62.3% |
| Montréal | 59.5% |
| Calgary | 29.7% |
| Vancouver | 23.4% |
| Edmonton | 5.7% |
| Toronto | 5.0% |
The most-compared number, compared badly
Housing affordability is a much-discussed economic question in Canadian cities, and it is often compared badly. A price in dollars means different things in a small market and a large one, and an average sale price moves with the mix of homes that happen to sell. Statistics Canada’s new housing price index avoids both problems. It measures changes in builders’ selling prices for new houses whose detailed specifications stay the same from one month to the next, and it sets every city to 100 in December 2016.
That shared starting line is what makes this chart possible. Six cities begin at the same point. The question is how far apart they are now.
The answer is: very far
By September 2026, the index stood at 162.3 in the Ontario part of Ottawa–Gatineau, 159.5 in Montréal, 129.7 in Calgary, 123.4 in Vancouver, 105.7 in Edmonton and 105.0 in Toronto. Read as percentage changes since December 2016, that is a spread from 5.0% in Toronto to 62.3% in the Ontario part of Ottawa–Gatineau.
The data behind this graphic
| Item | Value |
|---|---|
| Ottawa–Gatineau (Ontario part) | 62.3% |
| Montréal | 59.5% |
| Calgary | 29.7% |
| Vancouver | 23.4% |
| Edmonton | 5.7% |
| Toronto | 5.0% |
Two things stand out. The first is the range itself: a gap of nearly sixty percentage points between the highest and lowest city in less than ten years. The second is who is where. By this measure, new-home prices in Toronto and Vancouver have risen less since 2016 than those in Montréal and the Ontario part of Ottawa–Gatineau.
That does not mean housing is cheaper in Montréal than in Toronto, or that it is becoming more affordable in Toronto. The index starts every city at the same value, so it says nothing about the level of prices, only about how they have changed. A city that began the period very expensive can rise less in percentage terms and still be far more expensive than one that began cheaply.
A path, not a point
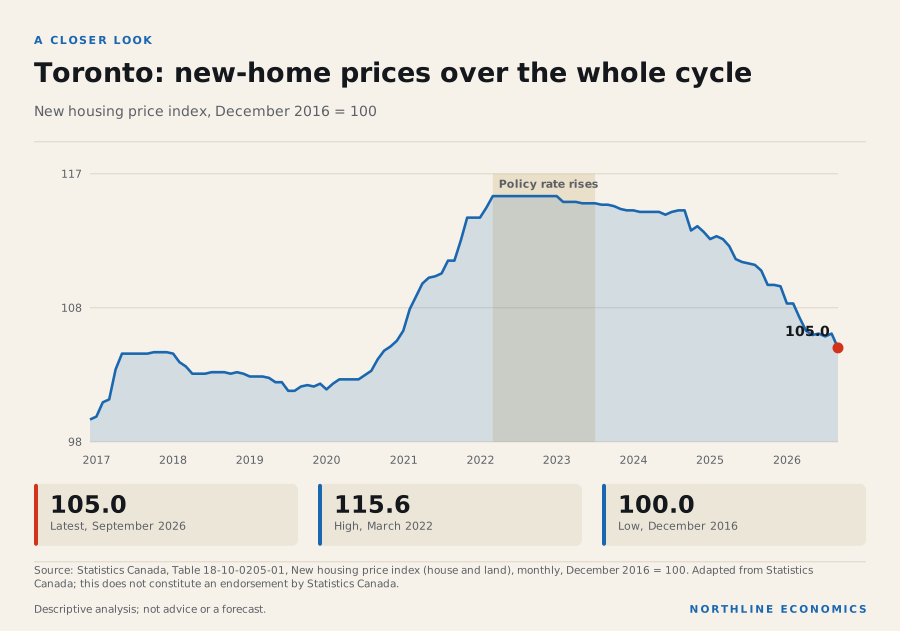
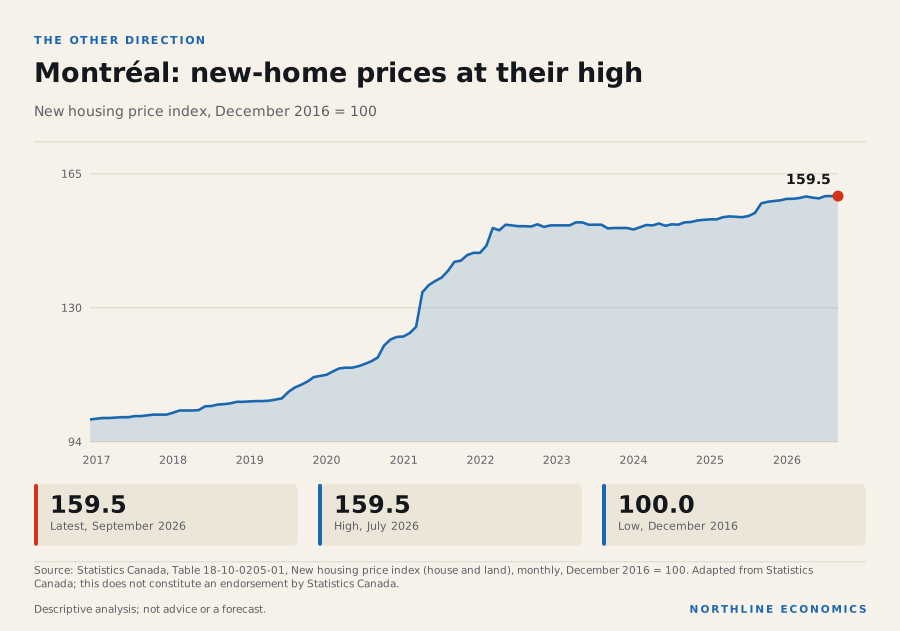
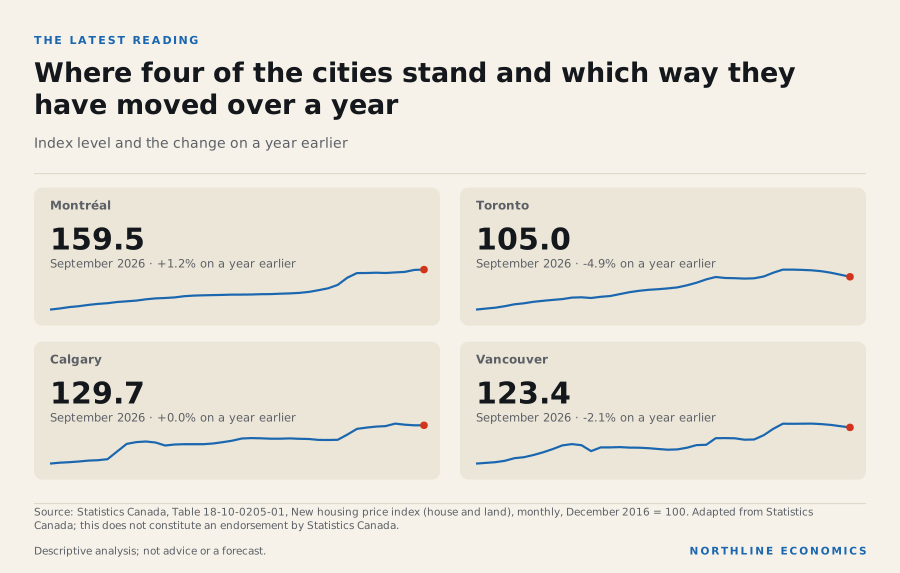
Where a city ends up depends on how it got there. The panels below follow two of the six.
The data behind this graphic
| Period | Value |
|---|---|
| 2026-09 | 105 |
| 2026-08 | 106 |
| 2026-07 | 105.8 |
| 2026-06 | 106 |
| 2026-05 | 105.9 |
| 2026-04 | 106.2 |
| 2026-03 | 107.1 |
| 2026-02 | 108.1 |
| 2026-01 | 108.1 |
| 2025-12 | 109.3 |
| 2025-11 | 109.4 |
| 2025-10 | 109.4 |
| 2025-09 | 110.4 |
| 2025-08 | 110.8 |
| 2025-07 | 110.9 |
| 2025-06 | 111 |
| 2025-05 | 111.2 |
| 2025-04 | 112.1 |
| 2025-03 | 112.6 |
| 2025-02 | 112.8 |
| 2025-01 | 112.6 |
| 2024-12 | 113.1 |
| 2024-11 | 113.5 |
| 2024-10 | 113.2 |
Toronto reached its high of 115.6 in March 2022, in the same month the policy rate began rising, held there until January 2023 and has since fallen back. Over the last twelve months the index has changed by -4.9%. Whether the decline reflects higher borrowing costs, weaker demand, more supply or some combination is not something an index of prices can say; the companion note on how interest rates reach households sets out the timing of the rate cycle.
The data behind this graphic
| Period | Value |
|---|---|
| 2026-09 | 159.5 |
| 2026-08 | 159.5 |
| 2026-07 | 159.5 |
| 2026-06 | 158.9 |
| 2026-05 | 159.1 |
| 2026-04 | 159.4 |
| 2026-03 | 159 |
| 2026-02 | 158.8 |
| 2026-01 | 158.8 |
| 2025-12 | 158.4 |
| 2025-11 | 158.2 |
| 2025-10 | 158 |
| 2025-09 | 157.6 |
| 2025-08 | 155 |
| 2025-07 | 154.2 |
| 2025-06 | 153.9 |
| 2025-05 | 154 |
| 2025-04 | 154.1 |
| 2025-03 | 153.9 |
| 2025-02 | 153.3 |
| 2025-01 | 153.3 |
| 2024-12 | 153.2 |
| 2024-11 | 153 |
| 2024-10 | 152.6 |
Montréal’s path looks different. Its index is at 159.5, which is its highest level in the last ten years of data (July 2026), and it has risen 1.2% over the last twelve months. There is no visible reversal in this series during the rate rises.
Different cities, different cycles
The six cities do not move in lockstep, and their peaks arrived at different times. Calgary’s new-home prices peaked in February 2025 at 133.8 and have since eased; Vancouver’s peaked in July 2022 at 129.4; Edmonton’s peaked in June 2022 at only 110.8. The peak in the Ontario part of Ottawa–Gatineau, 175.9, was in October 2022.
The data behind this graphic
| Item | January 2021 | Latest |
|---|---|---|
| Ottawa–Gatineau (Ontario part) | 137.9 | 162.3 |
| Montréal | 122.1 | 159.5 |
| Calgary | 97.6 | 129.7 |
| Vancouver | 113.1 | 123.4 |
| Edmonton | 98.3 | 105.7 |
| Toronto | 106.2 | 105.0 |
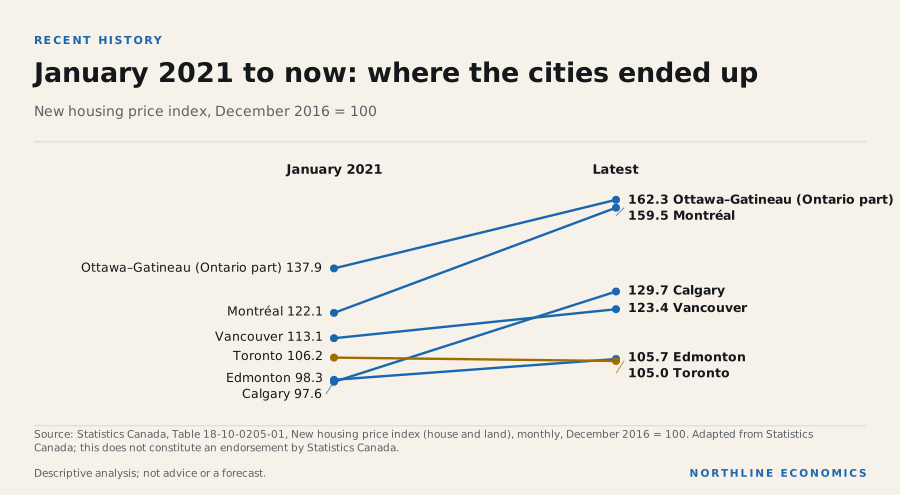
Starting the clock in January 2021 changes the picture again. Over that shorter span, Toronto’s index has fallen (-1.1% since January 2021), while Montréal’s has risen 30.6% and Calgary’s 32.9%. Which start date is the right one depends on the question, which is why a single before-and-after number deserves suspicion.
The data behind this graphic
| Indicator | Place | Latest | Period | Change |
|---|---|---|---|---|
| Montréal | Montréal CMA | 159.5 | September 2026 | +1.2% on a year earlier |
| Toronto | Toronto CMA | 105.0 | September 2026 | -4.9% on a year earlier |
| Calgary | Calgary CMA | 129.7 | September 2026 | +0.0% on a year earlier |
| Vancouver | Vancouver CMA | 123.4 | September 2026 | -2.1% on a year earlier |
What might explain the differences, and what the data cannot
Several things plausibly sit behind the divergence: how much new housing was built in each city, how fast incomes and population grew, how sensitive local buyers are to borrowing costs, and where each city’s market started in 2016. An index of new-home prices cannot separate those influences. Northline’s housing and population series can help with some of them; the city dashboards put starts, population and prices side by side, and the comparison tool lets you test a hypothesis against the data rather than a headline.
One careful reading is that the cities that were most expensive in 2016 had less room to rise in percentage terms, and that cities where prices started lower and demand grew had more. The index is consistent with that story, but it does not prove it, and two neighbouring Alberta cities, Calgary and Edmonton, ended up far apart.
Beyond the big six
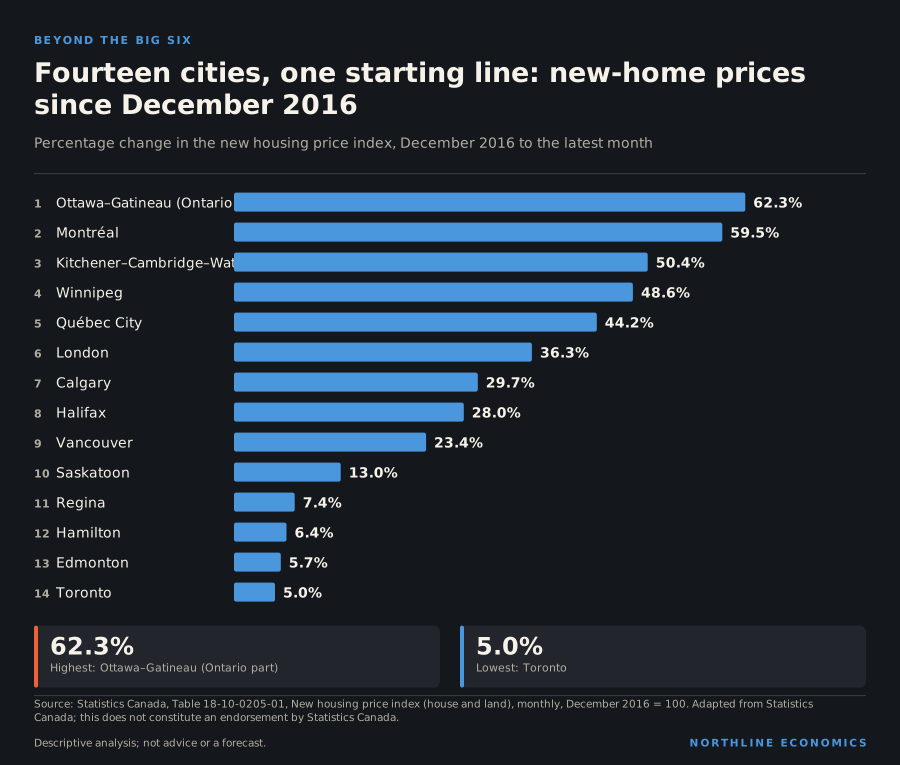
Six cities are an unrepresentative sample of a country with dozens of urban markets. Statistics Canada publishes the same index, on the same December 2016 base, for other metropolitan areas too. This note adds eight more, and all eight fall inside the range of the first six.
The data behind this graphic
| Item | Value |
|---|---|
| Ottawa–Gatineau (Ontario part) | 62.3% |
| Montréal | 59.5% |
| Kitchener–Cambridge–Waterloo | 50.4% |
| Winnipeg | 48.6% |
| Québec City | 44.2% |
| London | 36.3% |
| Calgary | 29.7% |
| Halifax | 28.0% |
| Vancouver | 23.4% |
| Saskatoon | 13.0% |
| Regina | 7.4% |
| Hamilton | 6.4% |
| Edmonton | 5.7% |
| Toronto | 5.0% |
At the top of the list, the Ontario part of Ottawa–Gatineau is up 62.3% and Montréal 59.5%, followed by Kitchener–Cambridge–Waterloo at 50.4%, Winnipeg at 48.6% and Québec City at 44.2%. London is up 36.3%. At the bottom, Regina is up 7.4%, Hamilton only 6.4% and Edmonton 5.7%, with Toronto at 5.0%.
The Kitchener and Hamilton comparison is the most striking. They are both mid-sized southern Ontario cities within a short drive of Toronto, and from the same starting line they ended up 50.4% and 6.4% higher. Whatever drove the divergence between six cities also operates inside a single region. That is a warning against reading a provincial or even a regional average as a statement about any one city.
Prices, rates and the long run
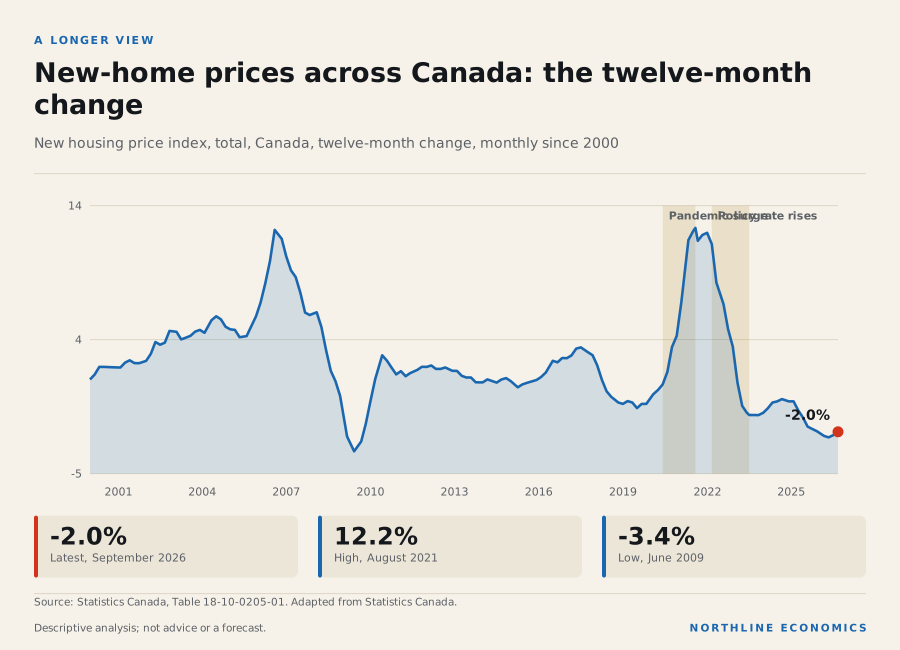
The twelve-month change in new-home prices nationally was -2.0% in the latest month. That is a decline, and among the deepest readings of the last thirty years: the lowest reading was -3.4% in June 2009 and the highest was 12.2% in August 2021.
The data behind this graphic
| Period | Value |
|---|---|
| 2026-09 | -2.04 |
| 2026-07 | -2.27 |
| 2026-05 | -2.43 |
| 2026-03 | -2.33 |
| 2025-12 | -2.01 |
| 2025-10 | -1.85 |
| 2025-08 | -1.68 |
| 2025-06 | -1.04 |
| 2025-04 | -0.56 |
| 2025-02 | 0.08 |
| 2024-12 | 0.08 |
| 2024-09 | 0.24 |
| 2024-07 | 0.08 |
| 2024-05 | 0 |
| 2024-03 | -0.4 |
| 2024-01 | -0.72 |
| 2023-11 | -0.88 |
| 2023-08 | -0.87 |
| 2023-07 | -0.87 |
| 2023-06 | -0.71 |
| 2023-04 | -0.24 |
| 2023-02 | 1.38 |
| 2022-12 | 3.89 |
| 2022-10 | 5.1 |
The surge of 2021 and early 2022 is the highest, narrowly above 2006: in both, prices were rising by more than ten per cent a year. Across the longer record, the national index is up 110.1% since January 2000.
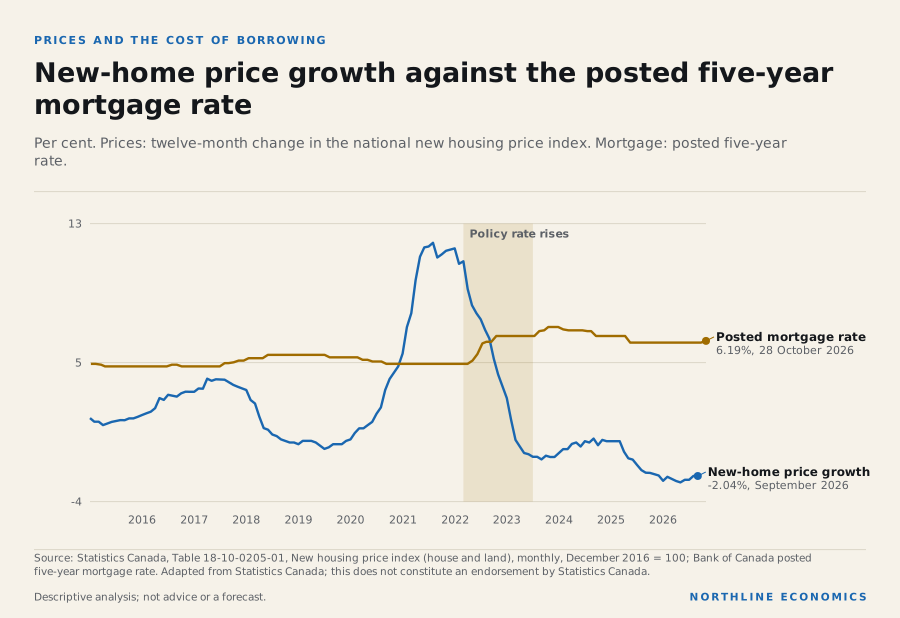
How do prices relate to borrowing costs? The next chart puts the twelve-month change in prices on the same axis as the posted five-year mortgage rate, both in per cent.
The data behind this graphic
| Series | Latest |
|---|---|
| New-home price growth | -2.04%, September 2026 |
| Posted mortgage rate | 6.19%, 28 October 2026 |
The mortgage rate rose from low levels to a high of 7.04% on 4 October 2023, while price growth moved from strongly positive to negative. The two lines move in opposite directions during the rate-rise period. That is consistent with rising borrowing costs weighing on prices, but it is not proof of it: the surge in prices in 2021 came before the rate rises, and the correction began before the rates peaked.
A cautious reading is that rising borrowing costs are one of several forces acting on new-home prices at that time, alongside the unwinding of the pandemic surge and changes in demand. The companion note, How a Bank of Canada decision reaches your mortgage, sets out why the transmission is gradual.
What the supply side shows
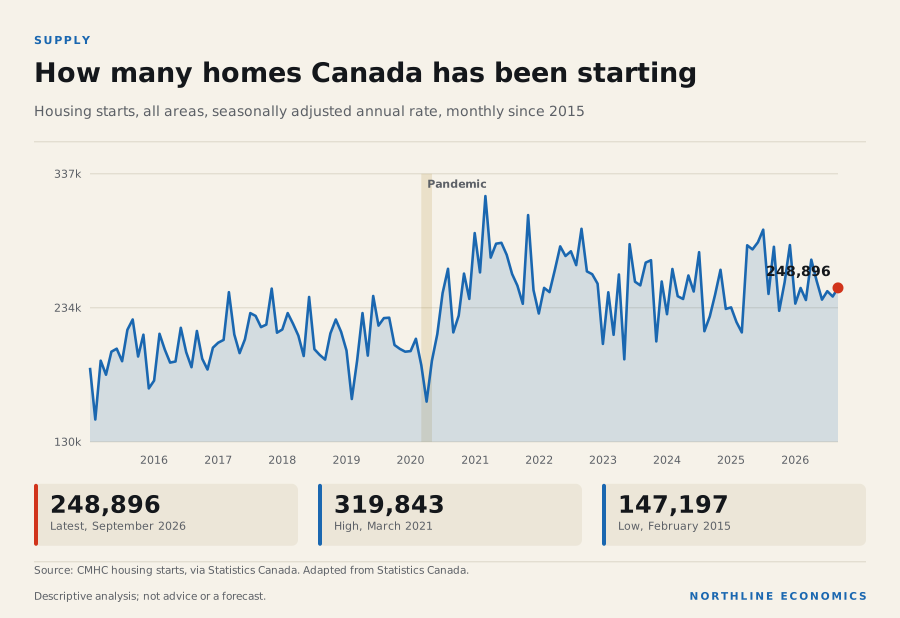
Prices are half of the story. The other half is how many homes are being started.
The data behind this graphic
| Period | Value |
|---|---|
| 2026-09 | 248896 |
| 2026-08 | 242223 |
| 2026-07 | 246341 |
| 2026-06 | 239838 |
| 2026-05 | 254477 |
| 2026-04 | 270692 |
| 2026-03 | 239571 |
| 2026-02 | 248831 |
| 2026-01 | 236778 |
| 2025-12 | 282023 |
| 2025-11 | 253191 |
| 2025-10 | 231239 |
| 2025-09 | 280669 |
| 2025-08 | 244294 |
| 2025-07 | 293877 |
| 2025-06 | 284165 |
| 2025-05 | 278701 |
| 2025-04 | 281826 |
| 2025-03 | 214494 |
| 2025-02 | 222448 |
| 2025-01 | 233830 |
| 2024-12 | 232639 |
| 2024-11 | 262930 |
| 2024-10 | 243732 |
National housing starts stood at 248,896 a year in September 2026. They reached 319,843 in March 2021, the highest in the last ten years of data, and fell as low as 161,004 in April 2020 at the start of the pandemic. The level in early 2015 was 187,115.
Starts and prices do not move in lockstep. The highest starts in this window came in the same period as the price surge of 2021, and starts have since eased while prices have fallen back.
That pattern is consistent with a supply response to high prices, but it is also consistent with other explanations, such as policy support for construction and low interest rates in 2020 and 2021. The data here cannot separate them.
What the new-home index leaves out
The index tracks new homes of constant quality, house and land together. It covers new single homes, semi-detached homes and townhomes, and excludes custom-built houses. It does not cover resale homes, and it does not cover condominiums or rents. A city where new-home prices have fallen can still see resale prices rise, and the reverse.
That is why this note treats the index as a measure of the direction of one segment, not as a statement about affordability. Affordability depends on incomes, rents, resale prices and borrowing costs together, and no single series captures it.
What this means for decisions
For a home buyer or builder the lesson is local. National housing headlines hide a spread as wide as the one above, so any decision should rest on the city and the segment, and on the relevant timeline.
For an economic development organization the series is a quick screen: a city whose new-home prices have risen sharply may be seeing strong demand or tight supply, and one whose prices have fallen may be seeing the reverse. Either is a prompt for further data, not a conclusion.
For a lender or an investor, the index is a measure of one segment, new construction. It is a reminder that a national average is a poor guide to any one market. Northline does not offer investment advice.
What this does not show
The new housing price index measures new homes of constant quality: a house and its land, not the resale market. It does not adjust for incomes, rents or the cost of borrowing, and it says nothing about affordability. This note covers fourteen metropolitan areas, not every city. Index levels compare growth from a shared base, not the absolute price of a home in each city.
Method
Index values are read from Statistics Canada table 18-10-0205-01, new housing price index (house and land), monthly, December 2016 = 100. Percentage changes are computed from the index values at the dates stated. Peaks are the highest value in the last ten years of data. Source: Adapted from Statistics Canada. This does not constitute an endorsement by Statistics Canada.
Keep exploring
- Compare these places
- All city dashboards
- How a Bank of Canada decision reaches your mortgage, and why it takes time
- Three ways to grow or shrink: the flows behind each province’s population
Related research
Sources, method and limits
- Limitations
- The index measures the price of new homes (house and land) of constant quality, not resale prices and not affordability. It says nothing about incomes, rents or the number of homes built. Index levels compare growth from a shared base, not the absolute price of a home in each city. Ottawa–Gatineau means the Ontario part of that metropolitan area throughout.
- Preparation
- Prepared by the Northline research desk with AI assistance; every figure is read from the data library or a cited source at build time.
Data
- New housing price index, monthly (18-10-0205-01; 14 series; latest September 2026; retrieved 2026-10-23). Adapted from Statistics Canada, New housing price index, monthly, Table 18-10-0205-01. This does not constitute an endorsement by Statistics Canada.
- Conventional 5-year mortgage rate (posted) (V80691335; 1 series; latest 28 October 2026; retrieved 2026-11-03). Source: Bank of Canada, Conventional mortgage, 5-year (V80691335). Content reused under the Bank of Canada terms (https://www.bankofcanada.ca/terms/); changes: values unchanged.
- Canada Mortgage and Housing Corporation, housing starts, all areas, Canada and provinces, seasonally adjusted at annual rates, monthly (34-10-0158-01; 1 series; latest September 2026; retrieved 2026-10-23). Adapted from Statistics Canada, Canada Mortgage and Housing Corporation, housing starts, all areas, Canada and provinces, seasonally adjusted at annual rates, monthly, Table 34-10-0158-01. This does not constitute an endorsement by Statistics Canada.
Documents
- Statistics Canada: Surveys and statistical programs: New Housing Price Index (NHPI), record number 2310 (retrieved 2026-11-06)
- Statistics Canada, Table 18-10-0205-01, New housing price index, monthly (retrieved 2026-10-22)
Approved by an editor on 2026-11-09; published 2026-11-09. See the corrections log.