Research · Alberta · British Columbia
Why Canada's provinces and territories differ: a sourced comparison
Unemployment ranged across the provinces from 5.0% (Manitoba) to 8.7% (Newfoundland and Labrador) in October 2026. What each jurisdiction's own sources, Statistics Canada, CMHC and Finance Canada say explains the differences, and where they disagree.
By Northline research deskUpdated 2026-11-0660 min readData to October 2026
The data behind this graphic
| Item | Value |
|---|---|
| Newfoundland & Labrador | 8.7% |
| New Brunswick | 7.4% |
| Prince Edward Island | 7.4% |
| Alberta | 7.3% |
| Ontario | 7.3% |
| British Columbia | 6.3% |
| Nova Scotia | 6.2% |
| Saskatchewan | 5.9% |
| Quebec | 5.7% |
| Manitoba | 5.0% |
Summary
Canada's provinces and territories differ sharply on unemployment, wages, population growth and public finances. This note sets the measured differences beside the explanations that each jurisdiction's own government, Statistics Canada, CMHC, Finance Canada and other named publishers give for them. Every number comes from a published data series or from a statement by a named source. Northline does not offer its own causal model: where the sources point to a mechanism, it is attributed to them, and where the sources disagree, both statements are shown.
How to read the labels in this note:
- Observed fact: a value read from a Statistics Canada or CMHC series, or from a derived customs or labour-force table. These appear in tables and unmarked sentences.
- Source-stated mechanism: a paragraph labelled "Historical context", which reports what a named publisher says, with a link to the source. The publisher may be a government describing its own economy.
- Interpretation and hypothesis: a connection recorded in the relationship graph, labelled interpretation when the graph holds a measured association or a sourced link, and hypothesis when it holds only a hypothesis. Neither is established here.
- Opinion: the research desk's own reading, labelled as such.
Provinces are compared with provinces. The three territories are shown in their own tables and are never ranked against the provinces, because their surveys, GDP basis and fiscal arrangements differ.
What happened
Measured differences among the ten provinces
Observed fact. The table shows the latest value of each measure. Periods differ by measure: unemployment October 2026, wages October 2026, consumer prices September 2026, population 1 July 2026, housing starts September 2026, and real GDP 2025 (annual). Unemployment is a seasonally adjusted Labour Force Survey estimate; housing starts are a seasonally adjusted annual rate. The five-year change in real GDP starts from 2020, a pandemic low.
| Jurisdiction | Unemployment rate | Average hourly wage | Consumer prices, change on a year earlier | Population, change over four quarters | Real GDP, change over the five years from 2020 | Housing starts, annual rate |
|---|---|---|---|---|---|---|
| Alberta | 7.3% | C$39.00 an hour | 3.6% | 1.5% | 22.5% | 55,221 |
| British Columbia | 6.3% | C$39.54 an hour | 3.0% | 0.1% | 21.6% | 53,365 |
| Manitoba | 5.0% | C$32.46 an hour | 4.4% | 0.6% | 13.0% | 11,068 |
| New Brunswick | 7.4% | C$33.44 an hour | 5.0% | 1.0% | 15.1% | 12,930 |
| Newfoundland and Labrador | 8.7% | C$33.91 an hour | 4.7% | 0.4% | 7.7% | 1,580 |
| Nova Scotia | 6.2% | C$34.02 an hour | 5.6% | 0.8% | 22.4% | 6,237 |
| Ontario | 7.3% | C$38.96 an hour | 2.5% | 0.3% | 18.9% | 47,594 |
| Prince Edward Island | 7.4% | C$32.53 an hour | 5.7% | 0.8% | 26.9% | 2,204 |
| Quebec | 5.7% | C$37.00 an hour | 3.1% | 0.2% | 17.4% | 53,320 |
| Saskatchewan | 5.9% | C$34.21 an hour | 3.3% | 1.0% | 17.5% | 5,377 |
Observed fact. Position among the ten provinces on the three level measures (1st is the highest value; provinces with equal values at the precision shown share a position, marked joint). Population growth and GDP change are shown above as changes and are not ranked here.
| Jurisdiction | Unemployment rate | Average hourly wage | Consumer price inflation |
|---|---|---|---|
| Alberta | joint 4th of 10 | 2nd of 10 | 6th of 10 |
| British Columbia | 6th of 10 | 1st of 10 | 9th of 10 |
| Manitoba | 10th of 10 | 10th of 10 | 5th of 10 |
| New Brunswick | joint 2nd of 10 | 8th of 10 | 3rd of 10 |
| Newfoundland and Labrador | 1st of 10 | 7th of 10 | 4th of 10 |
| Nova Scotia | 7th of 10 | 6th of 10 | 2nd of 10 |
| Ontario | joint 4th of 10 | 3rd of 10 | 10th of 10 |
| Prince Edward Island | joint 2nd of 10 | 9th of 10 | 1st of 10 |
| Quebec | 9th of 10 | 4th of 10 | 8th of 10 |
| Saskatchewan | 8th of 10 | 5th of 10 | 7th of 10 |
These are provincial series from Statistics Canada tables on one definition each, so the provinces are comparable with each other on each measure. Survey estimates for the smaller provinces carry larger sampling error than the headline tables suggest.
The data behind this graphic
| Item | Value |
|---|---|
| Alberta | 1.5% |
| New Brunswick | 1.0% |
| Saskatchewan | 1.0% |
| Prince Edward Island | 0.8% |
| Nova Scotia | 0.8% |
| Manitoba | 0.6% |
| Newfoundland & Labrador | 0.4% |
| Ontario | 0.3% |
| Quebec | 0.2% |
| British Columbia | 0.1% |
Population growth over the four quarters to 1 July 2026 ran from 0.1% in British Columbia to 1.5% in Alberta. Alberta grew fastest of the ten; British Columbia, Quebec and Ontario grew least.
The data behind this graphic
| Item | Value |
|---|---|
| Prince Edward Island | 5.7% |
| Nova Scotia | 5.6% |
| New Brunswick | 5.0% |
| Newfoundland & Labrador | 4.7% |
| Manitoba | 4.4% |
| Alberta | 3.6% |
| Saskatchewan | 3.3% |
| Quebec | 3.1% |
| British Columbia | 3.0% |
| Ontario | 2.5% |
Twelve-month consumer price inflation in September 2026 ran from 2.5% in Ontario to 5.7% in Prince Edward Island. The four Atlantic provinces and Manitoba had the highest rates, and Alberta and Saskatchewan were lower; each province’s index has its own basket and weights.
The three territories, shown separately
Observed fact. Territorial values are on a different basis from the provincial tables above (smaller samples, a different GDP basis and fiscal arrangements) and are not ranked against provinces. Positions below are among the three territories only.
| Jurisdiction | Population, change over four quarters | Average weekly earnings | Position in weekly earnings among the three territories | Real GDP, change over the five years from 2020 | Position in real GDP level among the three territories |
|---|---|---|---|---|---|
| Northwest Territories | -0.3% | C$1,792 a week | 2nd of 3 | 0.3% | 1st of 3 |
| Nunavut | 2.3% | C$1,922 a week | 1st of 3 | 19.3% | 2nd of 3 |
| Yukon | 2.5% | C$1,554 a week | 3rd of 3 | 20.0% | 3rd of 3 |
The latest period is 1 July 2026 for population, August 2026 for earnings and 2025 for GDP; as in the provincial table, the five-year change in GDP starts from 2020. The position columns rank levels (dollars per week, dollars of GDP), not growth, and say nothing about the size of the economy relative to its population.
What the jurisdictions themselves report about the same differences
The statements below are the publishers' own descriptions of the measured differences. They use each publisher's period and vintage, which can differ from the series above. Statistics Canada revised provincial GDP on 5 November 2026, so 2025 growth rates quoted from earlier releases differ from its current series.
Statistics Canada reports that Alberta had the fastest growth among provinces from July 2025 to July 2026, at 1.5 per cent, while Ontario, Quebec and British Columbia, which welcome the largest share of international migrants, are more affected by changes in international migration levels. Alberta's first-quarter update, published in August before Statistics Canada's September revision, put growth in the year to April 1, 2026 at 0.9 per cent; Statistics Canada's current series shows 1.7% for that year.
Evidence: Statistics Canada: The Daily: Canada's population estimates, second quarter 2026; Government of Alberta (Treasury Board and Finance): 2026-27 First Quarter Fiscal Update and Economic Statement
The budget says Saskatchewan had the lowest unemployment rate among provinces in 2025, at 5.2 per cent against 6.8 per cent nationally, and that housing starts growth of 42.4 per cent was the highest among provinces.
Evidence: Government of Saskatchewan, Ministry of Finance: 2026-27 Budget: Protecting Saskatchewan
The Manitoba Bureau of Statistics reports that Manitoba had the lowest unemployment rate among the provinces in August 2026 at 5.0 per cent and that employment rose 2.6 per cent over the year.
Evidence: Manitoba Bureau of Statistics: Labour Force Survey: Manitoba, August 2026 (bulletin)
Statistics Canada reports that Ontario's unemployment rate rose 0.3 percentage points to 7.3 per cent in October 2026, as more people searched for work, and was 0.3 percentage points lower than a year earlier.
Evidence: Statistics Canada: Labour Force Survey, October 2026 (The Daily)
Statistics Canada reports that employment in Quebec held steady in October 2026 after a cumulative decline of 68,000 in August and September, and was down 106,000 from a year earlier; the province's unemployment rate fell to 5.7 per cent in October but was 0.4 percentage points higher than 12 months earlier.
Evidence: Statistics Canada: Labour Force Survey, October 2026 (The Daily)
British Columbia's First Quarterly Report said in September that the population was down 0.9 per cent on April 1, 2026 because of a sharp reversal in international migration, and the labour force has decreased slightly amid tighter federal immigration policy; employment was down 0.7 per cent in the first seven months of 2026. It revised its 2026 forecast down because of temporary weakness in the labour and housing markets weighing on consumer spending and residential investment. Statistics Canada has since revised its estimates, and its current series shows 5.704 million people on April 1, 2026, up from 5.688 million a year earlier.
Evidence: Government of British Columbia, Ministry of Finance: First Quarterly Report 2026/27; Statistics Canada: The Daily: Canada's population estimates, second quarter 2026
Statistics Canada reported in May 2026 that real GDP growth in 2025 was strongest in Newfoundland and Labrador, at 3.5 per cent, with oil and gas extraction output up 14.8 per cent and copper, nickel, lead and zinc ore mining up 62.0 per cent, while construction fell on engineering and non-residential building.
Evidence: Statistics Canada: The Daily: Gross domestic product by industry: Provinces and territories, 2025
Nova Scotia reports, from Statistics Canada, that real GDP rose 2.3 per cent in 2025 against 1.6 per cent nationally, with construction the fastest-growing industry and construction, real estate and health care the largest positive contributors; goods production was about 18% of GDP and largely public services just under 30%. Statistics Canada's revised figures, released on 5 November 2026, put 2025 growth at 3.1% at market prices in 2017 constant prices and 2.7% at basic prices.
The Prince Edward Island Statistics Bureau's 2025 review reports that GDP by industry expanded 2.8 per cent, with construction up 18.3 per cent, a rebound in housing and construction, a positive contribution from manufacturing shipments and a solid tourism season. Statistics Canada's revised figure for real output at basic prices, released on 5 November 2026, is 3.3%.
New Brunswick's Department of Finance and Treasury Board says growth in 2025 was primarily driven by population growth, elevated housing starts and higher employment, with real GDP up 1.3 per cent, partly offset by declines in manufacturing sales and exports that may reflect uncertainty over trade disruptions. Statistics Canada's revised market-price series at 2017 constant prices, released on 5 November 2026, shows 2.2% for 2025. The department reports 7,587 housing starts, the highest ever in data going back to 1955, and a rental universe that expanded 14.4 per cent between 2023 and 2025, easing the vacancy rate from 1.5 per cent to 2.9 per cent.
Statistics Canada reported in May 2026 that the Northwest Territories was the only jurisdiction where GDP declined in 2025, marking two consecutive years of negative growth, with mining the top detractor. Its revised series, released on 5 November 2026, shows real output at basic prices of C$4.04 billion in 2023, C$4.07 billion in 2024 and C$3.99 billion in 2025, so 2024 is now a small rise.
Evidence: Statistics Canada: The Daily: Gross domestic product by industry: Provinces and territories, 2025
Why it happened
Source-stated mechanisms. Each paragraph below is a statement by the named publisher, grouped by the mechanism it describes. A mechanism that one jurisdiction's sources describe for itself is not tested here for any other. The research desk's own readings are marked as opinion.
Resource and commodity exposure, and royalties
Observed fact. Customs-basis shares of provincial goods exports and Labour Force Survey employment shares, from the derived tables behind the relationship graph (documented exposures). They measure concentration, not dependence on any price.
| Jurisdiction | Share of domestic goods exports going to the United States, 2025 | Energy products, share of domestic goods exports, 2025 | Resource industries, share of employment, 2025 | Manufacturing, share of employment, 2025 |
|---|---|---|---|---|
| Alberta | 85% | 76% | 5.6% | 5.8% |
| British Columbia | 51% | 30% | 1.5% | 6.3% |
| Manitoba | 66% | 6% | 0.9% | 9.6% |
| New Brunswick | 90% | 38% | 1.9% | 8.2% |
| Newfoundland and Labrador | 35% | 54% | 6.4% | 3.9% |
| Nova Scotia | 69% | 1% | 2.1% | 6.7% |
| Ontario | 72% | 1% | 0.5% | 10.0% |
| Prince Edward Island | 80% | 0% | 2.5% | 9.1% |
| Quebec | 72% | 4% | 0.9% | 10.8% |
| Saskatchewan | 54% | 33% | 3.8% | 4.8% |
Statistics Canada's series put mining, quarrying and oil and gas extraction at 19.1% of Alberta's real GDP in 2025, ahead of real estate and rental and leasing at 12.2%, construction at 8.7% and manufacturing at 6.7%. Shares of chained-dollar GDP are approximate.
Alberta's first-quarter update forecasts non-renewable resource revenue of $23 billion out of total revenue of $86.3 billion in 2026-27, higher than budgeted mainly because of bitumen royalties.
Alberta's year-end report shows decreases from 2024-25 of $4.1 billion in non-renewable resource revenue and $1.2 billion in income taxes, partly offset by gains elsewhere. Bitumen royalties were $14.1 billion, below the prior year because lower oil prices reduced royalties even though bitumen production rose.
Evidence: Government of Alberta (Treasury Board and Finance): 2025-26 Final Results: Year-End Report
Saskatchewan's investor presentation describes a high-value, capital-intensive economy of roughly half goods and half services that balances the cyclicality of non-renewable resources with agri-food industries.
Saskatchewan's budget reports a record 2025 crop of 41.8 million tonnes but a 0.9 per cent fall in farm cash receipts as global crop prices moved lower, and says potash price growth was largely driven by growing demand and a long-term supply shift toward North America.
Evidence: Government of Saskatchewan, Ministry of Finance: 2026-27 Budget: Protecting Saskatchewan
The same budget estimates that a US$1 per barrel change in the oil price moves oil revenue by 16 million dollars and a US$10 per tonne change in the potash price moves potash revenue by 54 million dollars.
Evidence: Government of Saskatchewan, Ministry of Finance: 2026-27 Budget: Protecting Saskatchewan
Newfoundland and Labrador's 2026-27 budget projects a deficit of 688.5 million dollars and net debt of 20.8 billion dollars, says oil royalties are about 19 per cent of revenue, and assumes an oil price of US$79 a barrel.
The province's budget says offshore oil production rose 14.6 per cent in 2025, reflecting higher Hebron output and the return of the SeaRose vessel after a refit, yet the value of production stayed about level at 8.4 billion dollars because of lower Brent prices.
Evidence: Government of Newfoundland and Labrador, Department of Finance: Budget 2026: The Economy
British Columbia's natural gas royalties are down 531 million dollars, which the First Quarterly Report attributes mainly to correcting calculation errors in the budget price forecast and to lower private-sector price expectations; the plant-inlet price assumption is now 1.10 dollars a gigajoule against 2.18 in the budget. It adds that royalty rates are particularly sensitive to prices in a band of 1.22 to 2.42 dollars, so effective rates generally fall as prices fall, and that a new royalty framework takes full effect on January 1, 2027.
Evidence: Government of British Columbia, Ministry of Finance: First Quarterly Report 2026/27
New Brunswick's first-quarter update says royalties are down $6.9 million because volatile and uncertain market conditions for most forest products are now expected to persist for the duration of the fiscal year.
Manitoba Hydro reports that 2025-26 was the fourth year of low water conditions in the past five, that severe drought reduced generation and forced larger, higher-priced power imports, and that more than 97 per cent of Manitoba's electricity comes from renewable hydroelectric resources.
Statistics Canada reported in May 2026 that increased output from oil and gas extraction in British Columbia (up 7.3 per cent) and from copper and other ore mining (up 9.4 per cent) was among the top contributors to growth in 2025.
Evidence: Statistics Canada: Gross domestic product by industry: Provinces and territories, 2025
Read together, these statements describe three different relationships to commodities: governments whose own revenue moves with a price (Alberta, Saskatchewan, and Newfoundland and Labrador by its own account), economies whose output rises with resource production while revenue does not (British Columbia), and governments and Crown utilities whose resource revenue turns on water or timber rather than oil (Manitoba, New Brunswick), although energy products are a large share of New Brunswick's goods exports (table above). The sources do not rank these exposures against each other. This is the research desk's grouping of the sources, not a finding of any one of them.
The data behind this graphic
| Item | Share of exports | Share of jobs |
|---|---|---|
| British Columbia | 30.1% | 0.9% |
| Alberta | 76.1% | 5.4% |
| Saskatchewan | 32.7% | 3.6% |
| Manitoba | 5.7% | 0.8% |
| Ontario | 1.2% | 0.5% |
| Quebec | 4.0% | 0.6% |
| New Brunswick | 38.1% | 0.7% |
| Nova Scotia | 0.8% | 0.5% |
| Newfoundland & Labrador | 53.6% | 4.9% |
The chart pairs each province’s energy share of exports with its mining and oil and gas share of employment. In every province with both figures the second is smaller than the first. The companion note, Where the money comes from is not where the jobs are, looks at why.
Trade and United States export exposure
Observed fact. The United States share of each province's goods exports is in the table above. The statements below describe how each government says tariffs and trade disputes have reached its economy.
British Columbia says its exposure to US tariffs is concentrated in forestry, aluminum and manufacturing, that exports to the United States are down largely because of lower softwood lumber exports, and that exports to other destinations rose on LNG production, higher commodity prices and copper demand tied to the clean-energy transition and data-centre grid expansion.
Evidence: Government of British Columbia, Ministry of Finance: First Quarterly Report 2026/27
The Budget 2026 fiscal plan says British Columbia is less exposed to US trade than other provinces, with nearly half of goods exports going to non-US destinations.
The Financial Accountability Office of Ontario says real GDP growth slowed from 1.6 per cent in 2024 to 1.3 per cent in 2025 as US tariffs hindered Ontario's exports and machinery and equipment investment while residential investment continued to fall, and that Ontario is expected to be disproportionately affected by uncertainty in Canada-US trade relations because its manufacturing sector continues to face significant pressure from US tariffs. Statistics Canada's revised market-price series at 2017 constant prices, released on 5 November 2026, shows 1.8% for 2025.
Evidence: Financial Accountability Office of Ontario: Economic and Budget Outlook, Summer 2026
Ontario's budget says exports experienced their biggest decline since the pandemic in the second quarter of 2025, contributing to a 0.7 per cent decline in real GDP that quarter, and that trade disruptions disproportionately affected employment in regions near the United States and with more manufacturing.
The Institut de la statistique du Québec reports that Quebec's exports to the United States in 2025 were down 6.9 per cent from 2024 while exports to other countries were up 10.6 per cent, so that total exports were down 2.3 per cent.
New Brunswick says its forestry sector faces heightened pressure from the US-imposed 45.16 per cent duty on softwood lumber and said in March that the scheduled renegotiation of the Canada-United States-Mexico Agreement was likely to add uncertainty. At the joint review on 1 July 2026 the United States did not agree to renew the agreement, which remains in force.
Evidence: Government of New Brunswick, Department of Finance and Treasury Board: 2026-2027 Economic Outlook (tabled with Budget 2026-27); Office of the United States Trade Representative: Ambassador Greer Issues Statement on the USMCA Joint Review
The budget says the vast majority of Nova Scotia's exports remain CUSMA-compliant and enter the United States without tariffs, and that significant uncertainty remains around future US tariff policy.
Manitoba says softening US demand because of tariff uncertainty has weighed on export-oriented sectors, particularly agriculture and manufacturing, and that China imposed retaliatory tariffs on canola in 2025.
Evidence: Government of Manitoba (Manitoba Finance): Manitoba Budget 2026 (tabled 24 March 2026)
Saskatchewan's budget says the 2025 export decline was concentrated in the United States (-$3.1 billion) and China (-$1.5 billion), that the effects of tariffs, especially from the United States, have been milder than expected because CUSMA compliance of around 97 per cent holds the effective rate at 1.6 per cent, and that China lowered its duty on canola seed to 15 per cent from March 1, 2026.
Evidence: Government of Saskatchewan, Ministry of Finance: 2026-27 Budget: Protecting Saskatchewan
Alberta says that while new U.S. tariffs create uncertainty, key Alberta exports remain exempt, limiting the impact. It also says geopolitical instability and revenue volatility are significant risks to the fiscal outlook and that the wider heavy-oil discount reflects Venezuelan and U.S. strategic reserve supply.
Prince Edward Island's statistical review reports international goods exports of $2.6 billion in 2025, a new high, with frozen food products making up 29.3 per cent of the total, and notes that exports to the European Union have almost tripled since 2017.
Where the sources do not line up. Only some governments give a compliance share or an affected-export value, and the figures are not defined alike.
Alberta's August 2025 report estimated that about 90 per cent of Alberta's energy exports were CUSMA compliant and tariff-free; that is a year-old estimate of the compliance share, and the report said exemptions lowered Canada's effective tariff rate particularly for Alberta.
Evidence: Government of Alberta (Treasury Board and Finance): Economic Trends, August 2025
Saskatchewan estimates CUSMA compliance of around 97 per cent for its goods exports and an effective U.S. tariff rate of 1.6 per cent; the sources cited give no equivalent current Alberta figure.
Evidence: Government of Saskatchewan, Ministry of Finance: 2026-27 Budget: Protecting Saskatchewan
Newfoundland and Labrador's budget forecast assumes "current U.S. tariffs on Canadian exports will remain in place throughout the projection period", and it records crude oil at 52.8 per cent of international exports and iron ore at 17.5 per cent.
Evidence: Government of Newfoundland and Labrador, Department of Finance: Budget 2026: The Economy
The data show a lower United States share for Newfoundland and Labrador than for any other province, but no source cited here says where Newfoundland and Labrador's crude and iron ore are sold or what tariffs apply to them, so the exposure to the United States tariffs is not assessed; the sources offer only that the forecast assumes current tariffs stay.
New Brunswick, by contrast, puts the export value affected by newly imposed Section 338 tariffs and bans at roughly $115.1 million, 0.7 per cent of its 2025 exports; the sources cited give no equivalent Nova Scotia figure.
Evidence: Government of New Brunswick: New Brunswick supports local business as U.S. tariffs escalate
Migration and non-permanent residents
Observed fact. Components of the latest quarter's population change, in persons. Interprovincial moves net to zero across Canada; the table shows each province's gross in- and out-flows.
| Jurisdiction | Immigrants | Net change in non-permanent residents | Interprovincial in-migrants | Interprovincial out-migrants |
|---|---|---|---|---|
| Alberta | 14 thousand | -1,628 | 27 thousand | 21 thousand |
| British Columbia | 13 thousand | -6,483 | 22 thousand | 19 thousand |
| Manitoba | 5,348 | -911 | 5,090 | 6,937 |
| New Brunswick | 2,657 | 2,364 | 4,751 | 4,200 |
| Newfoundland and Labrador | 1,557 | 239 | 2,783 | 2,202 |
| Nova Scotia | 2,879 | 1,311 | 6,668 | 5,705 |
| Ontario | 43 thousand | -19 thousand | 28 thousand | 35 thousand |
| Prince Edward Island | 660 | 329 | 1,194 | 1,805 |
| Quebec | 11 thousand | 4,620 | 11 thousand | 12 thousand |
| Saskatchewan | 5,036 | -2 | 7,034 | 7,147 |
Latest period: Q2 2026 (immigrants and non-permanent residents), Q2 2026 (interprovincial).
Alberta said in August that it had led the country in net interprovincial migration gains for the fifteenth consecutive quarter, while its non-permanent resident population fell by more than 35,000 over the past year. Statistics Canada has since revised its estimates of non-permanent residents back to July 2021: its current series shows a much smaller fall over that year, and a change of -7,957 over the four quarters to the end of Q2 2026.
Evidence: Government of Alberta (Treasury Board and Finance): 2026-27 First Quarter Fiscal Update and Economic Statement; Statistics Canada: The Daily: Canada's population estimates, second quarter 2026
British Columbia's First Quarterly Report said in September that the population was down 0.9 per cent on April 1, 2026 because of a sharp reversal in international migration, and the labour force has decreased slightly amid tighter federal immigration policy; employment was down 0.7 per cent in the first seven months of 2026. It revised its 2026 forecast down because of temporary weakness in the labour and housing markets weighing on consumer spending and residential investment. Statistics Canada has since revised its estimates, and its current series shows 5.704 million people on April 1, 2026, up from 5.688 million a year earlier.
Evidence: Government of British Columbia, Ministry of Finance: First Quarterly Report 2026/27; Statistics Canada: The Daily: Canada's population estimates, second quarter 2026
The FAO's economic monitor of June 2026 said Ontario's population was lower than a year earlier in the fourth quarter of 2025 and the first quarter of 2026, the first decrease on records back to 1951, which it attributed to a significant outflow of non-permanent residents and fewer new permanent residents. Statistics Canada has since revised its estimates of non-permanent residents back to July 2021, and its current series shows no fall: Ontario's population was up 0.6% in the year to 1 October 2025, 0.5% in the year to 1 January 2026 and 0.3% in the year to 1 July 2026.
Evidence: Financial Accountability Office of Ontario: Ontario Economic Monitor: October 2025 to March 2026; Statistics Canada: The Daily: Canada's population estimates, second quarter 2026
The Institut de la statistique du Québec's July 2026 projections say Quebec's population could stabilize around 9.2 million and should decline by about 50,000 between 2025 and 2029, mostly because of an expected reduction in temporary immigration, while demographic housing needs rise by 0.7 per cent because of the age structure. The Institut stresses that projections are not forecasts.
Manitoba's March budget reported a record net outflow of 10,489 non-permanent residents in the year to September 2025, and said the provincial nominee program was 56.7 per cent of immigration in 2024/25. Statistics Canada has since revised its estimates, and its current series shows a much smaller net outflow over those four quarters.
Evidence: Government of Manitoba (Manitoba Finance): Manitoba Budget 2026 (tabled 24 March 2026); Statistics Canada: The Daily: Canada's population estimates, second quarter 2026
The Saskatchewan Bureau of Statistics reports net interprovincial migration of -4,275 over the year to April 2026, with Alberta the primary source of the movement. Over the four quarters to the end of Q2 2026 in Statistics Canada's series, net interprovincial migration was -2,837 for Saskatchewan, 22 thousand for Alberta and -5,291 for Manitoba, and non-permanent residents changed by -849, -7,957 and -6,814.
Evidence: Saskatchewan Bureau of Statistics: Quarterly Population Growth, First Quarter 2026
Nova Scotia's population estimate says the province's population rose by 8,262 in the year to July 1, 2026, a smaller gain than in any of the previous nine years, with immigration of 9,564 far exceeding emigration, the eleventh consecutive year of positive net interprovincial migration, and a net natural population change of -3,498.
Prince Edward Island's statistical review reports that the population was an estimated 182,657 on July 1, 2025, up 1.6 per cent against 0.9 per cent for Canada, but that international immigration fell 31.4 per cent in 2024-25 while net interprovincial migration added about 1,043 people.
New Brunswick's March outlook expected real GDP to increase 1.0 per cent in 2026 as weaker population gains and moderating residential construction limit growth, projected population growth of 0.3 per cent in 2026 against 1.3 per cent in the year to July 2025, and attributed the expected slowdown to high outflows and limited inflows of non-permanent residents under current federal immigration policy. Statistics Canada's estimate for the year to 1 July 2026 is 1.0%.
Newfoundland and Labrador's finance department reports that population rose by 2,260 in the year to July 2026, the sixth consecutive annual increase, on near-record immigration partly offset by a decline in non-permanent residents, with natural population loss accelerating for ten years as the population ages.
Where the sources disagree. Alberta's published figure for its population growth covers a different period from Statistics Canada's and predates Statistics Canada's September revision; the paragraph below gives both, with Statistics Canada's current figure for Alberta's period.
Statistics Canada reports that Alberta had the fastest growth among provinces from July 2025 to July 2026, at 1.5 per cent, while Ontario, Quebec and British Columbia, which welcome the largest share of international migrants, are more affected by changes in international migration levels. Alberta's first-quarter update, published in August before Statistics Canada's September revision, put growth in the year to April 1, 2026 at 0.9 per cent; Statistics Canada's current series shows 1.7% for that year.
Evidence: Statistics Canada: The Daily: Canada's population estimates, second quarter 2026; Government of Alberta (Treasury Board and Finance): 2026-27 First Quarter Fiscal Update and Economic Statement
Alberta adds that net interprovincial migration added 6,006 people in the first quarter and that its non-permanent resident population fell by more than 35,000 over the past year. Statistics Canada's later revision shows a much smaller fall.
Evidence: Government of Alberta (Treasury Board and Finance): 2026-27 First Quarter Fiscal Update and Economic Statement; Statistics Canada: The Daily: Canada's population estimates, second quarter 2026
Manitoba reported an unprecedented 12-month net outflow of non-permanent residents of 10,489 people to September 2025, which it attributed to federal policy aimed at reducing their number. Statistics Canada's later revision shows a much smaller outflow for that period. The Saskatchewan sources cited here do not give the same attribution.
Evidence: Government of Manitoba (Manitoba Finance): Manitoba Budget 2026 (tabled 24 March 2026); Statistics Canada: The Daily: Canada's population estimates, second quarter 2026
The data behind this graphic
| Item | Value |
|---|---|
| Quebec | 4,620 |
| New Brunswick | 2,364 |
| Nova Scotia | 1,311 |
| Prince Edward Island | 329 |
| Newfoundland & Labrador | 239 |
| Saskatchewan | -2 |
| Manitoba | -911 |
| Alberta | -1,628 |
| British Columbia | -6,483 |
| Ontario | -19 thousand |
The latest quarter’s net change in temporary residents was -19 thousand in Ontario and -6,483 in British Columbia, and positive in Quebec (4,620) and the Atlantic provinces. The pattern in the last year is described in Three ways to grow or shrink.
Housing supply
Observed fact. Housing starts for each province are in the first table. The statements below link housing activity to population, rents and affordability in the named place.
The budget says Saskatchewan had the lowest unemployment rate among provinces in 2025, at 5.2 per cent against 6.8 per cent nationally, and that housing starts growth of 42.4 per cent was the highest among provinces.
Evidence: Government of Saskatchewan, Ministry of Finance: 2026-27 Budget: Protecting Saskatchewan
Alberta reports that nearly 15,000 single-family homes were completed in Calgary and Edmonton in 2025, the highest since the 2006-07 boom, that completed but unsold single-family inventory reached a record, and that housing starts are expected to reach 42,000 units, down 19 per cent from last year.
New Brunswick reports 7,587 housing starts in 2025, a record, and says the rental universe expanded 14.4% between 2023 and 2025, easing the vacancy rate from 1.5% to 2.9%.
CMHC data reported by Nova Scotia put 2025 housing starts at 9,760, by far the largest annual total in data back to 1948; the rent cap, up to 5% a year, runs to the end of 2027.
Evidence: Government of Nova Scotia, Finance and Treasury Board (summarizing CMHC): Housing Starts, December and Annual 2025; Government of Nova Scotia: Residential Tenancies Program: legislative changes
British Columbia expects the average home sale price to fall 1.2 per cent in 2026, the second consecutive annual decline, and says homebuilding across the province's census metropolitan areas was lower than a year earlier.
Evidence: Government of British Columbia, Ministry of Finance: First Quarterly Report 2026/27
CMHC says British Columbia and Ontario will likely continue to struggle with historically weak home sales because of affordability challenges and slower population growth.
CMHC says British Columbia and Ontario are likely to see the weakest housing-market growth because of slower population growth, affordability challenges and higher supply, with historically low construction most visible in the condominium market.
CMHC says Quebec housing starts will decline from recent peaks, that Quebec should see modest gains in home prices due to more balanced market conditions, and that Central Canada is more affected by trade risks and is likely to lag.
CMHC says conditions in Atlantic Canada remain the weakest of its regional housing outlooks.
Newfoundland and Labrador's budget says crude oil was 52.8 per cent of the province's international exports in 2025, that average weekly earnings averaged 1,282.39 dollars in 2025 against 1,302.86 dollars nationally, and that the average home price remained the lowest of any province.
Evidence: Government of Newfoundland and Labrador, Department of Finance: Budget 2026: The Economy
CMHC says Vancouver's housing market is increasingly centred on rental development, with rental apartments around 60% of starts in 2026 against under a fifth in 2016, and that condominium starts fell sharply because of weak presales, high costs and unsold inventory.
Evidence: Canada Mortgage and Housing Corporation: Fall 2026 Housing Supply Report
British Columbia's zoning reform is a supply policy: the province says 162 of 188 local governments had adopted the small-scale multi-unit legislation by July 2024.
Fiscal capacity, Equalization and federal transfers
Source-stated mechanism. Finance Canada describes Equalization as supporting provinces with lower-than-average fiscal capacity, measured at national average tax rates across five revenue categories, with natural resources only partly included. The paragraphs below show how that mechanism appears in each province's own documents. No source cited here quantifies how much of any province's economic outcome follows from these transfers.
Finance Canada says the Government of Alberta will receive $9.2 billion in major federal transfers in 2026-27, against $2.3 billion for Saskatchewan and $10.3 billion for British Columbia.
Evidence: Finance Canada: Major federal transfers
In Finance Canada's 2026-27 Equalization table, whose columns run NL, PE, NS, NB, QC, ON, MB, SK, AB, BC, Alberta's natural-resource fiscal capacity entry is 4,778, the largest in the row, and the payments row ends in 0 0 0: no Equalization for Saskatchewan, Alberta or British Columbia. The program's own description is that Equalization supports provinces with lower-than-average fiscal capacity.
Evidence: Finance Canada: Equalization Program
Finance Canada's Equalization table for 2026-27 lists payments for the first seven of the ten provinces, from Newfoundland and Labrador to Manitoba, and none for Saskatchewan, Alberta or British Columbia. It says Equalization supports provinces with lower than average fiscal capacity.
Evidence: Finance Canada: Equalization Program
In Finance Canada's 2026-27 Equalization table, in dollars per person, Ontario's natural-resource fiscal capacity is 22 against 4,778 for Alberta, and Ontario's column shows an Equalization payment of 26 against 1,568 for Quebec. The chart on the same page labels the figures in dollars per capita.
Evidence: Finance Canada: Equalization Program; Finance Canada: Chart 1: Equalization 2026-27 (chart on the Equalization program page)
Finance Canada describes how Equalization works. It says payments go to provinces with lower than average fiscal capacity, that fiscal capacity is measured at national average tax rates across five revenue categories including natural resource revenues, that natural resources are only partially included, and that "provincial spending decisions and overall fiscal results do not affect Equalization". Quebec's payment is therefore a statement about its measured revenue capacity, not about its budget balance.
Evidence: Department of Finance Canada: Equalization Program (page dated 2025-12-11; 2026-27 figures)
On revenue, Manitoba says the Canada Health Transfer, Canada Social Transfer and Equalization together make up approximately 29 per cent of 2026/27 summary revenue, and that Equalization is more than half of federal transfers. Manitoba will receive 5.0 billion dollars of Equalization, up 355 million dollars. Its own taxes are listed as individual income tax of 5,075 million dollars and retail sales tax of 3,037 million dollars, against minerals and petroleum revenue of 26 million dollars and water power rentals of 62 million dollars.
Evidence: Government of Manitoba (Manitoba Finance): Manitoba Budget 2026 (tabled 24 March 2026)
Manitoba says its Equalization increase is mainly due to growth in the overall size of the program and "relatively lower fiscal capacity growth compared to some of the other provinces", and that British Columbia, Alberta and Saskatchewan receive no Equalization in 2026/27.
Evidence: Government of Manitoba (Manitoba Finance): Manitoba Budget 2026 (tabled 24 March 2026)
Nova Scotia's Equalization entitlement for 2026-27 is estimated at $3.5 billion; the budget says growth is smaller than in previous years because of lower provincial population growth relative to other provinces, stronger fiscal capacity growth relative to the national average, and a lower top-up from the growth escalator.
Finance Canada says Equalization supports provinces with lower than average fiscal capacity, that fiscal capacity is assessed across personal income taxes, business taxes, consumption taxes, property taxes and natural resource revenues, and that provincial spending decisions and overall fiscal results do not affect the payment.
Evidence: Department of Finance Canada: Equalization Program (page dated 2025-12-11; 2026-27 figures)
Finance Canada explains that fiscal capacity "is not based on its actual tax revenues, but on those it could raise with national average tax rates", and that for natural resources it is "assessed based on partial inclusion of actual revenue collected by the province". Its chart, in dollars per capita, lists a natural resource fiscal capacity of 2,964 for Newfoundland and Labrador, against 2,533 for Saskatchewan and 4,778 for Alberta, and a non-resource fiscal capacity of 8,833 for Newfoundland and Labrador.
Evidence: Department of Finance Canada: Equalization Program (2026-27); Finance Canada: Chart 1: Equalization 2026-27 (chart on the Equalization program page)
Finance Canada also says Canada Health Transfer payments are made on an equal per capita basis, so for a small province the transfer scales with population rather than with local revenue.
Evidence: Department of Finance Canada: Canada Health Transfer
Reading that description, the size of New Brunswick's deficit does not move the transfer; its revenue capacity relative to the national average does. The page does not say how much of New Brunswick's payment comes from each revenue category.
Read together, the sources are consistent with this reading: offshore oil lifts Newfoundland and Labrador's resource fiscal capacity while its non-resource capacity stays low, so it sits at the margin of Equalization and its payment rises or falls with how the formula treats resource revenue. No source states that explanation; it is the research desk's reading.
Prince Edward Island's revenue base has almost no resource royalties, so an unusually large share of revenue comes from rules the federal government sets. Whether that makes the deficit more or less controllable is a judgement; the sources say only what the formula counts.
Public-sector size
The sources cited here do not compare public-sector employment or output shares across the ten provinces, so this section reports only what individual governments and Statistics Canada say about public administration in their own province.
The Institut de la statistique du Québec reports that Quebec's real GDP in the first seven months of 2026 was 0.3 per cent higher than a year earlier, with real estate, finance and insurance, and transportation contributing most to the increase and manufacturing (down 1.9 per cent) and public administration contributing negatively, against growth of 1.1 per cent for Canada. Its earlier release, for the first five months, had shown a fall of 0.1 per cent.
Evidence: Institut de la statistique du Québec: PIB réel du Québec : baisse de 0,1 % en juillet 2026 (communiqué, 27 octobre 2026); Institut de la statistique du Québec: Québec real GDP down 0.1% in May 2026
New Brunswick's budget plans to reduce Part 1 of the civil service by about 12 per cent over three years.
Prince Edward Island's statistical review says employment rose 1.1 per cent in 2025 while the unemployment rate averaged 8.0 per cent, unchanged, with employment falling in agriculture and in public administration, and that labour productivity rose 4.9 per cent against 0.7 per cent for Canada. It also reports that labour income rose 6.4 per cent against 3.9 per cent nationally.
Nova Scotia reports that average weekly wages in January 2026 were 90.8 per cent of the national average and below it in every industry except health and social assistance, with the largest gap in public administration.
The Northwest Territories' economic outlook says public investment accounted for 78 per cent of total investment in 2025, up from 30 per cent in 2014, and that the public sector employs more residents than the private sector.
Job Bank reports that Yukon had the strongest employment growth of the three territories in 2025, up 2.3 per cent with the largest gains in public administration, that its unemployment rate dropped slightly to 4.2 per cent, and that labour shortages will intensify in 2026 as reduced federal migration targets limit workforce growth across the territories.
A cross-provincial comparison of public-sector size is a gap in this note. The statements above show public administration contributing to a fall in output in one province, to a planned reduction in another, and to wage gaps and employment changes in others; they do not show that public-sector size explains why the provinces differ.
Demographics and ageing
New Brunswick's 2024 economy review notes that the average age was 44.2 years and that the share of residents aged 60 and over rose from 18.8 per cent to 30.5 per cent between 2004 and 2024, and says record immigration and interprovincial migration helped stabilize the pace of ageing.
Manitoba says its median age of 37.6 years is the lowest among the provinces.
Newfoundland and Labrador's finance department reports that population rose by 2,260 in the year to July 2026, the sixth consecutive annual increase, on near-record immigration partly offset by a decline in non-permanent residents, with natural population loss accelerating for ten years as the population ages.
The Atlantic Canada Opportunities Agency says demographic pressures, including an ageing population and persistent negative natural increase, make attracting and retaining people essential to sustaining economic momentum.
Evidence: Atlantic Canada Opportunities Agency: 2026-27 Departmental Plan: Operating context
Saskatchewan's budget says the current range of tariffs by the United States, India and China remains a downside risk, that tighter immigration policy could ripple through the labour supply and slow investment in housing, and that structural labour shortages will likely continue as baby boomers leave the workforce.
Evidence: Government of Saskatchewan, Ministry of Finance: 2026-27 Budget: Protecting Saskatchewan
Job Bank gives the median age as 35.8 years in the Northwest Territories and 27.1 in Nunavut, where it describes the youngest population in Canada.
Where the jurisdictions' own sources disagree
These are cases where two sources give different accounts of the same jurisdiction or of how jurisdictions compare. They are shown side by side and are not reconciled.
Newfoundland and Labrador's April budget put its own estimate of 2025 growth at 4.8 per cent, above the 3.5 per cent Statistics Canada reported in May for GDP by industry. Statistics Canada's revised estimates, released on 5 November 2026, put 2025 growth at 4.3 per cent, still the fastest among the provinces, and real output at basic prices rose 4.4%; the market-price series held here, at 2017 constant prices rather than chained dollars, shows 4.8%.
Evidence: Government of Newfoundland and Labrador, Department of Finance: Budget 2026: The Economy; Statistics Canada: The Daily: Gross domestic product by industry: Provinces and territories, 2025; Statistics Canada: The Daily: Provincial and territorial economic accounts, 2025
CMHC, citing Statistics Canada, reports that Yukon's real GDP rose 0.6 per cent in 2025 after a sharp decrease in 2024.
Evidence: Canada Mortgage and Housing Corporation: Northern Housing Report
Job Bank's territorial scan says instead that Yukon's economy contracted in 2025 largely because of the closure of the Eagle Gold Mine. The two sources differ on 2025; Statistics Canada's current series shows real GDP at basic prices up 0.7% that year.
Job Bank relays a private Signal49 forecast of strong growth for Nunavut, and the territory's own forecast is higher still. Statistics Canada's revised accounts of 5 November 2026 say GDP rose in Nunavut in 2025, and its revised industry series shows 0.8% at basic prices; the market-price series held here, at 2017 constant prices rather than chained dollars, shows -2.7%. The forecasts are not reconciled here.
Evidence: Employment and Social Development Canada (Job Bank): Economic Scan - Yukon, Northwest Territories and Nunavut: 2026; Government of Nunavut, Department of Finance: Budget 2026-27 Fiscal and Economic Indicators; Statistics Canada: The Daily: Provincial and territorial economic accounts, 2025
Ontario's fall economic outlook of 29 October 2026 projects a deficit of $16.9 billion in 2026-27, up from the $13.8 billion in its March budget, with balance pushed back to 2029-30, and net debt of 37.4 per cent of GDP; the March budget set out a capital plan of more than $210 billion over ten years. Ontario's net-debt ratio is not directly comparable with Alberta's 7.7 per cent: the two come from different documents (an October update and an August update) and each government's own definition.
Evidence: Government of Ontario, Ministry of Finance: 2026 Ontario Economic Outlook and Fiscal Review: Backgrounder: Economic and Fiscal Overview; Government of Ontario, Ministry of Finance: 2026 Ontario Budget: Ontario's Economic and Fiscal Outlook in Brief; Government of Alberta (Treasury Board and Finance): 2026-27 First Quarter Fiscal Update and Economic Statement
Manitoba's budget describes a diversified base of medium-sized sectors and says the fastest-growing provinces in 2025 and 2026 are oil-rich.
Evidence: Government of Manitoba (Manitoba Finance): Manitoba Budget 2026 (tabled 24 March 2026)
The sources document each contrast separately; none attributes British Columbia's weaker position than Alberta's to a single cause. The research desk's reading is that Alberta's oil-price gain and migration inflow are absent in British Columbia, where gas prices fell and international migration reversed. This is a hypothesis, not a source statement.
Why it matters
The differences above reach public budgets and, through them, services and borrowing capacity. The statements below are the governments' and analysts' own accounts of those links.
Alberta's swing from a budgeted deficit to a forecast surplus within six months shows how much of its finances depends on one price; the sources cited here say the improvement is mainly higher resource revenue and do not give a view on how long the oil price will stay high.
British Columbia's quarterly report links weak housing activity to lower property transfer tax revenue, which connects housing directly to the budget.
Evidence: Government of British Columbia, Ministry of Finance: First Quarterly Report 2026/27
Saskatchewan's first-quarter report ties the improved fiscal outlook to higher-than-budgeted oil prices, which means the improvement can reverse if prices fall.
Evidence: Government of Saskatchewan, Ministry of Finance: 2026-27 First Quarter Financial Report
Ontario's budget says each percentage point change in compensation-of-employees growth changes revenue by 786 million dollars, which is how a labour market weaker or stronger than the budget assumed reaches the deficit.
New Brunswick's first-quarter update projects a deficit of 1.66 billion dollars, up from the 1.39 billion budgeted, mostly because of higher social-development costs and smaller-than-expected health savings.
Prince Edward Island's Estimates of Revenue and Expenditures for 2026-27 put the province's deficit at 409.9 million dollars in 2026-27, against 449.6 million forecast for 2025-26, and project net debt at 38.1% of GDP in 2026-27, rising to 39.9% by 2028-29.
The sources describe different fiscal channels: a price-linked resource royalty (Alberta, Saskatchewan), formula transfers (Manitoba, the Atlantic provinces), a tax base that follows employment and housing (Ontario, British Columbia). That the same national shock therefore reaches budgets differently is the research desk's reading; it does not rank provinces by fiscal strength, and the debt ratios in the sources are defined differently by each government.
History
Observed fact. Long-run perspective from the same series. Unemployment is compared with its ten-year average and its ten-year peak; real GDP with the start of its record in 1981, and population with 2001.
| Jurisdiction | Unemployment rate, latest | Ten-year average | Ten-year peak | Month of the peak | Real GDP, change since 1981 | Population, change since 2001 |
|---|---|---|---|---|---|---|
| Alberta | 7.3% | 7.5% | 15.4% | May 2020 | 236.5% | 68.5% |
| British Columbia | 6.3% | 5.9% | 14.0% | May 2020 | 220.6% | 40.8% |
| Manitoba | 5.0% | 5.7% | 11.9% | May 2020 | 132.8% | 32.1% |
| New Brunswick | 7.4% | 8.0% | 14.4% | April 2020 | 121.5% | 17.8% |
| Newfoundland and Labrador | 8.7% | 12.0% | 17.8% | May 2020 | 120.3% | 5.2% |
| Nova Scotia | 6.2% | 7.6% | 14.6% | May 2020 | 132.7% | 18.2% |
| Ontario | 7.3% | 6.8% | 14.2% | May 2020 | 193.0% | 38.1% |
| Prince Edward Island | 7.4% | 8.8% | 14.8% | June 2020 | 207.4% | 34.2% |
| Quebec | 5.7% | 5.7% | 18.2% | April 2020 | 134.7% | 23.0% |
| Saskatchewan | 5.9% | 5.9% | 12.2% | May 2020 | 132.7% | 27.4% |
Real GDP is in 2017 constant dollars, annual, to 2025; population is quarterly to 1 July 2026.
Nova Scotia reports that real GDP contracted in 2012 and 2013 with industrial closures in forest products and petroleum refining and reductions in federal output.
The Canada Energy Regulator says Nova Scotia has not produced natural gas since 2018, when Sable and Deep Panuke stopped, and that there are currently no active exploration licences or projects offshore; Imperial Oil's Dartmouth refinery closed in 2013.
Evidence: Canada Energy Regulator: Nova Scotia Energy Profile (provincial and territorial energy profiles)
Finance Canada describes the 1985 Atlantic Accord as allowing Newfoundland and Labrador to "tax these resources as if it were the owner", with transitional protection from Equalization reductions that would otherwise follow as offshore revenue grew, and the 2005 Arrangement as providing "100 per cent protection" for a time-limited period. This is why the interaction between oil revenue and Equalization is a long-standing federal-provincial question, not a new one.
Evidence: Department of Finance Canada: Newfoundland and Labrador Offshore Arrangements
The Canada Energy Regulator says the Trans Mountain Expansion, online since May 2024, nearly tripled that system's capacity to 890 thousand barrels per day, and that Canadian crude exports to countries other than the United States have more than tripled since.
The Quebec budget says the real GDP per capita gap with Ontario narrowed from 15.9 per cent in 2018 to 10.2 per cent in 2024 and that household purchasing power, measured by real disposable income per capita, improved faster than in Ontario between 2018 and 2024.
Quebec's budget says the net debt burden is 4.1 percentage points lower than in March 2019.
On housing in Prince Edward Island, CMHC estimated 1,769 starts in 2025, the most since 1973, while the vacancy rate for larger apartment structures rose in Charlottetown from 0.7 to 1.7 per cent and in Summerside from 0.8 to 3.2 per cent. The province's Residential Tenancy Act caps the annual rent guideline at 3 per cent.
Evidence: Government of Prince Edward Island, PEI Statistics Bureau: 52nd Annual Statistical Review 2025 (Economic Review 2025); Government of Prince Edward Island: Residential Tenancy Act (current to May 16, 2025)
The Northwest Territories says that in 2003 mining, oil and gas generated nearly half of real GDP but by 2024 its share was 18 per cent, and that non-renewable resource industries produced high business labour productivity over two decades whose falling output now lowers overall labour productivity.
Across geographies
Named pairings, each with the same measures as the main table and the sources that compare the two. Provinces are paired with provinces; the territories are treated together.
Alberta and Saskatchewan
| Jurisdiction | Unemployment rate | Average hourly wage | Consumer prices, change on a year earlier | Population, change over four quarters | Real GDP, change over the five years from 2020 | Housing starts, annual rate |
|---|---|---|---|---|---|---|
| Alberta | 7.3% | C$39.00 an hour | 3.6% | 1.5% | 22.5% | 55,221 |
| Saskatchewan | 5.9% | C$34.21 an hour | 3.3% | 1.0% | 17.5% | 5,377 |
Saskatchewan, the closest resource peer, projects a deficit of $825 million for 2026-27 even with WTI forecast higher, and net debt of 14.9 per cent of GDP, against a surplus forecast in Alberta.
Evidence: Government of Saskatchewan, Ministry of Finance: 2026-27 First Quarter Financial Report
Its budget says a change in the WTI price of one US dollar a barrel moves oil revenue by $16 million, and that non-renewable resource revenue is 11.5 per cent of total expense, under a 15 per cent ceiling the province deems prudent. Its budget also gives a potash sensitivity, so oil is one of several resource revenue lines there.
Evidence: Government of Saskatchewan, Ministry of Finance: 2026-27 Budget: Protecting Saskatchewan
Finance Canada's table shows no equalization for Saskatchewan or Alberta in 2026-27, while Manitoba receives $5,044 million in equalization of $7.8 billion in major transfers. This is the observed difference in transfer dependence.
Evidence: Department of Finance Canada: Major federal transfers
Alberta's first-quarter update forecasts net debt of 7.7 per cent of GDP at year-end and a surplus in 2026-27 mainly from higher non-renewable resource revenue, an $11.4 billion swing from the budget.
Statistics Canada counts 93.2 per cent of Saskatchewan's exporting establishments as selling to the United States in 2025, against 89.1 per cent in Alberta and 94.5 per cent in Manitoba. This counts firms, not export value.
The sources are consistent with Saskatchewan sitting between Alberta, whose finances respond most strongly to oil prices, and Manitoba, whose diversified economy relies on equalization and carries heavier debt. This is the desk's reading of the sources above; no source states it, and it is not a tested causal claim.
Ontario and Quebec
| Jurisdiction | Unemployment rate | Average hourly wage | Consumer prices, change on a year earlier | Population, change over four quarters | Real GDP, change over the five years from 2020 | Housing starts, annual rate |
|---|---|---|---|---|---|---|
| Ontario | 7.3% | C$38.96 an hour | 2.5% | 0.3% | 18.9% | 47,594 |
| Quebec | 5.7% | C$37.00 an hour | 3.1% | 0.2% | 17.4% | 53,320 |
The Quebec budget says the real GDP per capita gap with Ontario narrowed from 15.9 per cent in 2018 to 10.2 per cent in 2024 and that household purchasing power, measured by real disposable income per capita, improved faster than in Ontario between 2018 and 2024.
Statistics Canada reported that in October 2026 Ontario's unemployment rate rose to 7.3 per cent while Quebec's fell to 5.7 per cent.
Evidence: Statistics Canada: Labour Force Survey, October 2026 (The Daily)
Statistics Canada reported in May 2026 that manufacturing output fell in 10 jurisdictions in 2025, a significant drag on growth in Quebec (down 4.0 per cent).
Evidence: Statistics Canada: Gross domestic product by industry: Provinces and territories, 2025
Statistics Canada reported in May 2026 that Alberta contributed almost as much to Canada's 2025 growth as Ontario, and that goods-producing activity declined in Quebec while it edged up in Ontario. Its revised accounts of 5 November 2026 show GDP rising in all provinces in 2025, fastest in Newfoundland and Labrador and slowest in Quebec; in the revised series Ontario's real output at basic prices rose by C$14.9 billion and Alberta's by C$10.9 billion.
Evidence: Statistics Canada: The Daily: Gross domestic product by industry: Provinces and territories, 2025; Statistics Canada: The Daily: Provincial and territorial economic accounts, 2025
The statements explain the gap in terms the sources give: oil and gas extraction was among the top contributors to growth in Alberta, which also had the fastest population growth; Ontario's contribution came mainly from services; and in Quebec manufacturing was a drag and employment fell. They do not establish that one causes another.
Quebec's US export share is close to Ontario's and far below New Brunswick's or Alberta's, and its energy share is small, so its exposure runs through manufacturing and other non-energy goods rather than oil. The sources show the exposures and the support measures but give no estimate of tariff effects on Quebec output.
Quebec's March budget, the previous government's, estimated its net debt at 38.8 per cent of GDP at March 31, 2026, close to Ontario's, and planned a return to balance by 2029-30. Quebec's Public Accounts for 2025-26, published in July, show an accounting deficit of 5.5 billion dollars, against the 7.7 billion the budget had estimated; Ontario's deficit for that year was larger, at 13.0 billion dollars by its Public Accounts. Quebec also says its real GDP per capita gap with Ontario narrowed from 15.9 per cent in 2018 to 10.2 per cent in 2024.
Evidence: Gouvernement du Québec, ministère des Finances: Budget 2026-2027 - Press release no. 1 of 3 - A responsible budget with targeted measures for Quebecers; Gouvernement du Québec, ministère des Finances: Publication des Comptes publics 2025-2026 du gouvernement (17 juillet 2026); Government of Ontario: Public Accounts 2025-26: Annual report; Gouvernement du Québec, Cabinet du premier ministre: Le premier ministre du Québec dévoile son Conseil des ministres (21 octobre 2026)
Research desk reading, not tested: Ontario's higher unemployment than Quebec is consistent with the sources' common thread of manufacturing tariff exposure and a fall in non-permanent residents. Alberta's government attributes its improved fiscal position mainly to higher resource revenue, and CMHC expects Western Canada to lead housing-market growth in 2026, helped by stronger commodity prices. No source here isolates the size of each cause.
British Columbia and Ontario
| Jurisdiction | Unemployment rate | Average hourly wage | Consumer prices, change on a year earlier | Population, change over four quarters | Real GDP, change over the five years from 2020 | Housing starts, annual rate |
|---|---|---|---|---|---|---|
| British Columbia | 6.3% | C$39.54 an hour | 3.0% | 0.1% | 21.6% | 53,365 |
| Ontario | 7.3% | C$38.96 an hour | 2.5% | 0.3% | 18.9% | 47,594 |
Ontario's budget says trade disruptions have disproportionately affected regions near the United States with more manufacturing employment.
British Columbia says it is less exposed to US trade than other provinces, with nearly half of goods exports going to non-US destinations, whereas the FAO put the US at 77 per cent of Ontario's goods exports in 2024.
Evidence: Government of British Columbia, Ministry of Finance: Budget and Fiscal Plan 2026/27 to 2028/29 (full document); Financial Accountability Office of Ontario: Impacts of US Tariffs on Ontario's Economy (April 2025)
British Columbia's First Quarterly Report said its population fell 0.9 per cent in the year to April 2026 on a sharp reversal in international migration, and the FAO reported a fall for Ontario. Statistics Canada has since revised its estimates, and its current series shows both provinces growing over those periods: British Columbia by 0.3% in the year to 1 April 2026, and Ontario by 0.6% and 0.5% in the years to 1 October 2025 and 1 January 2026.
Evidence: Government of British Columbia, Ministry of Finance: First Quarterly Report 2026/27; Financial Accountability Office of Ontario: Ontario Economic Monitor: October 2025 to March 2026; Statistics Canada: The Daily: Canada's population estimates, second quarter 2026
CMHC says British Columbia and Ontario are likely to see the weakest housing-market growth because of slower population growth, affordability challenges and higher supply, with historically low construction most visible in the condominium market.
The Atlantic four
| Jurisdiction | Unemployment rate | Average hourly wage | Consumer prices, change on a year earlier | Population, change over four quarters | Real GDP, change over the five years from 2020 | Housing starts, annual rate |
|---|---|---|---|---|---|---|
| New Brunswick | 7.4% | C$33.44 an hour | 5.0% | 1.0% | 15.1% | 12,930 |
| Nova Scotia | 6.2% | C$34.02 an hour | 5.6% | 0.8% | 22.4% | 6,237 |
| Prince Edward Island | 7.4% | C$32.53 an hour | 5.7% | 0.8% | 26.9% | 2,204 |
| Newfoundland and Labrador | 8.7% | C$33.91 an hour | 4.7% | 0.4% | 7.7% | 1,580 |
Finance Canada's 2026-27 chart, in dollars per person, gives New Brunswick an Equalization payment of 4,004, against 3,336 for Nova Scotia and 336 for Newfoundland and Labrador, and a natural resource fiscal capacity of 107 for New Brunswick, 15 for Nova Scotia and 2,964 for Newfoundland and Labrador. New Brunswick's non-resource fiscal capacity is 7,997, against 12,086 for Ontario.
Evidence: Department of Finance Canada: Equalization Program (page dated 2025-12-11; 2026-27 figures); Finance Canada: Chart 1: Equalization 2026-27 (chart on the Equalization program page)
In the chart's text version, New Brunswick's payment per person is second only to Prince Edward Island's among the ten provinces (in total dollars the order differs, because payments scale with population), and Newfoundland and Labrador's is far smaller where its natural resource fiscal capacity is far larger. The figures show that pattern; they do not by themselves establish why New Brunswick's fiscal capacity is low, and no source cited here explains it.
Statistics Canada says New Brunswick (+1.0%) and Nova Scotia (+0.8%) grew faster than the country as a whole (+0.5%) in the year to July 1, 2026.
Evidence: Statistics Canada: The Daily: Canada's population estimates, second quarter 2026
Newfoundland and Labrador's government expects oil royalties to represent 19 per cent of its overall 2026-27 revenues, a dependence that New Brunswick's royalty line does not have.
Newfoundland and Labrador's budget says oil royalties are expected to represent 19 per cent of its overall revenues in 2026-27 and that real GDP is forecast to rise 5.5 per cent in 2026, driven primarily by higher oil and mineral production; Nova Scotia's budget forecast is 1.5 per cent.
Evidence: Government of Newfoundland and Labrador, Department of Finance: Budget 2026 Delivers Opportunity For All of Us (news release and backgrounder); Government of Nova Scotia, Finance and Treasury Board: Nova Scotia Budget 2026-27 (Economics and Statistics Daily Stats)
The peer sources describe population growth that is slowing or projected to slow, as Nova Scotia's does; none of them compares why the pace differs between provinces, so no cause of the differences is asserted here.
New Brunswick's first-quarter update raises its 2026-27 deficit to $1.66 billion from the $1.39 billion budgeted, mostly from higher social-development costs and smaller health savings than planned.
The Atlantic Canada Opportunities Agency says recent record population growth in the Maritimes was sustained by immigration and interprovincial migrants but has slowed, affecting potential output.
Evidence: Atlantic Canada Opportunities Agency: 2026-27 Departmental Plan: Operating context
Alberta and Saskatchewan receive no Equalization, Nova Scotia receives a large payment, and Newfoundland and Labrador sits between: a large resource royalty and a small payment. That is the desk's summary of the sourced figures, not a finding by any named source.
The three territories
The territories are compared with each other, not with the provinces. The table of values is in the first section.
Nunavut's finance department reports that Territorial Formula Financing will provide $2,347.9 million in 2026-27 and that it and other federal transfers make up 70% of Nunavut's revenues, against 36% in New Brunswick and 16% in British Columbia on that department's measure.
Evidence: Government of Nunavut, Department of Finance: Budget 2026-27 Fiscal and Economic Indicators
Finance Canada's per capita federal support for 2026-27 is 34,034 dollars for Yukon, 42,666 for the Northwest Territories and 57,594 for Nunavut, against 2,577 across all provinces and territories.
Statistics Canada reported in May 2026 that construction activity fell in 2025 in the Northwest Territories (by 9.5 per cent), Newfoundland and Labrador (8.5 per cent) and Yukon (0.6 per cent), while Canada's real GDP by industry rose 1.6 per cent.
Evidence: Statistics Canada: The Daily: Gross domestic product by industry: Provinces and territories, 2025
Statistics Canada reports median after-tax income of $116,100 in the Northwest Territories, $109,600 in Nunavut and $89,300 in Yukon in 2024, and says these differences are not adjusted for cost of living or age structure.
Evidence: Statistics Canada: The Daily: Canadian Income Survey, 2024
Statistics Canada reports that the territories had the highest median after-tax income in Canada in 2024, led by the Northwest Territories at 116,100 dollars, while poverty rates in the Northwest Territories were comparable to those in the provinces.
Evidence: Statistics Canada: The Daily: Canadian Income Survey, 2024
Statistics Canada reports that Nunavut continued to have the highest poverty rate in Canada in 2024, at 31.7 per cent, reflecting the higher cost of living in the North.
Evidence: Statistics Canada: The Daily: Canadian Income Survey, 2024
CMHC says Yukon and the Northwest Territories have the lowest exposure to US tariffs among provinces and territories. The Northwest Territories is not a province: its surveys, GDP basis and fiscal arrangements differ.
Evidence: Canada Mortgage and Housing Corporation: Northern Housing Report
Taken together, the sources suggest the three territories differ by which mines they lean on: diamonds in the Northwest Territories, a closed gold mine in Yukon, and gold plus iron ore in Nunavut. No source tests this comparison, and Nunavut's much younger population and housing shortage are separate stated factors.
Taken together, the sources describe the same constraint in all three territories, a small workforce with too little housing, and differ in how it shows up: out-migration in the Northwest Territories and Nunavut, newcomers in Yukon. No source tests whether housing supply explains the Northwest Territories' net outflow, so that link is a hypothesis.
Mining is how the three territories' sources explain their recent output; the statements for each are below.
The Northwest Territories Bureau of Statistics reports that oil and gas extraction fell 8.9 per cent and diamond mining 9.5 per cent in 2025 and that construction also declined by 9.5 per cent.
The Northwest Territories government says the major diamond mines that underpinned growth for almost three decades are reaching the end of their productive lives, that mining, oil and gas generated nearly one half of real GDP in 2003 but 18 per cent by 2024, and that since 2017 diamonds have been about two-thirds of exports.
CMHC says the Eagle Gold Mine accounted for roughly 10% of Yukon's GDP in 2023, that mining continued to weigh heavily on the economy after the June 2024 heap leach failure, and that growth in services and non-mining goods industries partially offset the declines, with higher territorial spending driving public-sector growth and private-sector activity.
Evidence: Canada Mortgage and Housing Corporation: Northern Housing Report
The Government of Nunavut's finance department says mining now accounts for almost 50% of the economy, by far mining's highest share in Canada, and forecasts the public sector at roughly 28% of all goods and services produced in 2026.
Evidence: Government of Nunavut, Department of Finance: Budget 2026-27 Fiscal and Economic Indicators
Finance Canada's letter puts the Northwest Territories' Territorial Formula Financing payment for 2025-26 at $1.8 billion and total major transfers at $1.9 billion, of which the Canada Health Transfer and Canada Social Transfer are $58 million and $18 million.
Finance Canada says natural resource revenues are not part of the eligible revenues in the Territorial Formula Financing calculation, that their treatment is negotiated separately with each territory in devolution, and that the Yukon and Northwest Territories have completed devolution and resource revenue sharing agreements while negotiations with Nunavut continue. The Northwest Territories also says that when a mine stops operations the reduced activity reduces its tax revenue and may cause the population to decrease, which affects the federal transfers it receives.
Evidence: Department of Finance Canada: Territorial Formula Financing; Government of the Northwest Territories, Department of Finance: Budget Address 2026-2027 and Fiscal Review (Budget Papers)
The sources let the territories be compared only on what each says about itself: the Northwest Territories on the closure of diamond mines, Yukon on a closed gold mine, Nunavut on gold and iron ore, and all three on federal formula financing. None tests whether these differences account for the gaps between the territories, and the territories' published surveys are not comparable with the provincial series.
What it influences
Relationships recorded in the relationship graph. Only connections with an edge in the graph are labelled here, and the label means exactly what the graph records: an association or a stated mechanism whose size is not established.
The relationship graph records that Alberta's budget publishes a sensitivity of its finances to the WTI price. The Budget 2026 fiscal plan puts the net impact of a fall of one US dollar a barrel at about $680 million over a full year and says sensitivities can vary significantly at different price levels; the first-quarter update does not republish it. It is a budget model estimate, and the 2026-27 swing shows the direction, not the size, of the sensitivity.
Evidence: National Bank Economics summary of Alberta Budget 2026 revenue sensitivities; Government of Alberta (Treasury Board and Finance): Budget 2026: Focused on what matters, Fiscal Plan 2026-29 (Open Government Licence - Alberta)
The relationship graph records an observed association between oil-price changes and Alberta employment changes. It is a correlation computed by Northline, not a causal estimate, and it does not show that the oil price drives Alberta's hiring.
The fall in non-permanent residents could reduce housing demand beyond rentals. The graph records this as a hypothesis. Manitoba's budget says inventory conditions remained tight at the end of 2025, at 2.6 months against 4.5 nationally.
Evidence: Statistics Canada: The Daily: Canada's population estimates, second quarter 2026
CMHC says rental demand in Winnipeg is heavily influenced by immigration, particularly non-permanent residents, and expects rental vacancy to rise to its highest in over 20 years.
Evidence: CMHC: Housing Market Outlook 2026 (Winnipeg CMA and Prairies sections; forecasts as of 15 January 2026); Canada Mortgage and Housing Corporation: Rental Market Report 2025: major centres (web edition)
The graph records, from the Bank of Canada, that a substantial share of what the Alberta oil sands industry buys comes from other provinces, so an oil-price shock is felt outside Alberta. The statement does not name the provinces, and this note does not attribute any other province's outcome to it.
Evidence: relationship: Alberta and Other provinces (collectively)
The graph records that population growth raises the number of households that need housing and that CMHC frames its housing supply gap around population and affordability. In the provinces where the tables above show slower population growth, this connection would imply less pressure on housing demand; how quickly construction responds is not measured here.
Evidence: Statistics Canada: The Daily: Canada's population estimates, second quarter 2026; Canada Mortgage and Housing Corporation: Fall 2026 Housing Supply Report
The graph records that changes in United States border measures could affect Canadian manufacturers that export to the United States, and that the effect of any specific measure is not documented. The manufacturing employment shares in the table above show where such an effect could reach provincial labour markets; it is not shown that it has.
Evidence: Statistics Canada: The Daily: Canadian international merchandise trade, August 2026
The connections above point at different provinces: the oil price at Alberta and Saskatchewan, population policy at the provinces that depend on international migration, and trade measures at the manufacturing provinces. That is the research desk's grouping. The graph has no edge that connects any of these to a provincial wage or unemployment series, so no such effect is claimed.
Risks
Alberta says the wider discount on its heavy oil primarily reflects increased competition from Venezuelan crude and additional heavy oil supply from releases from the U.S. Strategic Petroleum Reserve, that inflation accelerated from 1.8 per cent in February to as high as 4.2 per cent in July, and that ongoing geopolitical instability and related revenue volatility are significant risks to its fiscal outlook.
Saskatchewan's first-quarter report ties the improved fiscal outlook to higher-than-budgeted oil prices, which means the improvement can reverse if prices fall.
Evidence: Government of Saskatchewan, Ministry of Finance: 2026-27 First Quarter Financial Report
The Canada Energy Regulator says most producing fields off Newfoundland and Labrador are mature and decline gradually, and that new development depends on costs, market conditions and competitiveness against Guyana, Brazil, the US Gulf of Mexico and Norway.
Ontario's March budget said global trade tensions and the associated uncertainty were the main risks to its outlook and modelled a slower-growth scenario in which the United States withdraws from the Canada-United States-Mexico Agreement. Its October update says the fiscal outlook has deteriorated since the budget, reflecting ongoing economic uncertainty and the impacts of US tariffs and trade disruptions.
Evidence: Government of Ontario, Ministry of Finance: 2026 Ontario Budget, Chapter 2: Economic Performance and Outlook; Government of Ontario, Ministry of Finance: 2026 Ontario Economic Outlook and Fiscal Review: Backgrounder: Economic and Fiscal Overview
New Brunswick estimates that export value affected by the newly imposed Section 338 tariffs and bans is roughly 115.1 million dollars, about 0.7 per cent of 2025 exports, and its first-quarter update says those tariffs alone could affect about 500 jobs.
Evidence: Government of New Brunswick: New Brunswick supports local business as U.S. tariffs escalate; Government of New Brunswick, Department of Finance and Treasury Board: First-quarter financial results for 2026-27
Nova Scotia's budget warned that the review of CUSMA in July 2026 could result in an adverse scenario in which members withdraw. At that review the United States did not agree to renew the agreement, so it was not renewed; it remains in force until 2036.
Evidence: Government of Nova Scotia, Finance and Treasury Board: Nova Scotia Budget 2026-2027 (budget document, PDF); Office of the United States Trade Representative: Ambassador Greer Issues Statement on the USMCA Joint Review; Global Affairs Canada: Statement by Minister LeBlanc following trilateral CUSMA joint review meeting
Manitoba's budget says the CUSMA review creates uncertainty, and credits diversification toward non-US markets with partly offsetting weaker US-bound exports. Its text predates the review.
Evidence: Government of Manitoba (Manitoba Finance): Manitoba Budget 2026 (tabled 24 March 2026)
On Equalization, the budget says the program is a fixed pot, so lower fiscal capacity growth in larger provinces could reduce Manitoba's payments, and that the next review must be completed by 31 March 2029.
Evidence: Government of Manitoba (Manitoba Finance): Manitoba Budget 2026 (tabled 24 March 2026)
Finance Canada says the next renewal of Equalization must take place before March 31, 2029. For a province whose revenue leans on the formula, the outcome is a risk the sources identify but do not size.
Evidence: Department of Finance Canada: Equalization Program
British Columbia lists its main downside risks as a worsening global trade conflict, broadening inflationary pressure from the conflict in the Middle East, a global climate of uncertainty that slows investment, and housing market weakness, and forecasts deficits of 13.8 billion dollars in 2026-27 and 12.0 billion in 2028-29.
Evidence: Government of British Columbia, Ministry of Finance: First Quarterly Report 2026/27
Saskatchewan's budget says the current range of tariffs by the United States, India and China remains a downside risk, that tighter immigration policy could ripple through the labour supply and slow investment in housing, and that structural labour shortages will likely continue as baby boomers leave the workforce.
Evidence: Government of Saskatchewan, Ministry of Finance: 2026-27 Budget: Protecting Saskatchewan
The Northwest Territories says there are currently no new or potential mining projects large enough to replace the economic footprint of the diamond mines, that future mining is likely to be smaller-scale, and that labour shortages are a continuous challenge because of the small resident workforce.
CMHC says that in Nunavut effects of tariffs should track national trends with greater sensitivity because of less economic diversification, and that utility costs are higher in the North, partly because of isolated grids and reliance on diesel generation.
Evidence: Canada Mortgage and Housing Corporation: Northern Housing Report
Three risks recur across jurisdictions in the sources: commodity prices (Alberta, Saskatchewan, Newfoundland and Labrador, and the mining territories), United States trade policy and the CUSMA review (nearly every province), and the Equalization renewal that must happen before the deadline the sources give (the provinces that receive it). The sources do not weigh them against each other.
What to watch
- Provincial unemployment, wages and consumer prices as they are released; the latest unemployment period in this note is October 2026, wages October 2026 and consumer prices September 2026.
- Statistics Canada's quarterly population estimates, for the components in the migration table; the latest period is 1 July 2026.
- Annual provincial GDP; the latest period in the series is 2025, so the long-run table lags the sources quoted above.
- What follows the July 2026 review of the Canada-United States-Mexico Agreement, which several provincial budgets named among their uncertainties.
- Fiscal updates and the next budgets of the provinces named in the fiscal section, for revisions to the oil-price, tariff and population assumptions quoted above.
- The Equalization renewal and the Nunavut devolution timetable, below.
The federal government says the transfer of responsibilities to Nunavut is to be completed by April 1, 2027.
Evidence: Crown-Indigenous Relations and Northern Affairs Canada: Nunavut devolution
Method and limits
Every explanation is a statement by the named publisher, with a link to the source. Statements are drawn from the sourced province and territory notes, which carry their own caveats. Forecasts, where they appear, are the publishers' and not Northline's. Debt and deficit ratios are defined by each government and are not like-for-like. Provincial wage and productivity explanations are thin, and the sources contain no cross-provincial measure of public-sector size. The territories use different surveys and fiscal arrangements from the provinces and are never ranked against them. Statements about cities describe those cities, not the province. Correlations in the graph are not causal estimates.
Keep exploring
- Compare these places
- Canada dashboard
- Ten provincial labour markets: who is tight, who is slack, and what the rate hides
- Where the money comes from is not where the jobs are: Alberta’s energy paradox
- Three ways to grow or shrink: the flows behind each province’s population
Related research
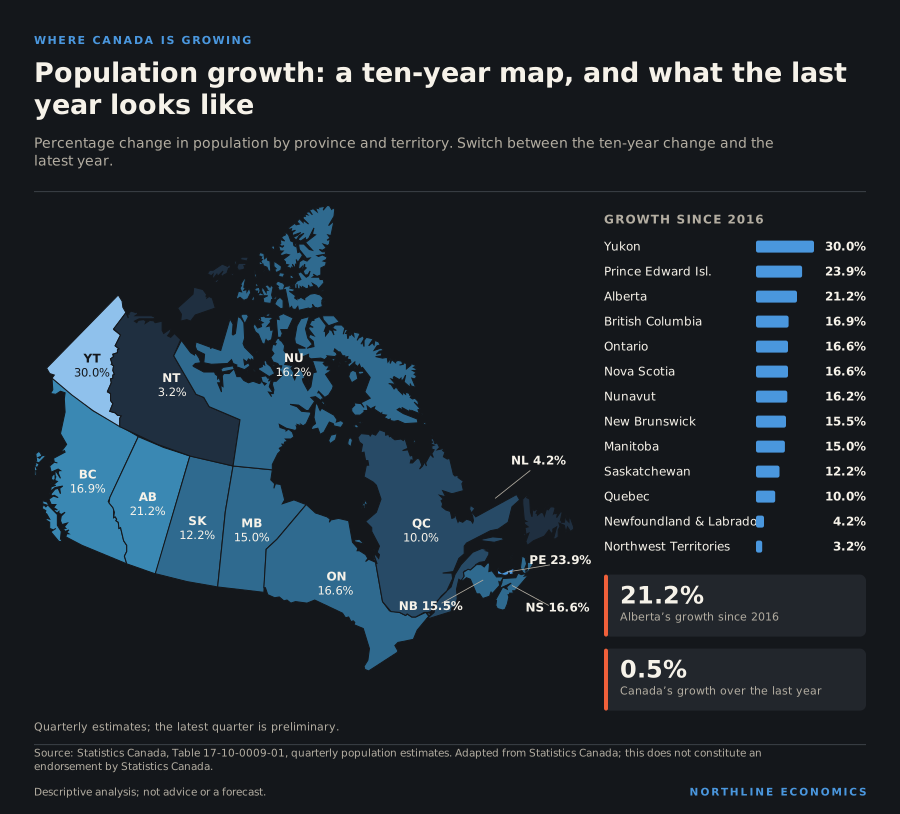
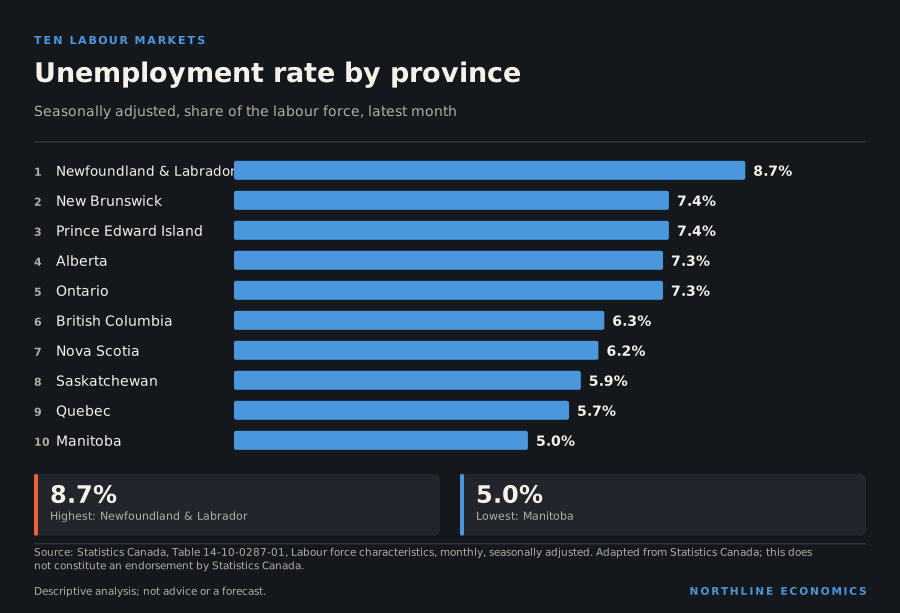
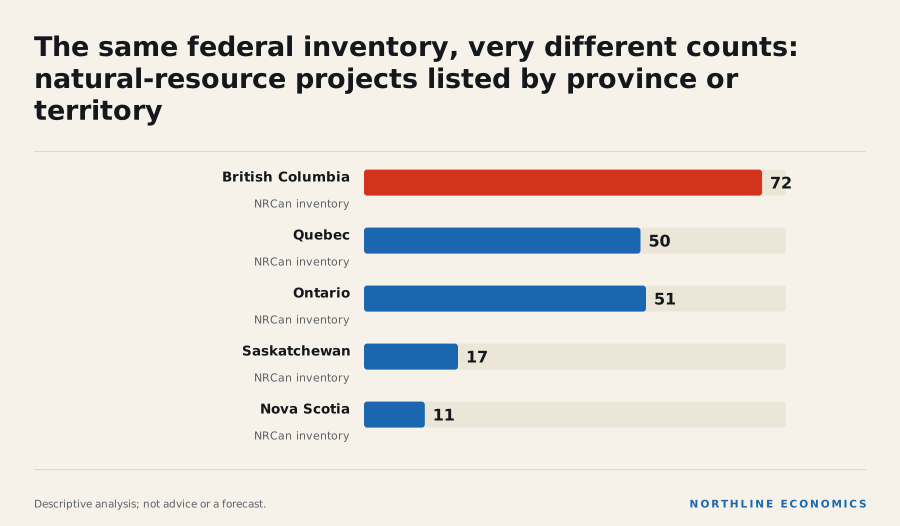
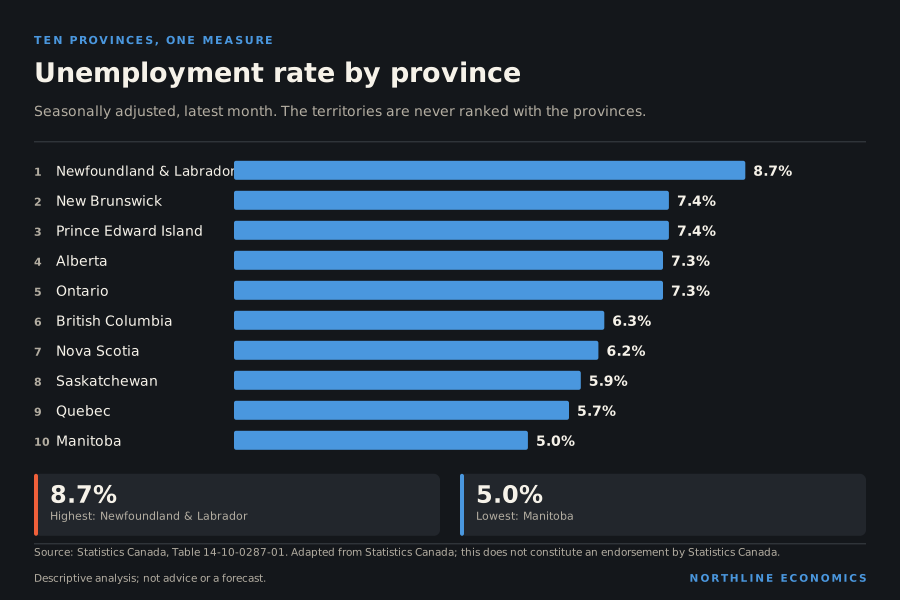
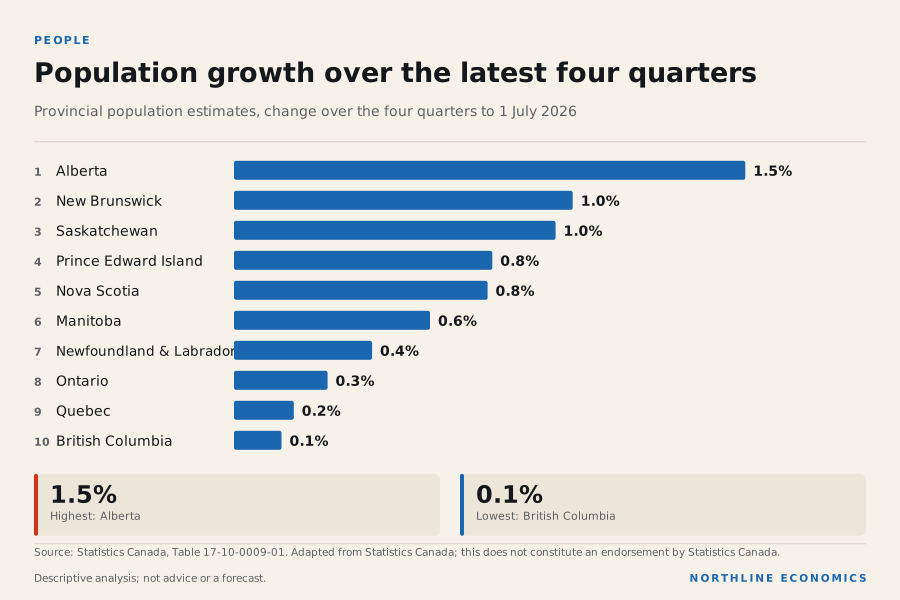
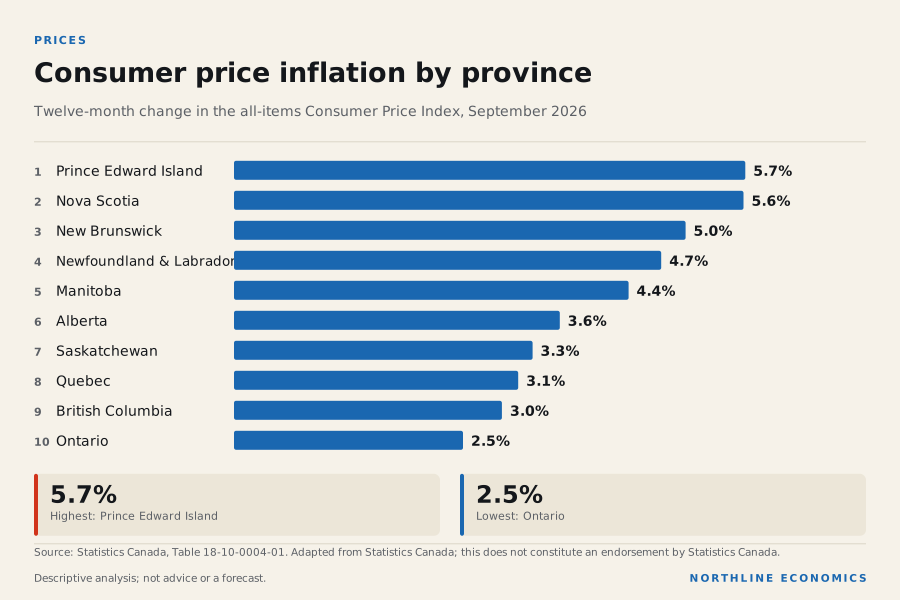
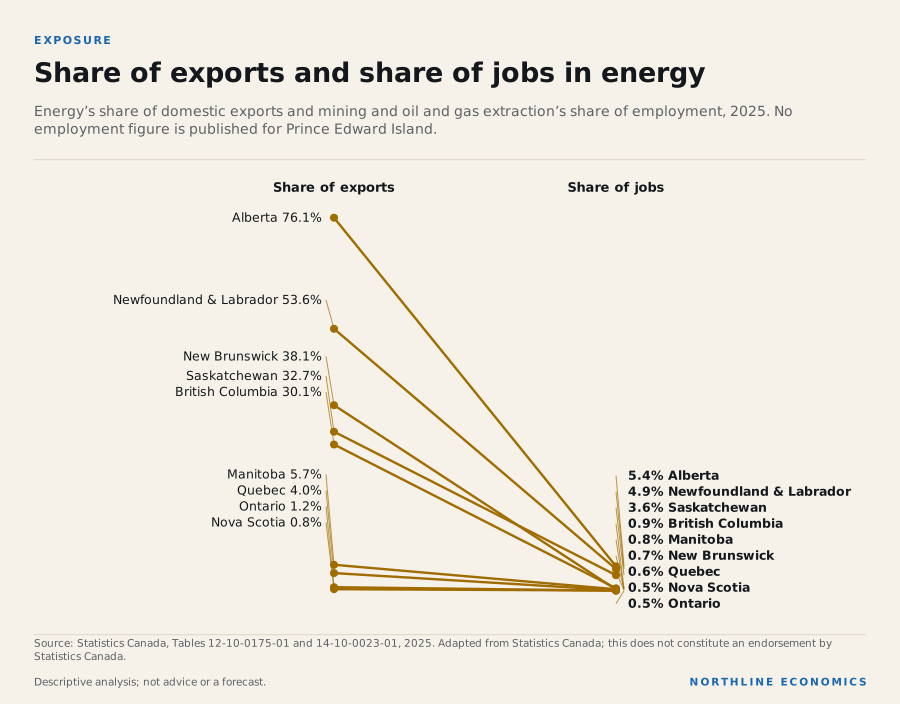
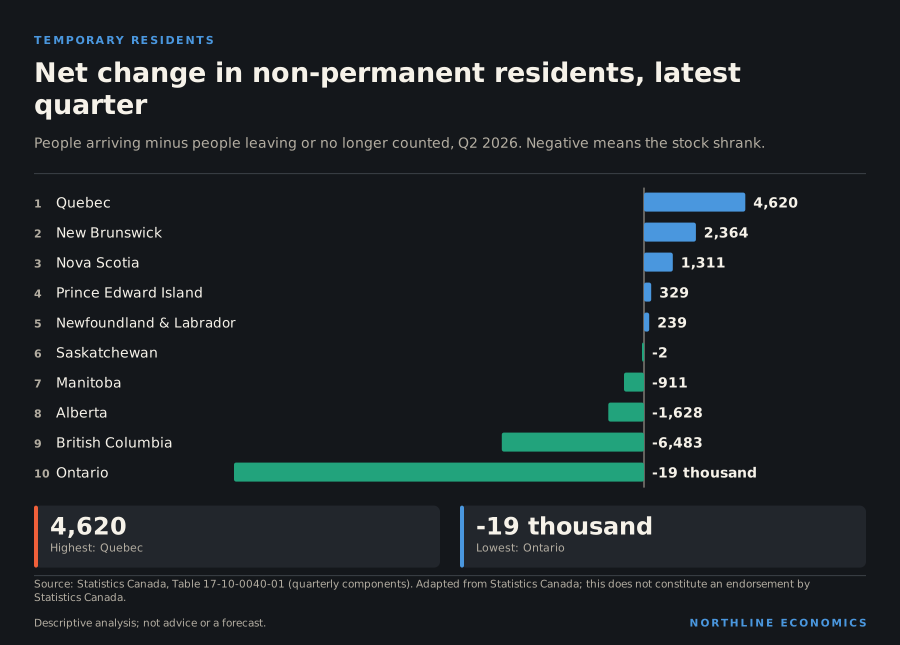
Sources, method and limits
- Limitations
- Observed differences come from published series; explanations are attributed statements by the named publishers, not Northline findings. Provinces and territories are never ranked together. Government debt and deficit ratios are defined differently by each government. No source cited compares public-sector size across provinces. Correlations in the graph are not causal estimates.
- Preparation
- Prepared by the Northline research desk with AI assistance; every figure is read from the data library or a cited source at build time.
Data
- Labour force characteristics, monthly, seasonally adjusted and trend-cycle (14-10-0287-01; 10 series; latest October 2026; retrieved 2026-11-07). Adapted from Statistics Canada, Labour force characteristics, monthly, seasonally adjusted and trend-cycle, Table 14-10-0287-01. This does not constitute an endorsement by Statistics Canada.
- Employee wages by industry, monthly, unadjusted for seasonality (14-10-0063-01; 10 series; latest October 2026; retrieved 2026-11-07). Adapted from Statistics Canada, Employee wages by industry, monthly, unadjusted for seasonality, Table 14-10-0063-01. This does not constitute an endorsement by Statistics Canada.
- Consumer Price Index, monthly, not seasonally adjusted (18-10-0004-01; 10 series; latest September 2026; retrieved 2026-10-23). Adapted from Statistics Canada, Consumer Price Index, monthly, not seasonally adjusted, Table 18-10-0004-01. This does not constitute an endorsement by Statistics Canada.
- Population estimates, quarterly (17-10-0009-01; 13 series; latest 1 July 2026; retrieved 2026-10-23). Adapted from Statistics Canada, Population estimates, quarterly, Table 17-10-0009-01. This does not constitute an endorsement by Statistics Canada.
- Canada Mortgage and Housing Corporation, housing starts, all areas, Canada and provinces, seasonally adjusted at annual rates, monthly (34-10-0158-01; 10 series; latest September 2026; retrieved 2026-10-23). Adapted from Statistics Canada, Canada Mortgage and Housing Corporation, housing starts, all areas, Canada and provinces, seasonally adjusted at annual rates, monthly, Table 34-10-0158-01. This does not constitute an endorsement by Statistics Canada.
- Gross domestic product, expenditure-based, provincial and territorial, annual (36-10-0222-01; 13 series; latest 2025; retrieved 2026-11-07). Adapted from Statistics Canada, Gross domestic product, expenditure-based, provincial and territorial, annual, Table 36-10-0222-01. This does not constitute an endorsement by Statistics Canada.
- Average weekly earnings by industry, monthly, unadjusted for seasonality (14-10-0203-01; 3 series; latest August 2026; retrieved 2026-11-05). Adapted from Statistics Canada, Average weekly earnings by industry, monthly, unadjusted for seasonality, Table 14-10-0203-01. This does not constitute an endorsement by Statistics Canada.
- Gross domestic product (GDP) at basic prices, by industry, provinces and territories (36-10-0711-01; 12 series; latest 2025; retrieved 2026-11-07). Adapted from Statistics Canada, Gross domestic product (GDP) at basic prices, by industry, provinces and territories, Table 36-10-0711-01. This does not constitute an endorsement by Statistics Canada.
- Estimates of the components of international migration, quarterly (17-10-0040-01; 20 series; latest Q2 2026; retrieved 2026-10-23). Adapted from Statistics Canada, Estimates of the components of international migration, quarterly, Table 17-10-0040-01. This does not constitute an endorsement by Statistics Canada.
- Estimates of the components of interprovincial migration, quarterly (17-10-0020-01; 23 series; latest Q2 2026; retrieved 2026-10-23). Adapted from Statistics Canada, Estimates of the components of interprovincial migration, quarterly, Table 17-10-0020-01. This does not constitute an endorsement by Statistics Canada.
Documents
- Statistics Canada: The Daily: Canada's population estimates, second quarter 2026 (retrieved 2026-10-25)
- Government of Alberta (Treasury Board and Finance): 2026-27 First Quarter Fiscal Update and Economic Statement (retrieved 2026-10-25)
- Government of Saskatchewan, Ministry of Finance: 2026-27 Budget: Protecting Saskatchewan (retrieved 2026-10-25)
- Manitoba Bureau of Statistics: Labour Force Survey: Manitoba, August 2026 (bulletin) (retrieved 2026-10-25)
- Statistics Canada: Labour Force Survey, October 2026 (The Daily) (retrieved 2026-11-07)
- Government of British Columbia, Ministry of Finance: First Quarterly Report 2026/27 (retrieved 2026-10-25)
- Statistics Canada: The Daily: Gross domestic product by industry: Provinces and territories, 2025 (retrieved 2026-10-25)
- Government of Nova Scotia, Finance and Treasury Board (summarizing Statistics Canada): Provincial GDP by Industry 2025 [Preliminary] (retrieved 2026-10-25)
- Government of Prince Edward Island, PEI Statistics Bureau: 52nd Annual Statistical Review 2025 (Economic Review 2025) (retrieved 2026-10-25)
- Government of New Brunswick, Department of Finance and Treasury Board: 2026-2027 Economic Outlook (tabled with Budget 2026-27) (retrieved 2026-10-25)
- Statistics Canada: The Daily: Gross domestic product by industry: Provinces and territories, 2025 (retrieved 2026-10-25)
- Government of Alberta (Treasury Board and Finance): 2025-26 Final Results: Year-End Report (retrieved 2026-10-25)
- Government of Saskatchewan, Ministry of Finance (Provincial Treasury): Fall 2026 Investor Presentation (retrieved 2026-10-25)
- Government of Newfoundland and Labrador, Department of Finance: Budget 2026 Delivers Opportunity For All of Us (news release and backgrounder) (retrieved 2026-10-25)
- Government of Newfoundland and Labrador, Department of Finance: Budget 2026: The Economy (retrieved 2026-10-25)
- Government of New Brunswick, Department of Finance and Treasury Board: Fiscal and Economic Update, First Quarter 2026-2027 (retrieved 2026-10-25)
- Manitoba Hydro (Crown corporation): Manitoba Hydro releases 75th Annual Report (news release, September 2026) (retrieved 2026-10-25)
- Statistics Canada: Gross domestic product by industry: Provinces and territories, 2025 (retrieved 2026-10-25)
- Government of British Columbia, Ministry of Finance: Budget and Fiscal Plan 2026/27 to 2028/29 (full document) (retrieved 2026-10-25)
- Financial Accountability Office of Ontario: Economic and Budget Outlook, Summer 2026 (retrieved 2026-10-25)
- Government of Ontario, Ministry of Finance: 2026 Ontario Budget, Chapter 2: Economic Performance and Outlook (retrieved 2026-10-25)
- Institut de la statistique du Québec: Québec's international merchandise exports up 2.9% in December 2025 (retrieved 2026-10-25)
- Office of the United States Trade Representative: Ambassador Greer Issues Statement on the USMCA Joint Review (retrieved 2026-11-06)
- Government of Nova Scotia, Finance and Treasury Board: Nova Scotia Budget 2026-2027 (budget document, PDF) (retrieved 2026-10-25)
- Government of Manitoba (Manitoba Finance): Manitoba Budget 2026 (tabled 24 March 2026) (retrieved 2026-10-25)
- Government of Alberta (Treasury Board and Finance): Economic Trends, August 2025 (retrieved 2026-10-25)
- Government of New Brunswick: New Brunswick supports local business as U.S. tariffs escalate (retrieved 2026-10-25)
- Financial Accountability Office of Ontario: Ontario Economic Monitor: October 2025 to March 2026 (retrieved 2026-10-25)
- Institut de la statistique du Québec: This year's demographic projections: population stabilization scenario maintained for Québec (retrieved 2026-10-25)
- Saskatchewan Bureau of Statistics: Quarterly Population Growth, First Quarter 2026 (retrieved 2026-10-25)
- Government of Nova Scotia, Finance and Treasury Board: Nova Scotia Annual Population Estimates as of July 1, 2026 (retrieved 2026-10-25)
- Government of Newfoundland and Labrador, Department of Finance (Economics Division), from Statistics Canada estimates: Population stood at 552,462 as of July 1, 2026 (retrieved 2026-10-25)
- Government of Nova Scotia, Finance and Treasury Board (summarizing CMHC): Housing Starts, December and Annual 2025 (retrieved 2026-10-25)
- Government of Nova Scotia: Residential Tenancies Program: legislative changes (retrieved 2026-10-25)
- CMHC: Summer Update: 2026 Housing Market Outlook (retrieved 2026-10-25)
- Canada Mortgage and Housing Corporation: Fall 2026 Housing Supply Report (retrieved 2026-10-25)
- Government of British Columbia, Ministry of Housing: Nearly 90% of B.C. communities have adopted small-scale multi-unit housing legislation (retrieved 2026-10-25)
- Finance Canada: Major federal transfers (retrieved 2026-10-25)
- Finance Canada: Equalization Program (retrieved 2026-10-25)
- Finance Canada: Chart 1: Equalization 2026-27 (chart on the Equalization program page) (retrieved 2026-11-07)
- Department of Finance Canada: Equalization Program (page dated 2025-12-11; 2026-27 figures) (retrieved 2026-10-25)
- Department of Finance Canada: Equalization Program (2026-27) (retrieved 2026-10-25)
- Department of Finance Canada: Canada Health Transfer (retrieved 2026-10-25)
- Institut de la statistique du Québec: PIB réel du Québec : baisse de 0,1 % en juillet 2026 (communiqué, 27 octobre 2026) (retrieved 2026-11-07)
- Institut de la statistique du Québec: Québec real GDP down 0.1% in May 2026 (retrieved 2026-10-25)
- Government of New Brunswick, Department of Finance and Treasury Board: Budget 2026-27: Putting New Brunswickers first (retrieved 2026-10-25)
- Government of Nova Scotia, Finance and Treasury Board (summarizing Statistics Canada SEPH): Payroll Employment and Average Weekly Earnings, January 2026 (retrieved 2026-10-25)
- Government of the Northwest Territories, Department of Finance: Budget Papers 2026-2027: Northwest Territories Economic Outlook (retrieved 2026-10-25)
- Employment and Social Development Canada (Job Bank): Economic Scan - Yukon, Northwest Territories and Nunavut: 2026 (retrieved 2026-10-25)
- Government of New Brunswick, Department of Finance and Treasury Board: The New Brunswick Economy: 2024 in Review (retrieved 2026-10-25)
- Government of Manitoba (Manitoba Finance): Economic, Fiscal, and Borrowing Overview, Winnipeg Investor Relations Presentation, 9 April 2026 (retrieved 2026-10-25)
- Atlantic Canada Opportunities Agency: 2026-27 Departmental Plan: Operating context (retrieved 2026-10-25)
- Statistics Canada: The Daily: Provincial and territorial economic accounts, 2025 (retrieved 2026-11-07)
- Canada Mortgage and Housing Corporation: Northern Housing Report (retrieved 2026-10-25)
- Government of Nunavut, Department of Finance: Budget 2026-27 Fiscal and Economic Indicators (retrieved 2026-10-25)
- Government of Ontario, Ministry of Finance: 2026 Ontario Economic Outlook and Fiscal Review: Backgrounder: Economic and Fiscal Overview (retrieved 2026-11-07)
- Government of Ontario, Ministry of Finance: 2026 Ontario Budget: Ontario's Economic and Fiscal Outlook in Brief (retrieved 2026-10-25)
- Government of Saskatchewan, Ministry of Finance: 2026-27 First Quarter Financial Report (retrieved 2026-10-25)
- Government of Ontario, Ministry of Finance: 2026 Ontario Budget, Chapter 3: Ontario's Fiscal Plan and Outlook (retrieved 2026-10-25)
- Government of New Brunswick, Department of Finance and Treasury Board: First-quarter financial results for 2026-27 (retrieved 2026-10-25)
- Government of Prince Edward Island, Department of Finance and Affordability: Estimates of Revenue and Expenditures 2026-2027 (retrieved 2026-11-07)
- Canada Energy Regulator: Nova Scotia Energy Profile (provincial and territorial energy profiles) (retrieved 2026-10-25)
- Department of Finance Canada: Newfoundland and Labrador Offshore Arrangements (retrieved 2026-10-25)
- Canada Energy Regulator: Market Snapshot: Trans Mountain Expansion eases pipeline constraints and increases exports to overseas markets (retrieved 2026-10-25)
- Gouvernement du Québec, ministère des Finances: Budget 2026-2027 - Press release no. 1 of 3 - A responsible budget with targeted measures for Quebecers (retrieved 2026-10-25)
- Government of Prince Edward Island: Residential Tenancy Act (current to May 16, 2025) (retrieved 2026-10-25)
- Department of Finance Canada: Major federal transfers (retrieved 2026-10-25)
- Statistics Canada: Table 1: Number of Canadian exporting establishments and the share that sold to the United States, by province, 2024 and 2025 (retrieved 2026-10-25)
- Gouvernement du Québec, ministère des Finances: Publication des Comptes publics 2025-2026 du gouvernement (17 juillet 2026) (retrieved 2026-11-07)
- Government of Ontario: Public Accounts 2025-26: Annual report (retrieved 2026-10-25)
- Gouvernement du Québec, Cabinet du premier ministre: Le premier ministre du Québec dévoile son Conseil des ministres (21 octobre 2026) (retrieved 2026-11-07)
- Financial Accountability Office of Ontario: Impacts of US Tariffs on Ontario's Economy (April 2025) (retrieved 2026-10-25)
- Government of Nova Scotia, Finance and Treasury Board: Nova Scotia Budget 2026-27 (Economics and Statistics Daily Stats) (retrieved 2026-10-25)
- Department of Finance Canada: Federal transfers to provinces and territories: major federal transfers, 2017-18 to 2026-27 (retrieved 2026-10-25)
- Statistics Canada: The Daily: Canadian Income Survey, 2024 (retrieved 2026-10-25)
- NWT Bureau of Statistics (Statistics Canada estimates): Gross Domestic Product, Northwest Territories, 2025 Initial (retrieved 2026-10-25)
- Department of Finance Canada: Letters to Provinces and Territories: Northwest Territories 2024 (2025-26 transfer payments) (retrieved 2026-10-25)
- Department of Finance Canada: Territorial Formula Financing (retrieved 2026-10-25)
- Government of the Northwest Territories, Department of Finance: Budget Address 2026-2027 and Fiscal Review (Budget Papers) (retrieved 2026-10-25)
- Government of Alberta (Treasury Board and Finance): Budget 2026: Focused on what matters, Fiscal Plan 2026-29 (Open Government Licence - Alberta) (retrieved 2026-11-07)
- CMHC: Housing Market Outlook 2026 (Winnipeg CMA and Prairies sections; forecasts as of 15 January 2026) (retrieved 2026-10-25)
- Canada Energy Regulator: Market Snapshot: Canada-Newfoundland and Labrador Offshore Oil Production: Mature Fields and New Frontiers (retrieved 2026-10-25)
- Global Affairs Canada: Statement by Minister LeBlanc following trilateral CUSMA joint review meeting (retrieved 2026-11-06)
- Department of Finance Canada: Equalization Program (retrieved 2026-10-25)
- Crown-Indigenous Relations and Northern Affairs Canada: Nunavut devolution (retrieved 2026-10-25)
- Government of British Columbia, Ministry of Finance: Budget 2026: Fiscal Plan (web summary) (retrieved 2026-10-25)
Approved by an editor on 2026-11-09; published 2026-11-09. See the corrections log.