Research
Beyond the border: who else Canada sells to and buys from, 2025
Canada sold more to the United Kingdom than to the whole European Union in 2025, and bought more from Mexico than from Germany and Japan combined. The partner table shows a trade map with a very different shape on each side.
By Northline research deskUpdated 2026-11-0610 min readData to September 2026
The data behind this graphic
| Item | Value |
|---|---|
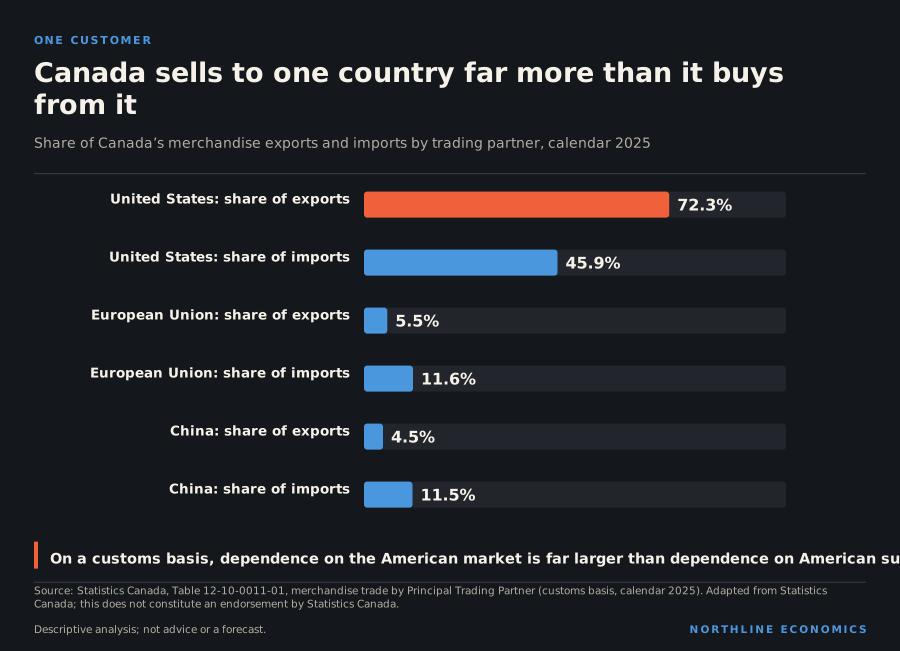
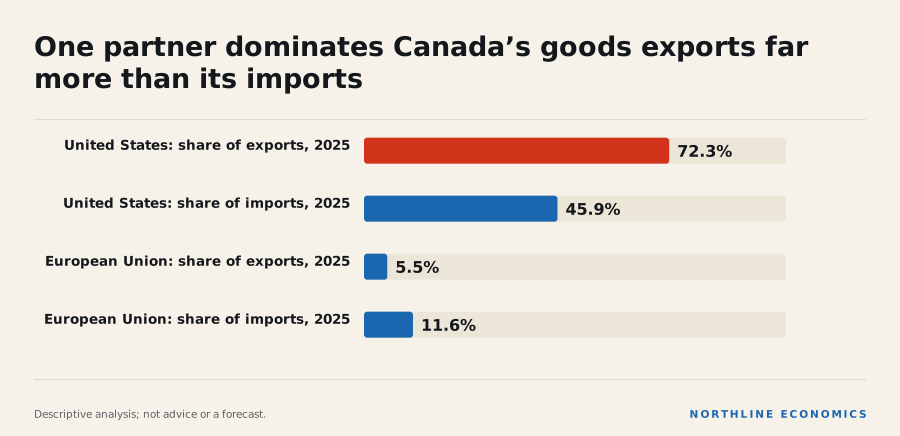
| United States: share of exports, 2025 | 72.3% |
| United States: share of imports, 2025 | 45.9% |
| European Union: share of exports, 2025 | 5.5% |
| European Union: share of imports, 2025 | 11.6% |
Summary
In calendar 2025 the United States took 72.3% of Canada’s merchandise exports and supplied 45.9% of its imports. The companion note, One customer, many products, takes up that relationship. This note looks at everyone else, and at what the partner table shows about whom Canada actually trades with.
The table covers customs-basis merchandise trade, summed from twelve monthly values for 2025, for the United States, the European Union, twenty-six individual countries and the all-countries total. Values are in Canadian dollars. Because the European Union is a bloc and its member countries are also listed, rows must not be added together.
Where Canada sold, outside the United States
The data behind this graphic
| Item | Value |
|---|---|
| United Kingdom | C$47 billion |
| China | C$35 billion |
| Japan | C$15 billion |
| Netherlands | C$10 billion |
| Germany | C$9 billion |
| Mexico | C$9 billion |
| South Korea | C$7 billion |
| France | C$5 billion |
| Italy | C$4 billion |
| Belgium | C$4 billion |
| India | C$4 billion |
| Hong Kong | C$4 billion |
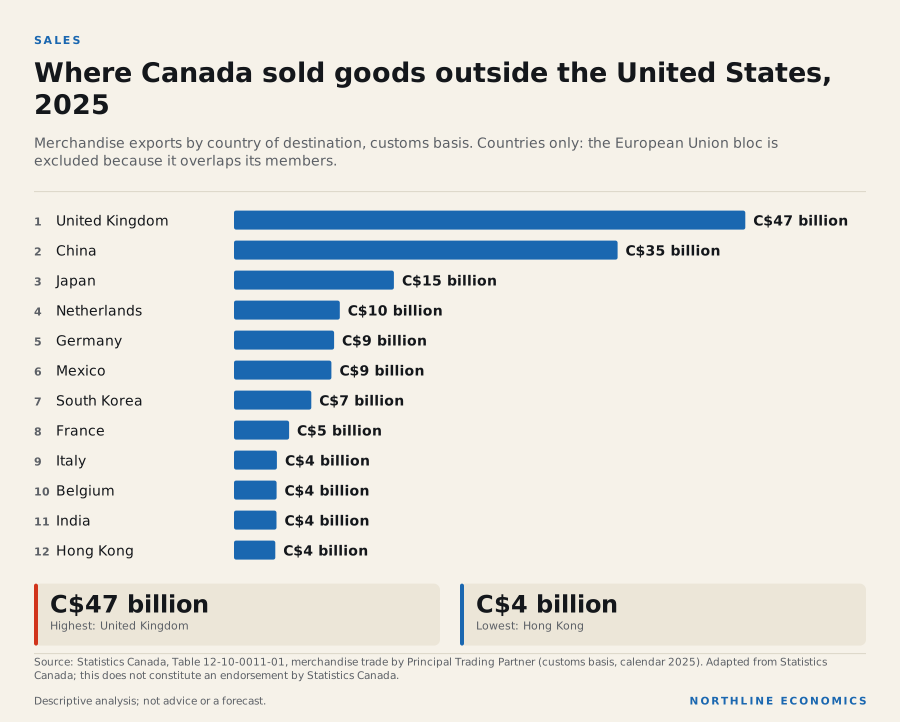
The United Kingdom was the largest destination after the United States, at C$47 billion. That is 6.0% of exports, more than the 5.5%, or C$43 billion, that went to the European Union as a bloc. China took C$35 billion, Japan C$15 billion, and Mexico C$9 billion. Among European countries, the Netherlands took C$10 billion and Germany C$9 billion.
The size of the United Kingdom figure deserves a flag. On the monthly series, which are on a balance-of-payments basis and are not comparable with the table, exports to the United Kingdom summed to about C$74.9 billion over the twelve months to September 2026, and the series rose sharply during 2025. A single destination changing by that much in a year may mean that one product or a small number of shipments account for much of the movement. The partner table does not break exports into products, so this note cannot say which. A reader who needs to rely on the United Kingdom figure should check the product detail before drawing a conclusion about demand.
Beyond the first few, destinations are small in value. After the top six, they run in single-digit billions: South Korea C$7 billion, France C$5 billion, India C$4 billion, Hong Kong C$4 billion. Taken one by one, each is a small market for Canada, and the aggregate of all non-American destinations is where any diversification would have to come from.
Where Canada bought
The data behind this graphic
| Item | Value |
|---|---|
| China | C$91 billion |
| Mexico | C$53 billion |
| Germany | C$25 billion |
| Japan | C$21 billion |
| South Korea | C$18 billion |
| Italy | C$14 billion |
| Brazil | C$12 billion |
| Switzerland | C$10 billion |
| France | C$10 billion |
| United Kingdom | C$10 billion |
| India | C$10 billion |
| Taiwan | C$8 billion |
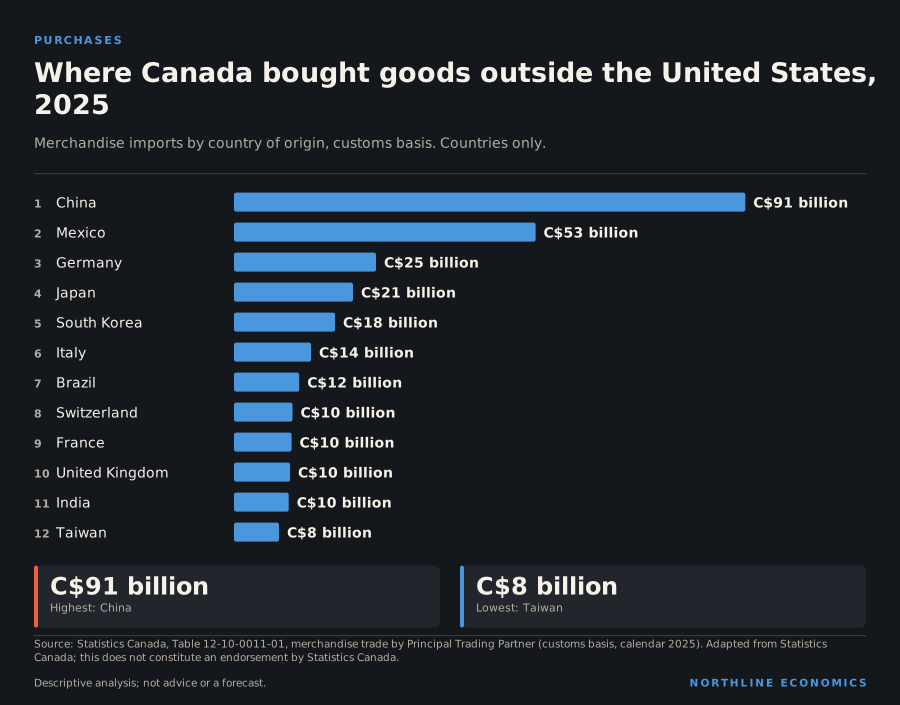
The import side is differently arranged. China was the largest source among individual countries outside the United States, at C$91 billion or 11.5% of imports. Mexico was next among individual countries, at C$53 billion, ahead of Germany at C$25 billion, Japan at C$21 billion and South Korea at C$18 billion. The European Union as a bloc supplied C$92 billion.
Canada’s import sources are numerous. American supply was 45.9% of imports, less than half, and the remainder came from dozens of countries. That breadth is the mirror image of the narrow export picture.
A spread of suppliers generally makes it easier to replace one of them than it is to replace a customer who takes most of what a producer sells. The table cannot show how easily any particular good could be replaced.
What Canada sold against what it bought
The data behind this graphic
| Item | Sold to | Bought from |
|---|---|---|
| United Kingdom | C$47 billion | C$10 billion |
| China | C$35 billion | C$91 billion |
| Japan | C$15 billion | C$21 billion |
| Germany | C$9 billion | C$25 billion |
| Mexico | C$9 billion | C$53 billion |
| South Korea | C$7 billion | C$18 billion |
| Italy | C$4 billion | C$14 billion |
| France | C$5 billion | C$10 billion |
| India | C$4 billion | C$10 billion |
| Brazil | C$3 billion | C$12 billion |
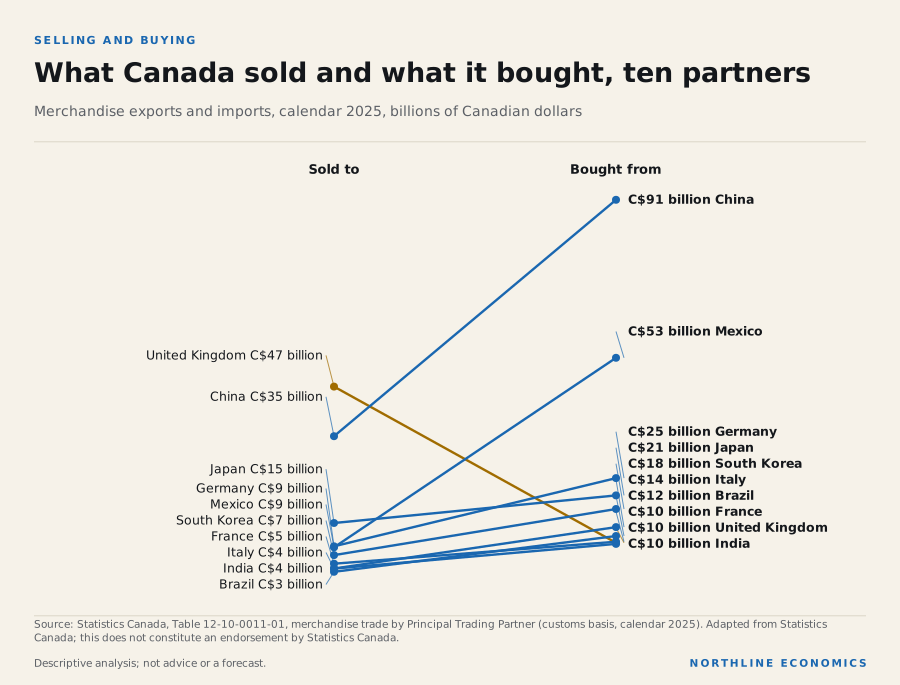
The slope graphic pairs each country’s sales and purchases. The relationships fall into three groups.
Net seller. The United Kingdom is the standout: Canada sold C$47 billion and bought C$10 billion. The United States, not shown, is the other large case.
Net buyer. China is the largest: Canada bought C$91 billion and sold C$35 billion. Mexico is the next in scale, with C$53 billion bought against C$9 billion sold. Germany, South Korea, Italy, France, India and Brazil also sold Canada more than they bought from it, by smaller amounts each.
Close to balance. Japan, at C$15 billion sold and C$21 billion bought, is the closest of the large partners.
Canada’s overall goods trade was close to balanced in 2025: exports of C$778 billion against imports of C$789 billion. The near balance is made of a large surplus with the United States and the United Kingdom set against deficits with most other partners. This is a pattern, not a problem in itself. Whether a given balance matters depends on the goods behind it, which this table does not give.
The partner balances are better read as a description of who supplies and who buys than as a score. A deficit with China is, for many Canadian businesses, a source of inputs and consumer goods, and a surplus with the United Kingdom is revenue for exporters, whichever products make it up.
A twenty-year view
The data behind this graphic
| Series | Latest |
|---|---|
| United Kingdom | C$5.0 billion, September 2026 |
| European Union | C$3.9 billion, September 2026 |
| China | C$4.4 billion, September 2026 |
| Mexico | C$950 million, September 2026 |
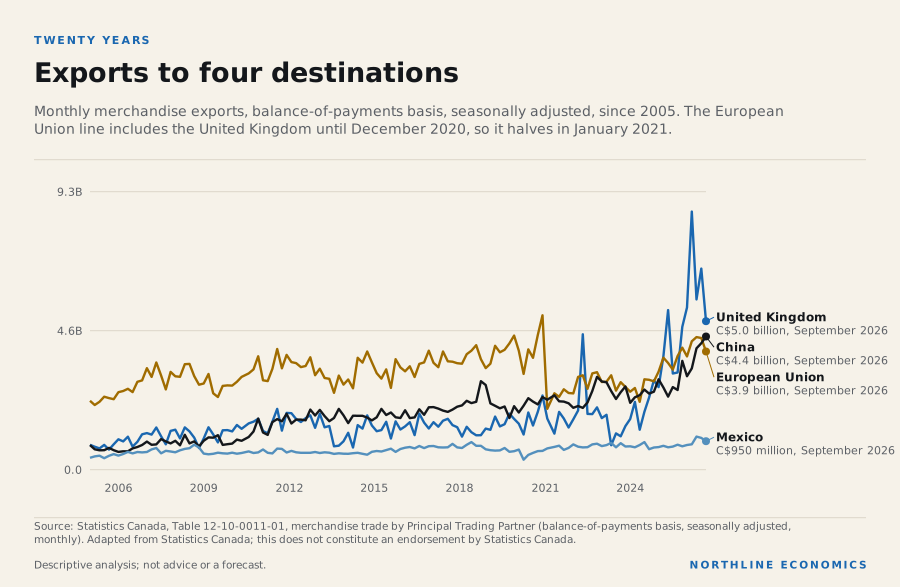
The monthly series for four destinations show how different the markets are. Exports to China rose for most of the period, from a low base. Exports to Mexico were small, though the twelve months to September 2026, at C$10.8 billion, set a high. Exports to the United Kingdom rose steeply in the last year, to C$5.0 billion in September 2026 from C$3.2 billion a year earlier.
The European Union line needs care. It halves in January 2021, from C$5.2 billion to C$2.6 billion, when the United Kingdom leaves the total: Statistics Canada’s footnote to this table says its European Union data include the United Kingdom through December 2020 and exclude it from January 2021. That is a break in the series, not a fall in sales, so earlier years cannot be compared with later ones. Since the break, exports to the European Union were little changed from 2022 to 2024 and rose in 2025.
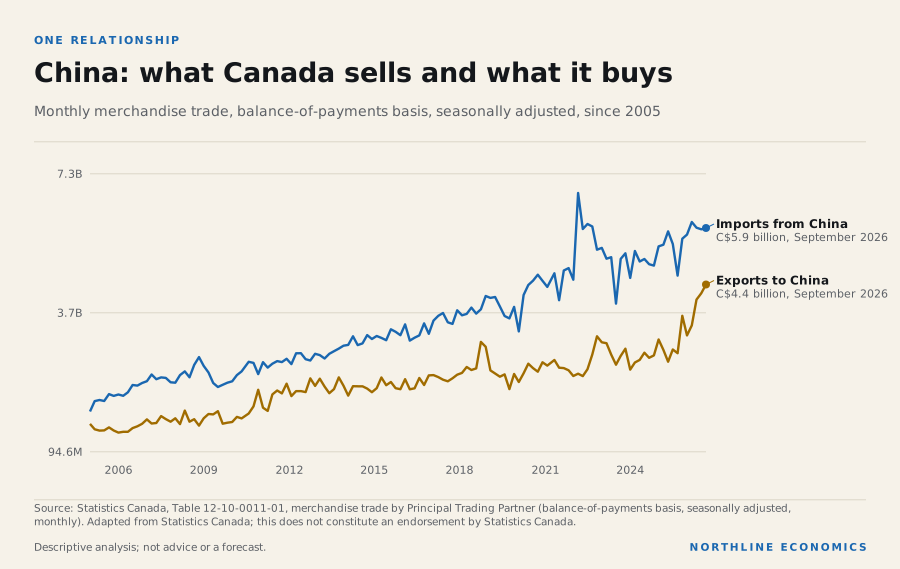
The data behind this graphic
| Series | Latest |
|---|---|
| Imports from China | C$5.9 billion, September 2026 |
| Exports to China | C$4.4 billion, September 2026 |
China shows the pattern best. Both imports from and exports to China have risen over twenty years, and the gap between them in dollars has widened, though it has narrowed since 2022. Imports were C$5.9 billion in September 2026, and exports C$4.4 billion. The trade is large in both directions and different in kind, and the chart cannot say how much of the imports are consumer goods, capital equipment or inputs for Canadian production.
Three things that look wrong and are not
A larger United Kingdom figure is not yet proof of a larger market. It led the European Union in 2025 and in each of the latest twelve months, after the European Union led every year from 2021 to 2024. Earlier years cannot be compared, because the European Union series included the United Kingdom. These series do not show which goods drive the swing.
A large deficit is not a loss. Canada’s deficit with China is the difference between two large flows, and the exports to China are substantial. What the table cannot show is how Canadian firms use the imports.
A small share is not a small market for the firms in it. Canada’s sales to India (0.5% of exports) and Australia (0.4%) are small in the total but may be the main market for the firms that make the goods. The table describes the national average.
What this means for decisions
For exporters considering new markets, the table shows where Canadian goods already find buyers outside the United States and at what scale. It does not show the products, the barriers or the competition.
For policymakers thinking about diversification, the arithmetic is plain: the non-American markets are, together, a fraction of the American one, and each is small. Changing the national share quickly would require a large increase in sales to several countries at once, or a change in what Canada sells.
For importers and manufacturers that depend on Chinese, Mexican or European inputs, the table shows how much of Canada’s purchasing comes from those places, and how little of it Canada’s own sales to them offset.
Northline does not offer trade advice. The table describes what happened in one year.
What this does not show
It does not show services trade, the dependence of any province, industry or city on a partner, or how any trade policy would change these shares. It does not break trade into products, so it cannot explain why a balance is large or small. Statistics Canada reports trade by country of destination for exports and country of origin for imports, and goods can be re-exported or transshipped, so a partner’s figure is not always the place where a good was made or finally used. One calendar year cannot show a trend.
Where to read next
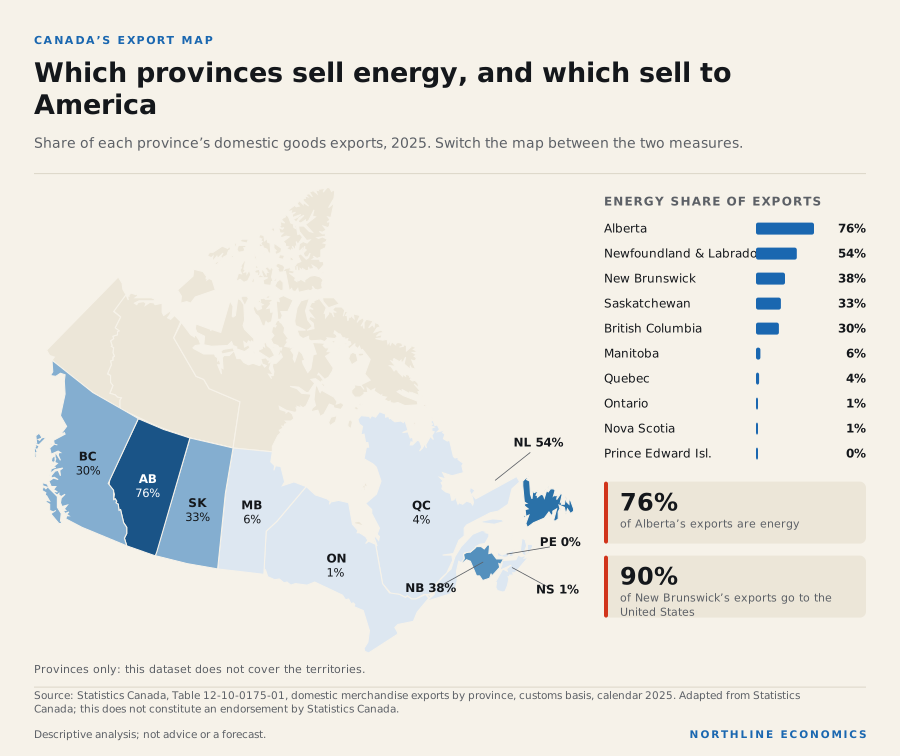
One customer, many products takes the American relationship in depth. Canada’s export map shows how provinces differ in what they sell, and where.
Method
Sum of the twelve monthly customs-basis values for calendar 2025 from Statistics Canada table 12-10-0011-01 (unadjusted); share = partner value divided by the all-countries value. Monthly series are on a balance-of-payments basis, seasonally adjusted, from the same table, and are not comparable with the annual customs-basis figures. Source: Adapted from Statistics Canada, Table 12-10-0011-01. This does not constitute an endorsement by Statistics Canada.
Keep exploring
- Canada: trade dashboard
- Explore the related relationships
- One customer, many products: Canada’s goods trade with the United States
- Canada’s export map: which provinces sell energy, and which sell to America
Related research
Sources, method and limits
- Limitations
- Goods only. The annual table is on a customs basis and covers one calendar year; the monthly series are on a balance-of-payments basis, seasonally adjusted, and are not comparable with it. Partner groupings overlap. The European Union series includes the United Kingdom through December 2020.
- Preparation
- Prepared by the Northline research desk with AI assistance; every figure is read from the data library or a cited source at build time.
Data
- International merchandise trade for all countries and by Principal Trading Partners, monthly (12-10-0011-01; 5 series; latest September 2026; retrieved 2026-11-05). Adapted from Statistics Canada, International merchandise trade for all countries and by Principal Trading Partners, monthly, Table 12-10-0011-01. This does not constitute an endorsement by Statistics Canada.
Documents
- Statistics Canada, Table 12-10-0011-01, International merchandise trade for all countries and by Principal Trading Partners, monthly (retrieved 2026-10-22)
Approved by an editor on 2026-11-09; published 2026-11-09. See the corrections log.