GlobalCanadaCities
Yukon · territory · data profile

Yukon: territorial economy at a glance

Latest values, rankings and charts for Yukon, all computed from Statistics Canada data held by this platform. The economic story below explains with attributed statements from official sources; the profile only computes. Forecasts quoted are their publishers' and Northline publishes none.

Analyze Yukon in Intelligence Studio

Opens a workspace prepared from the published Yukon measures, with what is missing stated.

The economy

What explains Yukon's recent economic path, and how do territorial finances and housing shape its prospects?

Yukon's economy was shaped by the shutdown of the Eagle Gold Mine, with mining output down sharply in 2025 while public spending kept employment rising, and housing costs and labour shortages remain constraints

What happened

Yukon's unemployment rate (three-month average, territorial survey) was 5.3% in October 2026 and its employment rate 68.9%. Its population was 2.5% higher than four quarters earlier, and net interprovincial migration over the latest four quarters was 503 people (negative is an outflow). Average weekly earnings were C$1,554 a week in August 2026.

Why it happened

Historical context

Statistics Canada reported in May 2026 that mining activity in Yukon was down 28.3 per cent in 2025 as the Eagle Gold Mine began remediation in mid-2024; its revised series of 5 November 2026 puts the fall at 20.3%.

Evidence: Statistics Canada: Gross domestic product by industry: Provinces and territories, 2025

Historical context

CMHC says the mine accounted for roughly 10% of Yukon's GDP in 2023, that mining continued to weigh heavily on the economy after the June 2024 heap leach failure, and that growth in services and non-mining goods industries partially offset the declines, with higher territorial spending driving public-sector growth and private-sector activity.

Evidence: Canada Mortgage and Housing Corporation: Northern Housing Report

Historical context

CMHC, citing Statistics Canada, reports real GDP rose 0.6 per cent in 2025 after a sharp decrease in 2024.

Evidence: Canada Mortgage and Housing Corporation: Northern Housing Report

Historical context

Job Bank's territorial scan says instead that the economy contracted in 2025 largely because of the closure of the Eagle Gold Mine; the two sources differ on 2025, and Statistics Canada's current series shows a rise of 0.6%.

Evidence: Employment and Social Development Canada (Job Bank): Economic Scan - Yukon, Northwest Territories and Nunavut: 2026

Why it matters

Historical context

Job Bank reports that Yukon had the strongest employment growth of the three territories in 2025, up 2.3 per cent with the largest gains in public administration, that its unemployment rate dropped slightly to 4.2 per cent, and that labour shortages will intensify in 2026 as reduced federal migration targets limit workforce growth across the territories.

Evidence: Employment and Social Development Canada (Job Bank): Economic Scan - Yukon, Northwest Territories and Nunavut: 2026

Historical context

CMHC says employment weakness was concentrated in mining and construction, offset in part by public-sector gains, and that 14% of Yukon's workers live elsewhere in Canada while earning income in the territory.

Evidence: Canada Mortgage and Housing Corporation: Northern Housing Report

History

Historical context

Job Bank says Yukon had positive net interprovincial migration over 2020-21 to 2024-25, which it says likely reflected the territory's comparatively stronger economic performance, and that Yukon's population grew 1.4 per cent in 2025, the largest increase among the territories. Statistics Canada's revised series puts Yukon's growth in the year to 1 July 2025 at 3.1%, still the fastest of the three.

Evidence: Employment and Social Development Canada (Job Bank): Economic Scan - Yukon, Northwest Territories and Nunavut: 2026

Historical context

CMHC reports that in 2025 Yukon also experienced net out-migration to the provinces and that tighter federal limits on international students affected Yukon more because of its larger student population. Statistics Canada's current quarterly series shows small net outflows to the other provinces only in the second half of 2025 (-13 and -7 people), after larger net inflows in the first half.

Evidence: Canada Mortgage and Housing Corporation: Northern Housing Report

Across geographies

Historical context

CMHC says Yukon and the Northwest Territories have the lowest exposure to US tariffs among provinces and territories, and that Indigenous workers earn about 12% to 20% less than non-Indigenous workers across the territories, with the gap smallest in Yukon.

Evidence: Canada Mortgage and Housing Corporation: Northern Housing Report

Historical context

Job Bank says limited economic diversification will remain a major challenge as the territories continue to rely heavily on mining. The Yukon is not a province: its surveys, GDP basis and fiscal arrangements differ, and its comparisons with the provinces in this report should be read with that in mind.

Evidence: Employment and Social Development Canada (Job Bank): Economic Scan - Yukon, Northwest Territories and Nunavut: 2026

What it influences

Historical context

CMHC reports that Whitehorse's rental vacancy rate rose to 1.9% in 2025, that median rent growth of 4.1% was the slowest since 2019, that the average home price rose 7.4% to a record, that limited developable and serviced land constrains supply, and that social housing was 35% of new residential construction investment against about 6% nationally.

Evidence: Canada Mortgage and Housing Corporation: Northern Housing Report

Historical context

The City of Whitehorse's housing needs assessment estimates a need for 3,015 homes over 2026 to 2031.

Evidence: City of Whitehorse: Whitehorse Housing Needs Assessment, January 2026

Historical context

The federal government has said it will prioritise financial and regulatory support for the British Columbia-Yukon Grid Connect, an approximately 800-kilometre transmission line proposed to support industrial development including critical minerals; it is a proposal, not a built project.

Evidence: Natural Resources Canada: Canada takes action to advance a stronger grid and increase reliable, affordable energy

Risks

Historical context

Job Bank lists short-term challenges for Yukon and the Northwest Territories in 2025: reduced mineral production, limited private investment, labour shortages, rising living costs and geopolitical uncertainty in commodity markets, and says housing shortages will remain a constraint on attracting and retaining workers.

Evidence: Employment and Social Development Canada (Job Bank): Economic Scan - Yukon, Northwest Territories and Nunavut: 2026

What to watch

Historical context

Finance Canada's letter on 2025-26 transfers puts Yukon's Territorial Formula Financing payment at 1.5 billion dollars, and its table of major transfers gives 1,579 million dollars for 2026-27.

Evidence: Department of Finance Canada: Letters to Provinces and Territories: Yukon 2024 (transfer amounts for 2025-26); Department of Finance Canada: Federal transfers to provinces and territories: major federal transfers, 2017-18 to 2026-27

Historical context

Job Bank says mining employment in the Yukon should remain steady, supported by exploration, until new projects start in the 2030s, and relays a private Signal49 forecast that Yukon's GDP will grow 2.5 per cent in 2026. These are the publishers' forecasts, not Northline's. The Yukon Bureau of Statistics' reports are the first place to check.

Evidence: Employment and Social Development Canada (Job Bank): Economic Scan - Yukon, Northwest Territories and Nunavut: 2026

Fiscal position, investment and comparisons

How does the Yukon government pay for itself, what limits its investment, how exposed is its trade, and how does it differ from the Northwest Territories and Nunavut?

Yukon's government is funded mostly by federal Territorial Formula Financing, projects a deficit while sitting just under a federally set borrowing limit, and has lent to the receiver of a failed gold mine; its trade is small and its largest projects are still proposals

What happened

In the Statistics Canada accounts for the fiscal year that began in April 2024, the Yukon government's net operating balance was C$20 million, 0.9% of revenue, and grants from other governments, mostly federal transfers, were 85.0% of revenue. Liabilities were C$795 million.

Historical context

The Department of Finance's briefing notes for the 2026-27 Main Estimates say they forecast an accounting deficit of $81.8 million, which the note attributes mainly to continuing service delivery while future capital investments are planned.

Evidence: Government of Yukon, Department of Finance: Spring 2026 Session Briefing Notes: Finance (Main Estimates, Fiscal and Economic Outlook, Borrowing, Eagle Gold Mine financial considerations, Capital Plan)

Why it happened

Historical context

Finance Canada says Territorial Formula Financing is the largest federal transfer to the three territorial governments, that each territory's grant is based on the difference between a proxy of its expenditure needs and its capacity to generate revenues, and that natural resource revenues are not part of territorial eligible revenues for the purposes of the calculation.

Evidence: Department of Finance Canada: Territorial Formula Financing

Historical context

The Department of Finance says revenue will increase by $138 million, or 7.6 per cent, over the 2025-26 Main Estimates, driven mainly by federal transfers, which are forecast to rise by $130.8 million because of an increase in the Territorial Formula Financing grant.

Evidence: Government of Yukon, Department of Finance: Spring 2026 Session Briefing Notes: Finance (Main Estimates, Fiscal and Economic Outlook, Borrowing, Eagle Gold Mine financial considerations, Capital Plan)
Historical context

Finance Canada's table puts Territorial Formula Financing to Yukon at 1,579 million dollars in 2026-27 and says the Government of Yukon will receive $1.7 billion through major transfers.

Evidence: Department of Finance Canada: Federal transfers to provinces and territories: major federal transfers, 2017-18 to 2026-27

Historical context

The same notes say the government is facing significant fiscal constraints as rising expenditures, especially for health and education, continue to outpace revenue growth, and that 61.8 per cent of the increase in operating spending over last year's Main Estimates is for health, social services and education.

Evidence: Government of Yukon, Department of Finance: Spring 2026 Session Briefing Notes: Finance (Main Estimates, Fiscal and Economic Outlook, Borrowing, Eagle Gold Mine financial considerations, Capital Plan)
Opinion

Taken together, the sources say transfers account for most of the revenue increase and spending on health and education for most of the spending increase; none of them says that either would change if the mining sector recovered, because resource revenue is outside the transfer formula and the notes do not give Yukon's own resource revenue.

Why it matters

Historical context

The notes say consolidated debt is forecast to reach $1.17 billion in 2026-27, about $30 million below a borrowing limit of $1.2 billion, that this includes up to $508 million for energy infrastructure, and that the government has asked for a higher limit but cannot exceed the current one in the interim.

Evidence: Government of Yukon, Department of Finance: Spring 2026 Session Briefing Notes: Finance (Main Estimates, Fiscal and Economic Outlook, Borrowing, Eagle Gold Mine financial considerations, Capital Plan)

Historical context

They say the limit is set by Canada on its assessment of the territory's ability to carry future debt, and give the federal limits as $3.1 billion for the Northwest Territories and $1.05 billion for Nunavut.

Evidence: Government of Yukon, Department of Finance: Spring 2026 Session Briefing Notes: Finance (Main Estimates, Fiscal and Economic Outlook, Borrowing, Eagle Gold Mine financial considerations, Capital Plan)

Historical context

The Finance notes say the Ontario Superior Court has approved up to $220 million in Yukon government loans to the receiver of Victoria Gold to fund remediation of the Eagle Gold mine, that $185 million had been advanced, of which $104 million came from surety bonds held under mining licences, and that the loans carry interest at 9 per cent a year.

Evidence: Government of Yukon, Department of Finance: Spring 2026 Session Briefing Notes: Finance (Main Estimates, Fiscal and Economic Outlook, Borrowing, Eagle Gold Mine financial considerations, Capital Plan)

Historical context

The notes say that, excluding interest, these loans have a neutral effect on the budgetary surplus and net debt because the spending is offset by a loan receivable asset; whether the loans are repaid depends on the sale or liquidation of the mine, and the notes say the final accounting treatment depends on the terms of any sale.

Evidence: Government of Yukon, Department of Finance: Spring 2026 Session Briefing Notes: Finance (Main Estimates, Fiscal and Economic Outlook, Borrowing, Eagle Gold Mine financial considerations, Capital Plan)

History

Real output at basic prices in Yukon (chained 2017 dollars, Statistics Canada table 36-10-0711-01) was C$3.3 billion in 2025, a change of 30.0% over ten years. Over the same ten years goods-producing industries changed 26.7% and services-producing industries 31.5%; mining, quarrying and oil and gas changed -23.4%, manufacturing -2.7% and the public sector 31.9%. These are changes in real output, not in income or jobs, and the table gives no reason for the differences; the sourced paragraphs in this section and in the story give the explanations that named sources offer.

Real output by industry in Yukon, indexed

Real GDP at basic prices, chained 2017 dollars, annual (Statistics Canada table 36-10-0711-01); first year shown = 100. Goods and services against the total, with mining and oil and gas, manufacturing and the public sector. Chained-dollar levels are not additive, so only changes are compared.

Chart loads when it comes into view.

Latest values: All industries 3,318,000,000 (2025); Goods-producing industries 616,500,000 (2025); Services-producing industries 2,720,000,000 (2025); Mining, quarrying and oil and gas 160,100,000 (2025); and 2 more in the data table.

Labour productivity, meaning real value added per hour worked in chained 2017 dollars (Statistics Canada table 36-10-0713-01), was C$66.50 an hour in Yukon in 2025, a change of 5.9% over ten years. In goods-producing industries it was C$58.70 an hour (a change of -24.2% over ten years) and in services-producing industries C$68.80 an hour (a change of 14.3%). A high level can reflect capital-intensive industries such as oil, gas and mining rather than the efficiency of the whole economy, and the table says nothing about why levels or changes differ.

Labour productivity in Yukon: goods and services

Real value added per hour worked, chained 2017 dollars, annual (Statistics Canada table 36-10-0713-01). Goods-producing industries include mining and oil and gas, so their level reflects capital-intensive resource extraction as well as manufacturing and construction.

Chart loads when it comes into view.

Latest values: All industries 66.5 (2025); Goods-producing industries 58.7 (2025); Services-producing industries 68.8 (2025).

Historical context

The notes say the last increase in the borrowing limit, from $800 million to $1.2 billion, occurred in December 2024, and that the government issued two bonds of $200 million each in 2025-26, the first in September 2025 at 3.8 per cent with a ten-year maturity.

Evidence: Government of Yukon, Department of Finance: Spring 2026 Session Briefing Notes: Finance (Main Estimates, Fiscal and Economic Outlook, Borrowing, Eagle Gold Mine financial considerations, Capital Plan)

Historical context

A Department of Economic Development note from September 2024 reported a reduction in royalty payments from Victoria Gold of $2.5 million in that year's supplementary estimates, the only royalty figure in the sources cited.

Evidence: Government of Yukon, Department of Economic Development: 2024 Fall Session Briefing Notes: Economic Development (Canada-United States Trade; Supplementary Overview)

Across geographies

Yukon is compared here with the Northwest Territories and Nunavut, which have the same federal formula, and with the national figure only where the series are defined alike. Territorial survey figures are smaller and smoothed and are not comparable with provincial ones.

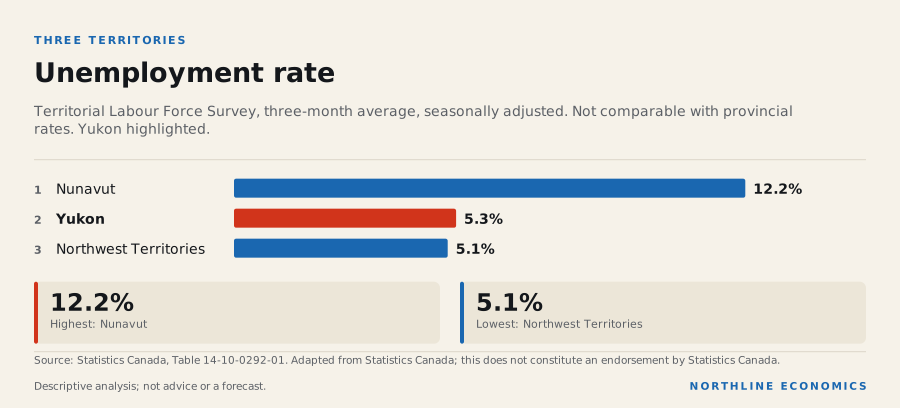
In October 2026 the unemployment rate (three-month average, territorial survey) was 5.3% in Yukon, 5.1% in the Northwest Territories and 12.2% in Nunavut, against 6.7% nationally, a survey that excludes the territories. Average weekly earnings in August 2026 were C$1,554 a week in Yukon, C$1,792 a week in the Northwest Territories and C$1,922 a week in Nunavut, against C$1,355 a week nationally. Population changed 2.5% over four quarters in Yukon, -0.3% in the Northwest Territories and 2.3% in Nunavut.

In the Statistics Canada accounts for the fiscal year that began in April 2024, grants from other governments were 85.0% of Yukon's revenue, 74.0% of the Northwest Territories' and 82.8% of Nunavut's; net operating balance was 0.9%, 8.0% and 1.9% of revenue.

Historical context

Finance Canada's per capita federal support for 2026-27 is 34,034 dollars for Yukon, 42,666 for the Northwest Territories and 57,594 for Nunavut, against 2,577 across all provinces and territories.

Evidence: Department of Finance Canada: Federal transfers to provinces and territories: major federal transfers, 2017-18 to 2026-27

Historical context

Statistics Canada reported in May 2026 that construction activity fell in 2025 in the Northwest Territories (by 9.5 per cent), Newfoundland and Labrador (8.5 per cent) and Yukon (0.6 per cent), while Canada's real GDP by industry rose 1.6 per cent. Its revised series of 5 November 2026 shows construction in Yukon up 8.3% instead, with falls of 11.2% in the Northwest Territories and 0.4% in Newfoundland and Labrador, and its revised accounts say GDP rose in Yukon in 2025.

Evidence: Statistics Canada: The Daily: Gross domestic product by industry: Provinces and territories, 2025; Statistics Canada: The Daily: Provincial and territorial economic accounts, 2025

Historical context

In May 2026 Statistics Canada attributed the fall in Yukon's mining activity (28.3 per cent) to the Eagle Gold Mine, whose remediation began in mid-2024; its revised series of 5 November 2026 puts the 2025 fall at 20.3%.

Evidence: Statistics Canada: The Daily: Gross domestic product by industry: Provinces and territories, 2025

Historical context

Statistics Canada reports median after-tax income of $116,100 in the Northwest Territories, $109,600 in Nunavut and $89,300 in Yukon in 2024, and says these differences are not adjusted for cost of living or age structure.

Evidence: Statistics Canada: The Daily: Canadian Income Survey, 2024

Opinion

On these sourced figures Yukon receives the least federal support per person of the three territories and has the lowest median after-tax income of the three; the sources do not say whether the two are related, and the desk does not infer a cause beyond what each source states.

What it influences

Historical context

The Capital Plan includes $385.4 million of gross capital investment in 2026-27 and about $1.08 billion over its three-year term, and the notes list a Whitehorse General Hospital expansion (planning only), the Nisutlin Bay Bridge replacement, reconstruction of sections of the North Klondike Highway partly funded through the National Trade Corridors Fund, and recoverable road work under the Yukon Resource Gateway program.

Evidence: Government of Yukon, Department of Finance: Spring 2026 Session Briefing Notes: Finance (Main Estimates, Fiscal and Economic Outlook, Borrowing, Eagle Gold Mine financial considerations, Capital Plan)

Historical context

The notes say the net capital budget is $283.1 million, a reduction of 10.4 per cent from the previous year's Main Estimates, and that fiscal restraint left room for up to $100 million in additional debt space for Yukon Energy Corporation.

Evidence: Government of Yukon, Department of Finance: Spring 2026 Session Briefing Notes: Finance (Main Estimates, Fiscal and Economic Outlook, Borrowing, Eagle Gold Mine financial considerations, Capital Plan)

Opinion

Because the same note says the debt cap covers both core government and Yukon Energy Corporation borrowing, the desk reads the capital plan and the utility's investment as drawing on one limit; the note does not say how the room is divided.

Historical context

The Canada Energy Regulator says Yukon is not connected to the North American electricity grid in British Columbia and that hydroelectricity was 72% of generation in 2021.

Evidence: Canada Energy Regulator: Provincial and Territorial Energy Profiles: Yukon

Historical context

Natural Resources Canada says the federal government will prioritise financial and regulatory support for the British Columbia-Yukon Grid Connect, an approximately 800-kilometre direct-current line that would connect Yukon's grid to British Columbia and support industrial development including critical minerals. It is a proposal; the sources cited give no cost or date.

Evidence: Natural Resources Canada: Canada takes action to advance a stronger grid and increase reliable, affordable energy

Historical context

The Major Projects Office lists a Northwest Critical Conservation Corridor, in northwest British Columbia and southern Yukon, whose strategy it says will focus on mining, energy and trade infrastructure; it is a strategy, not a built project.

Evidence: Major Projects Office (Privy Council Office): Northwest Critical Conservation Corridor

Risks

Historical context

Natural Resources Canada says mineral commodities were nearly all of Yukon's merchandise exports (96%) and that the value of Yukon's mineral and metal exports rose 39% between 2024 and 2025.

Evidence: Natural Resources Canada: Mineral Trade (published May 2026)

Historical context

The Department of Economic Development reported that Yukon's two-way merchandise trade with the United States in 2023 was $150.1 million, that Alaska accounts for roughly 85 per cent-95 per cent of that, and that the decline from 2022 was mostly due to lower mineral exports, particularly copper from the Minto Mine, which closed in May 2023.

Evidence: Government of Yukon, Department of Economic Development: 2024 Fall Session Briefing Notes: Economic Development (Canada-United States Trade; Supplementary Overview)

Historical context

The Department of Finance says that despite ongoing tariff uncertainty the Yukon has fared better than most jurisdictions, reflecting the limited role of international exports in the economy.

Evidence: Government of Yukon, Department of Finance: Spring 2026 Session Briefing Notes: Finance (Main Estimates, Fiscal and Economic Outlook, Borrowing, Eagle Gold Mine financial considerations, Capital Plan)

Historical context

CMHC says Yukon and the Northwest Territories have the lowest exposure to U.S. tariffs among provinces and territories.

Evidence: Canada Mortgage and Housing Corporation: Northern Housing Report

Opinion

No current United States share or commodity split for Yukon's exports is given here; the sourced exposure is low in the economy as a whole but concentrated in a few mineral products, and no source says how a tariff on them would pass through.

Historical context

The notes say record gold prices lifted placer gold production to a nearly 30-year high, with the value of production over $475 million in 2025, and that the potential sale of the Eagle Gold Mine represents upside risk to the economic forecast.

Evidence: Government of Yukon, Department of Finance: Spring 2026 Session Briefing Notes: Finance (Main Estimates, Fiscal and Economic Outlook, Borrowing, Eagle Gold Mine financial considerations, Capital Plan)

What to watch

Historical context

The notes say the labour force and employment reached record levels in 2025 with the lowest unemployment rate in Canada for a third straight year, that inflation rose to 3.2 per cent from 2 per cent, and that growth is tempered by labour market conditions and weaker population growth from federal immigration policy.

Evidence: Government of Yukon, Department of Finance: Spring 2026 Session Briefing Notes: Finance (Main Estimates, Fiscal and Economic Outlook, Borrowing, Eagle Gold Mine financial considerations, Capital Plan)

Historical context

The City of Whitehorse's housing needs assessment estimates a need for 3,015 additional homes over 2026 to 2031 and says homeownership is out of reach for most households.

Evidence: City of Whitehorse: Whitehorse Housing Needs Assessment, January 2026

Historical context

CMHC says that since 2021 construction costs in Whitehorse have remained about 1.3 times those in Calgary and that limited developable and serviced land constrains supply.

Evidence: Canada Mortgage and Housing Corporation: Northern Housing Report

Historical context

The notes plan operating growth of 2 per cent a year and lower capital spending in years two and three to return to an annual cash surplus by 2028-29; the fall update to the fiscal outlook and the outcome of the borrowing-limit request are the first things to check.

Evidence: Government of Yukon, Department of Finance: Spring 2026 Session Briefing Notes: Finance (Main Estimates, Fiscal and Economic Outlook, Borrowing, Eagle Gold Mine financial considerations, Capital Plan)

Written profile

What do the data show about the Yukon economy?

Yukon had 50 thousand residents on 1 July 2026, and its government's net operating balance, on Statistics Canada's basis, was C$20 million in the fiscal year that began in April 2024

Yukon against the other territories

Yukon is the fastest-growing jurisdiction in Canada by population and the lowest-paid of the three territories. Its population was 50 thousand on 1 July 2026, 2.5% higher than a year earlier, faster than any province, and 67.0% higher than on 1 January 2001. Net movement to and from the provinces added 503 persons over four quarters, immigrants numbered 759 and non-permanent residents changed by -189.

The labour market is tight on the survey's own terms. In October 2026 the unemployment rate was 5.3%, the participation rate 73.0% and the employment rate 68.9%, the highest of the three territories on the last two. The job vacancy rate, not seasonally adjusted, was 3.7% in August 2026. These come from a smaller survey than the provincial one and are not comparable with provincial rates.

Unemployment rate. Nunavut 12.2%; Yukon 5.3%; Northwest Territories 5.1%.
The data behind this graphic
Unemployment rate
ItemValue
Nunavut12.2%
Yukon5.3%
Northwest Territories5.1%

Download this graphic (SVG, with source)

An economy built on services and government

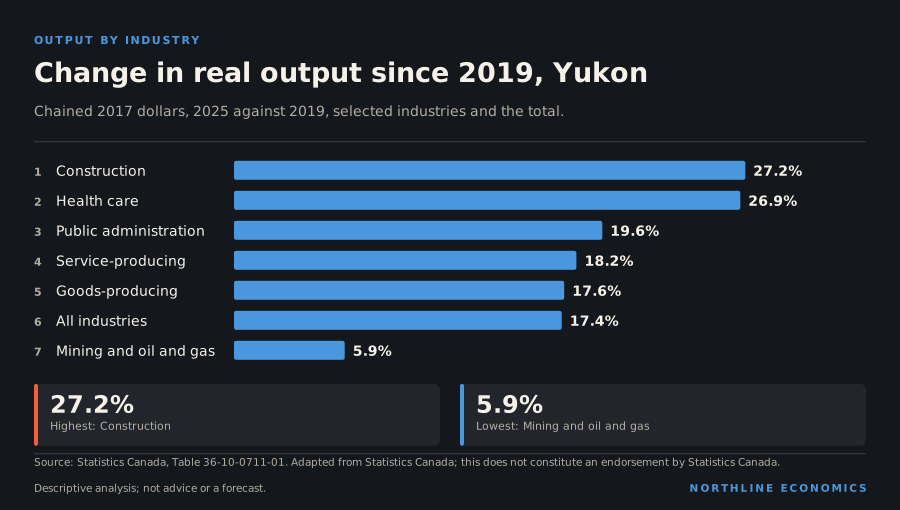
Real output across all industries is 17.4% above 2019, led by health care (26.9%), public administration (19.6%) and construction (27.2%). Service-producing industries grew 18.2% against 17.6% for goods-producing industries, and mining, quarrying and oil and gas extraction changed by 5.9%. Real GDP at market prices, at 2017 constant prices, was C$3.4 billion in 2025, 17.7% above 2019.

Change in real output since 2019, Yukon. Construction 27.2%; Health care 26.9%; Public administration 19.6%; Service-producing 18.2%; Goods-producing 17.6%; All industries 17.4%; Mining and oil and gas 5.9%.
The data behind this graphic
Change in real output since 2019, Yukon
ItemValue
Construction27.2%
Health care26.9%
Public administration19.6%
Service-producing18.2%
Goods-producing17.6%
All industries17.4%
Mining and oil and gas5.9%

Download this graphic (SVG, with source)

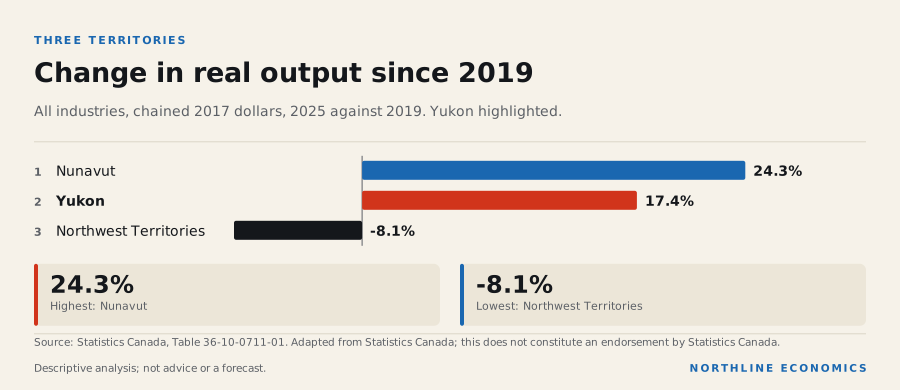
Change in real output since 2019. Nunavut 24.3%; Yukon 17.4%; Northwest Territories -8.1%.
The data behind this graphic
Change in real output since 2019
ItemValue
Nunavut24.3%
Yukon17.4%
Northwest Territories-8.1%

Download this graphic (SVG, with source)

Pay is the weaker side. Average weekly earnings of C$1,554 a week in August 2026 were the lowest of the three territories and 3.0% higher than a year earlier. Labour productivity, real value added per hour worked, was C$66.50 an hour, up 5.6% since 2019, the lowest of the three territories in 2025. Retail sales in August 2026 were 6.7% higher than a year earlier.

The public accounts

In the fiscal year that began in April 2024 the territorial government had revenue of C$2.1 billion, of which C$1.8 billion was grants from other governments (mostly federal transfers), 85.0% of revenue. The net operating balance was C$20 million, liabilities were 0.38 times revenue and net worth was C$3.0 billion. Transfers fund most of what the government does, so the territory's fiscal position depends heavily on federal policy. The basis is Statistics Canada's and one year is not a trend.

What it means for decisions

Opinion

For a business, Yukon is a small and fast-growing market with health care, public administration and construction where output has grown, and an expanding population is the demand story. Pay is low relative to the other territories and the cost of living is not captured in these figures. For a government or lender, the dependence on transfers is the central fact.

What the data cannot say: they do not separate Whitehorse from the communities, they do not describe mining activity or tourism directly, the survey is small, and percentage changes in a small economy can reflect a few employers or projects. Nothing here is a forecast.

Labour market

In the territorial Labour Force Survey (three-month average, seasonally adjusted, a smaller survey than the provincial one), the unemployment rate was 5.3% in October 2026, the participation rate 73.0% and the employment rate 68.9%. These rates are not comparable with the provincial monthly rates and are not ranked against them.

Unemployment rate in the territories

Percent, three-month moving average, seasonally adjusted, 15 years and over (territorial Labour Force Survey; not comparable with the provincial monthly rates).

Chart loads when it comes into view.

Latest values: Yukon 5.3 (2026-10); Northwest Territories 5.1 (2026-10); Nunavut 12.2 (2026-10).

People and output

The population was 2.5% higher than four quarters earlier, with net interprovincial migration of 503 persons over the latest four quarters. Real GDP at 2017 constant prices was C$3.4 billion in 2025. Average weekly earnings were C$1,554 a week in August 2026.

Population of the territories, indexed

Quarterly estimates; start of period = 100.

Chart loads when it comes into view.

Latest values: Yukon 50,360 (2026 Q3); Northwest Territories 45,900 (2026 Q3); Nunavut 43,090 (2026 Q3).

Long-run perspective

Population is 116.0% higher on 1 July 2026 than on 1 January 1981, against 69.5% for Canada as a whole. Real GDP (at 2017 constant prices) is 336.3% higher in 2025 than in 1981; this is a level comparison between two years, not an average annual rate, and it is not compared with a national figure here because the national real GDP series is monthly and on a different basis.

Average weekly earnings, in current dollars and not seasonally adjusted, are 121.7% higher in August 2026 than in the same month twenty-five years earlier (106.8% for Canada). These are nominal figures: they include the effect of price increases over twenty-five years and are not a measure of the change in purchasing power.

These comparisons describe the size of changes between two dates. They do not say why this jurisdiction differs from Canada, and the end points can matter: a different starting year changes the percentage.

Public finances

In Statistics Canada's government finance statistics for the fiscal year that began in April 2024, the territorial government's revenue was C$2.1 billion and its expense C$2.1 billion, leaving a net operating balance of C$20 million. Grants received from other governments were C$1.8 billion, 85.0% of revenue (mostly federal transfers; not split by payer in the table). Liabilities were C$795 million and net worth C$3.0 billion. These are past-year accounts, not the current budget.

What is not assessed

Consumer prices (published for capital cities only), housing, industry structure, exports, the current budget, major projects and policy changes, and why Yukon differs from other places. This profile cites no source that explains these differences, and nothing here is a forecast.

1 · Where it ranks

Yukon among the places with data

Same values as the Canada atlas layers. Rank 1 is the highest value, which is not always the most favourable outcome. A measure the source does not publish for a place is simply absent.

MeasureLatestPeriodRank (1 = highest)
Population growth
% change over 4 quarters
2.5%2026 Q31 of 13
Average weekly earnings
C$ per week
$1,5542026-083 of 13
Job vacancy rate
%, unadjusted
3.7%2026-083 of 13
Retail sales growth
% change, latest 12 months vs the 12 before
4.9%2026-085 of 13
Building construction investment growth
% change, latest 12 months vs the 12 before
25.5%2026-083 of 13
Real GDP growth (annual)
% change, annual, chained 2017 dollars
0.6%202511 of 13
Immigrants per 1,000 residents
persons per 1,000 residents, latest 4 quarters
15.22026 Q21 of 13
Non-permanent residents, net change per 1,000
persons per 1,000 residents, latest 4 quarters
-3.82026 Q210 of 13
Net interprovincial migration per 1,000
persons per 1,000 residents, latest 4 quarters
10.12026 Q21 of 13
Provincial government net operating balance
% of revenue, fiscal year beginning in April
0.9%20246 of 13
Grants received from other governments
% of revenue, fiscal year beginning in April
85.0%20241 of 13

See Yukon on the atlas →

2 · Labour market

Unemployment, participation, employment and earnings

Yukon is emphasised; the other territories are shown for context. The territorial survey is a different, smoothed table: do not compare these rates with provincial charts.

Unemployment rate in the territories

Percent, three-month moving average, seasonally adjusted, 15 years and over (territorial Labour Force Survey; not comparable with the provincial monthly rates).

Chart loads when it comes into view.

Latest values: Yukon 5.3 (2026-10); Northwest Territories 5.1 (2026-10); Nunavut 12.2 (2026-10).

Participation rate in the territories

Percent of the population aged 15 and over, three-month moving average, seasonally adjusted.

Chart loads when it comes into view.

Latest values: Yukon 73 (2026-10); Northwest Territories 71.4 (2026-10); Nunavut 62 (2026-10).

Employment rate in the territories

Percent of the population aged 15 and over, three-month moving average, seasonally adjusted.

Chart loads when it comes into view.

Latest values: Yukon 68.9 (2026-10); Northwest Territories 67.8 (2026-10); Nunavut 54.4 (2026-10).

Average weekly earnings in the territories

Current dollars per week, industrial aggregate incl. overtime, not seasonally adjusted.

Chart loads when it comes into view.

Latest values: Yukon 1,554 (2026-08); Northwest Territories 1,792 (2026-08); Nunavut 1,922 (2026-08).

3 · People

Population and immigration

Quarterly population estimates and four-quarter immigration totals.

Population of the territories, indexed

Quarterly estimates; start of period = 100.

Chart loads when it comes into view.

Latest values: Yukon 50,360 (2026 Q3); Northwest Territories 45,900 (2026 Q3); Nunavut 43,090 (2026 Q3).

Immigrants to the territories (4-quarter total)

New permanent residents arriving over the previous four quarters.

Chart loads when it comes into view.

Latest values: Yukon 759 (2026 Q2); Northwest Territories 520 (2026 Q2); Nunavut 102 (2026 Q2).

4 · Output and activity

GDP, retail and construction

Annual real GDP and monthly activity indicators, indexed so the start of the period equals 100.

Real GDP of the territories, indexed

Annual, 2017 constant prices (not chained); start of the period = 100. Expenditure-based.

Chart loads when it comes into view.

Latest values: Yukon 3,425,000,000 (2025); Northwest Territories 4,168,000,000 (2025); Nunavut 4,139,000,000 (2025).

Retail sales in the territories, indexed

Seasonally adjusted; start of period = 100.

Chart loads when it comes into view.

Latest values: Yukon 107,000,000 (2026-08); Northwest Territories 85,900,000 (2026-08); Nunavut 65,900,000 (2026-08).

Investment in new building construction in the territories, indexed

Current dollars, not seasonally adjusted, 12-month sum; start of the period = 100.

Chart loads when it comes into view.

Latest values: Yukon 502,900,000 (2026-08); Northwest Territories 138,100,000 (2026-08); Nunavut 341,300,000 (2026-08).

Real output by industry in Yukon, indexed

Real GDP at basic prices, chained 2017 dollars, annual (Statistics Canada table 36-10-0711-01); first year shown = 100. Goods and services against the total, with mining and oil and gas, manufacturing and the public sector. Chained-dollar levels are not additive, so only changes are compared.

Chart loads when it comes into view.

Latest values: All industries 3,318,000,000 (2025); Goods-producing industries 616,500,000 (2025); Services-producing industries 2,720,000,000 (2025); Mining, quarrying and oil and gas 160,100,000 (2025); and 2 more in the data table.

Labour productivity in the territories

Real value added per hour worked, all industries, chained 2017 dollars (Statistics Canada table 36-10-0713-01), annual. Territorial output per hour reflects mining and public administration and small populations, and is not comparable with provinces.

Chart loads when it comes into view.

Latest values: Yukon 66.5 (2025); Northwest Territories 83.2 (2025); Nunavut 88.3 (2025).

Labour productivity in Yukon: goods and services

Real value added per hour worked, chained 2017 dollars, annual (Statistics Canada table 36-10-0713-01). Goods-producing industries include mining and oil and gas, so their level reflects capital-intensive resource extraction as well as manufacturing and construction.

Chart loads when it comes into view.

Latest values: All industries 66.5 (2025); Goods-producing industries 58.7 (2025); Services-producing industries 68.8 (2025).

Change in real output by industry in the territories, 2015 to 2025

Percent change in real GDP at basic prices (chained 2017 dollars, annual) over ten years. Each industry is compared with itself; chained-dollar levels are not additive, so shares of the total are not shown. A measure of the change in output, not of income or employment.

Chart loads when it comes into view.

Top values: Nunavut 66.2%; Yukon 30%; Northwest Territories -9.1%.

5 · Public finances

The provincial or territorial government's accounts

Statistics Canada government finance statistics (public-accounts basis), fiscal years ended 31 March. Annual, and about two years behind: past position, not this year's budget.

MeasureLatestFiscal year beginning in AprilYear before
RevenueC$2.1 billion2024C$2.0 billion
Grants received from other governments (part of revenue)C$1.8 billion2024C$1.7 billion
ExpenseC$2.1 billion2024C$2.0 billion
Net operating balance (revenue minus expense)C$0.0 billion2024−C$0.0 billion
Liabilities (end of fiscal year)C$0.8 billion2024C$0.7 billion
Net worth (end of fiscal year; negative = liabilities exceed assets)C$3.0 billion2024C$2.8 billion

Computed: grants from other governments were 85.0% of revenue in the fiscal year that began in April 2024; the table does not say which government paid them, and most are federal transfers. Compare on the atlas →

Computed: the net operating balance was 0.9% of revenue in the fiscal year that began in April 2024. Compare on the atlas →

6 · Not assessed

What this profile does not cover

Listed so that silence is not mistaken for absence of an issue.