What happened
In Statistics Canada's government finance statistics, the Quebec government's net operating balance was -C$15.9 billion in the fiscal year that began in April 2024, -9.2% of its revenue of C$171.9 billion; its liabilities were C$495.5 billion. Grants from other governments were 17.9% of revenue. Quebec's unemployment rate was 5.7% in October 2026, and its population changed by 0.2% from four quarters earlier.
Historical contextOn the province's own basis, its audited consolidated financial statements, which the Ministère des Finances publishes as open data, show an annual deficit of 5 175 million dollars for 2024-25, about a third of Statistics Canada's figure.
Evidence: Gouvernement du Québec, ministère des Finances (Données Québec): Comptes publics du gouvernement – Volume 1: statistiques financières 2015-2016 à 2024-2025 (données ouvertes, licence CC BY 4.0)
The sections below take four questions in turn: how the province pays its way, what it is building and what the building depends on, how exposed its exports are, and what is happening to its workforce. The comparison with Ontario, Alberta and New Brunswick follows.
Why it happened
Fiscal position
Historical contextThe March 2026 budget put the accounting deficit for 2025-2026 at 7.7 billion dollars (1.2 per cent of GDP) and for 2026-2027 at 6.3 billion (0.9 per cent), with a return to a balanced budget "by 2029-2030 at the latest". It puts the net debt burden at 38.8 per cent of GDP at March 31, 2026 and carries a contingency reserve of 8.0 billion dollars over five years.
Evidence: Gouvernement du Québec, ministère des Finances: Budget 2026-2027 - Press release no. 1 of 3 - A responsible budget with targeted measures for Quebecers
Historical contextThe public accounts published on 17 July 2026 put the 2025-2026 accounting deficit at 5.5 billion dollars (0.9 per cent of GDP), smaller than the budget's estimate.
Evidence: Gouvernement du Québec, ministère des Finances: Publication des Comptes publics 2025-2026 du gouvernement (17 juillet 2026)
Historical contextThe August 2026 pre-election report, in French, lowers the forecast 2026-2027 deficit to 5.2 billion dollars and forecasts revenues of 168.4 billion, keeping the path to balance by 2029-2030. The August figure is the later of the two; the budget's own plan document is not cited.
Evidence: Gouvernement du Québec, ministère des Finances: Publication du rapport préélectoral sur l'état des finances publiques du Québec (communiqué, 2026-08-17)
Historical contextBoth plans predate the change of government: a new Conseil des ministres, led by Premier Paul St-Pierre Plamondon with Nicolas Marceau as minister of finance, was sworn in on 21 October 2026.
Evidence: Gouvernement du Québec, Cabinet du premier ministre: Le premier ministre du Québec dévoile son Conseil des ministres (21 octobre 2026)
Historical contextThe province's own ratings page, as at March 6, 2026, lists Moody's at Aa2, S&P Global at A+, Fitch at AA– and Morningstar DBRS at AA (low), all with a stable outlook. The agencies' own reports are not cited, so the reasons for any rating are not given here.
Evidence: Gouvernement du Québec (Finances publiques): Québec's credit ratings (as at March 6, 2026; page updated April 27, 2026)
Historical contextFinance Canada says the Government of Quebec will receive $30,256 million in major federal transfers in 2026-27, of which Equalization is $13,907 million; the per capita allocation of all major transfers is $3,317.
Evidence: Department of Finance Canada: Major federal transfers
Historical contextFinance Canada describes how Equalization works. It says payments go to provinces with lower than average fiscal capacity, that fiscal capacity is measured at national average tax rates across five revenue categories including natural resource revenues, that natural resources are only partially included, and that "provincial spending decisions and overall fiscal results do not affect Equalization". Quebec's payment is therefore a statement about its measured revenue capacity, not about its budget balance.
Evidence: Department of Finance Canada: Equalization Program (page dated 2025-12-11; 2026-27 figures)
OpinionThe sources do not say how much of Quebec's revenue comes from natural-resource royalties or from Hydro-Québec's dividends to the government, and the revenue detail in the public accounts is not cited, so a revenue breakdown (own-source taxes, transfers, resource and enterprise income) is not given here. The transfers above are the only revenue sources that are quantified.
Labour, demographics, housing and migration
Historical contextThe 2026-2029 immigration plan, published in French in November 2025 by the previous government, aims to admit about 45 000 permanent residents a year and caps temporary foreign worker permit holders at 65 000 and international student permit holders at 110 000, which it says will reduce pressure on public services, housing, French and integration services.
Evidence: Gouvernement du Québec, ministère de l'Immigration, de la Francisation et de l'Intégration: Planification pluriannuelle et plan d'immigration 2026 - Québec baisse ses seuils d'immigration; Gouvernement du Québec, Cabinet du premier ministre: Le premier ministre du Québec dévoile son Conseil des ministres (21 octobre 2026)
Historical contextThe Institut de la statistique du Québec's July 2026 projections say Quebec's population could stabilize around 9.2 million and should decline by about 50,000 between 2025 and 2029, mostly because of an expected reduction in temporary immigration, while demographic housing needs rise by 0.7 per cent because of the age structure. The Institut stresses that projections are not forecasts.
Evidence: Institut de la statistique du Québec: This year's demographic projections: population stabilization scenario maintained for Québec
Historical contextStatistics Canada reports that Alberta had the fastest provincial population growth from July 2025 to July 2026 (1.5 per cent) against 0.5 per cent for Canada, and that Ontario, Quebec and British Columbia, which receive the largest shares of international migrants, grew slowest.
Evidence: Statistics Canada: The Daily: Canada's population estimates, second quarter 2026
Historical contextCMHC says the vacancy rate in Greater Montréal rose for a second year to 2.9 per cent in 2025, attributes the easing to record housing starts in recent years and to the decline in non-permanent residents, and says rent growth of 7.2 per cent outpaced income increases. This describes the Montréal area, not the whole province.
Evidence: Canada Mortgage and Housing Corporation: Rental Market Report 2025: major centres (web edition)
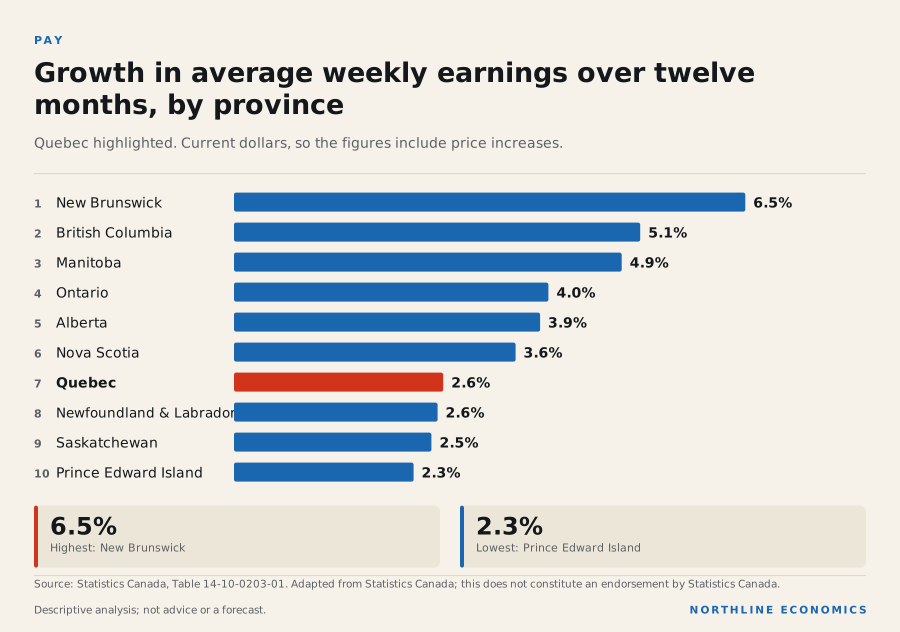
Quebec's job vacancy rate was 3.0% in August 2026, average weekly earnings C$1,297 a week in August 2026 and the average hourly wage rate, not seasonally adjusted, C$37.00 an hour in October 2026. No source cited here explains Quebec's wage or productivity level.
Why it matters
Historical contextThe budget says the real GDP per capita gap with Ontario narrowed from 15.9 per cent in 2018 to 10.2 per cent in 2024, so Quebec's output per person is still lower than Ontario's by the government's own measure.
Evidence: Gouvernement du Québec, ministère des Finances: Budget 2026-2027 - Press release no. 1 of 3 - A responsible budget with targeted measures for Quebecers
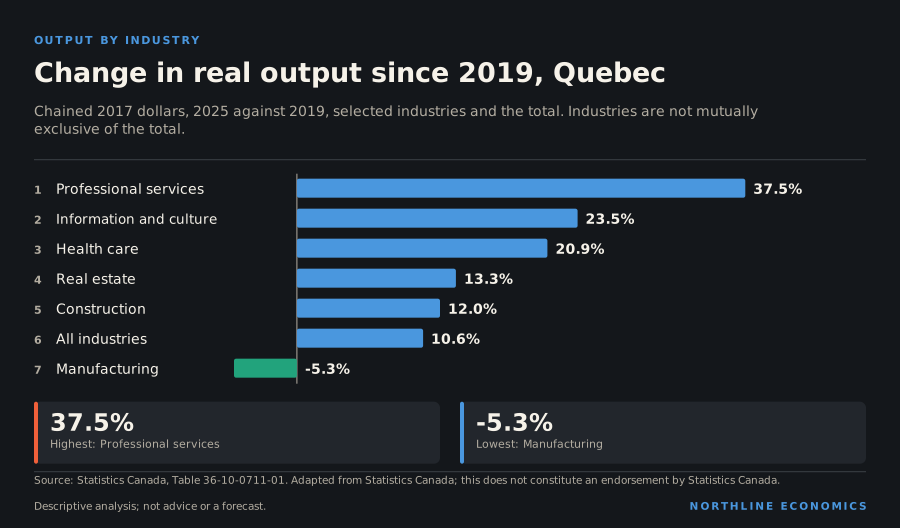
Historical contextStatistics Canada reported in May 2026 that manufacturing output fell in 10 jurisdictions in 2025, a significant drag on growth in Quebec (down 4.0 per cent); its revised series of 5 November 2026 shows a fall of 3.9%.
Evidence: Statistics Canada: Gross domestic product by industry: Provinces and territories, 2025
OpinionA province with a persistent per-person output gap, falling manufacturing and a shrinking working-age pool has less room to grow out of a deficit; the sources describe each element but none links them, so this is Northline's reading, not a finding.
History
Real output at basic prices in Quebec (chained 2017 dollars, Statistics Canada table 36-10-0711-01) was C$453.7 billion in 2025, a change of 22.8% over ten years. Over the same ten years goods-producing industries changed 8.5% and services-producing industries 28.5%; mining, quarrying and oil and gas changed 25.2%, manufacturing 1.0% and the public sector 27.2%. These are changes in real output, not in income or jobs, and the table gives no reason for the differences; the sourced paragraphs in this section and in the story give the explanations that named sources offer.
Historical contextThe Quebec Infrastructure Plan 2026-2036 totals 167 billion dollars over ten years, of which 105.8 billion dollars, 71% of the total, is for maintaining existing assets.
Evidence: Gouvernement du Québec, Office of the Minister Responsible for Infrastructure: Québec Infrastructure Plan 2026-2036 (press release)
Across geographies
Peers differ from Quebec first in how they are financed.
Historical contextPer capita major federal transfers in 2026-27 are $3,317 for Quebec, $1,817 for Ontario, $1,792 for Alberta and $5,605 for New Brunswick, according to Finance Canada.
Evidence: Department of Finance Canada: Major federal transfers
Historical contextFinance Canada's Chart 1 gives Equalization payments of 1,568 for Quebec, 26 for Ontario and 4,004 for New Brunswick, and natural-resource fiscal capacity of 471 for Quebec, 22 for Ontario, 107 for New Brunswick and 4,778 for Alberta. Non-resource fiscal capacity is 10,094 for Quebec against 12,086 for Ontario, 13,508 for Alberta and 7,997 for New Brunswick. The chart labels these figures in dollars per capita. Alberta receives no Equalization.
Evidence: Department of Finance Canada: Equalization Program (page dated 2025-12-11; 2026-27 figures); Finance Canada: Chart 1: Equalization 2026-27 (chart on the Equalization program page)
Statistics Canada's accounts show a similar pattern. Grants from other governments were 17.9% of revenue in Quebec, 17.4% in Ontario, 14.3% in Alberta and 37.1% in New Brunswick, in the fiscal year that began in April 2024. The net operating balance was -9.2% of revenue in Quebec, -8.2% in Ontario, 8.5% in Alberta and 4.1% in New Brunswick.
Historical contextThe provinces' own audited results for that year differ: Ontario's accounts show a deficit of 1.1 billion dollars, far smaller than Statistics Canada's figure, and New Brunswick's a deficit of $104.4 million where Statistics Canada's basis shows a surplus.
Evidence: Government of Ontario: Public Accounts 2025-26: Annual report; Government of New Brunswick, Department of Finance and Treasury Board: News release: Public accounts for 2024-25 (29 September 2025)
OpinionRead together, the Finance Canada figures show Quebec between Ontario, which is close to self-financed in Equalization terms, and New Brunswick, which depends on it far more. What the sources support is the mechanism Finance Canada states: payments follow fiscal capacity measured at average tax rates, and Alberta's large resource capacity places it outside the program. They do not decompose Quebec's capacity into causes.
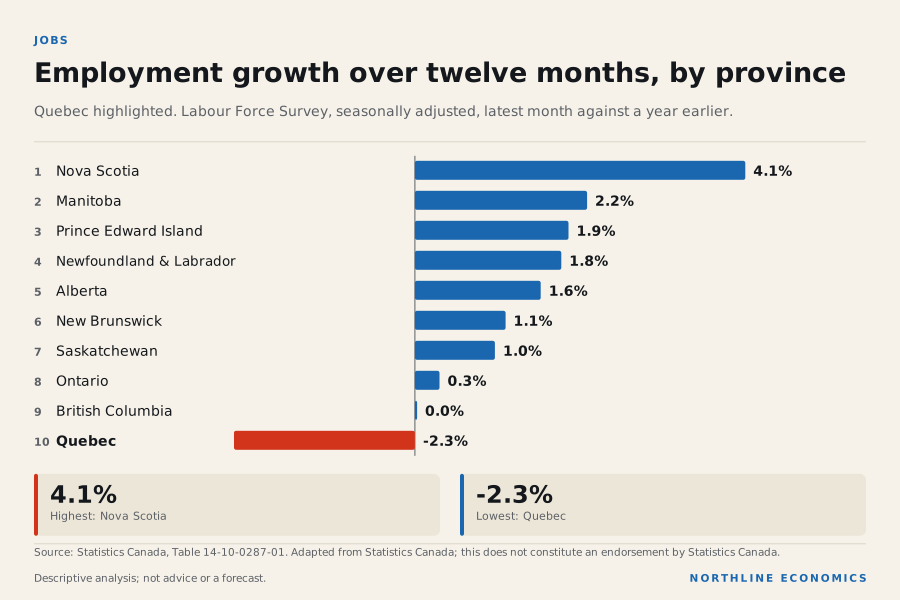
Then the real economy. In October 2026, Quebec's unemployment rate was 5.7%, against 7.3% in Ontario, 7.3% in Alberta and 7.4% in New Brunswick, and 6.7% for Canada; Quebec ranks 9th of 10 among the ten provinces (1st = highest). Employment over twelve months changed -2.3% in Quebec, 0.3% in Ontario, 1.6% in Alberta and 1.1% in New Brunswick, and 0.1% nationally. Average weekly earnings rank 6th of 10 among the ten provinces. Population changed 0.2% in Quebec over four quarters, 0.3% in Ontario, 1.5% in Alberta and 1.0% in New Brunswick. Net interprovincial migration over four quarters was -7,084 persons for Quebec and 22 thousand for Alberta.
Historical contextCMHC's summer outlook says market momentum is expected to keep sales high in Prairie and Quebec markets, that Quebec should see modest gains in prices due to more balanced market conditions, and that British Columbia and Ontario will continue to struggle because of affordability challenges and slower population growth.
Evidence: CMHC: Summer Update: 2026 Housing Market Outlook
Historical contextStatistics Canada reported in May 2026 that goods-producing activity declined in Quebec in 2025 while it edged up in Ontario; its revised series of 5 November 2026 shows the same, with goods-producing output -1.1% in Quebec and 0.3% in Ontario.
Evidence: Statistics Canada: The Daily: Gross domestic product by industry: Provinces and territories, 2025
OpinionThe statements explain the gap in terms the sources give: oil and gas extraction was among the top contributors to growth in Alberta, which also had the fastest population growth; Ontario's contribution came mainly from services; and in Quebec manufacturing was a drag and employment fell. They do not establish that one causes another, and New Brunswick is shown mainly to illustrate Equalization dependence, not as a growth model.
What it influences
Investment, infrastructure and what each depends on
Historical contextThe full plan reserves 18.0 billion dollars in a central envelope for major projects whose business cases are to be approved, notably by March 31, 2027, and says the projects provisioned there are not made public. It lists 1.4 billion dollars advanced for the Montréal Métro Blue Line extension to Anjou and 0.3 billion for preparatory work on the Québec tramway.
Evidence: Gouvernement du Québec, Secrétariat du Conseil du trésor: Québec Infrastructure Plan 2026-2036 (full plan, budget 2026-2027)
Historical contextThe government says accelerating investment will protect more than 4,400 jobs and add over 630 million dollars a year to GDP on average by 2030-2031. New funds include 3.6 billion dollars for hospitals and 1.2 billion for public transit.
Evidence: Gouvernement du Québec, Office of the Minister Responsible for Infrastructure: Québec Infrastructure Plan 2026-2036 (press release)
Historical contextHydro-Québec's Action Plan 2035, dated November 2023, plans to add 60 TWh of electricity, or between 8,000 and 9,000 MW of capacity, by 2035, including over 10,000 MW of new wind and $35 to $45 billion of hydropower investment. It puts total investments and additional expenses at $155–$185 billion by 2035 and says the build-out will mobilize an average of 35,000 construction workers a year.
Evidence: Hydro-Québec: Action Plan 2035: Towards a Decarbonized and Prosperous Québec
Historical contextThe plan states what it depends on: legislative frameworks limiting residential rate increases to inflation with a ceiling of 3%, and the continued competitiveness of industrial and commercial rates. It says the investments will put upward pressure on electricity rates.
Evidence: Hydro-Québec: Action Plan 2035: Towards a Decarbonized and Prosperous Québec
OpinionThe infrastructure plan depends on the province's borrowing, which depends on the ratings above, and on a central envelope whose contents are not published. The Hydro-Québec plan depends on rate-setting rules and on private wind investment the company counts in its total. The sources do not give a combined figure for provincial and company capital spending, and no source cited here assesses how a deficit-financed plan and a high net debt burden interact.
Risks
Trade and tariffs
Domestic merchandise exports were C$117.6 billion in calendar 2025. 72% went to the United States, against 72% for Ontario, 85% for Alberta and 90% for New Brunswick. Energy products were 4% of Quebec's exports, against 76% for Alberta. These are customs-basis goods exports and exclude services.
Historical contextThe Institut de la statistique du Québec reports that Quebec's exports to the United States in 2025 were down 6.9 per cent from 2024 while exports to other countries were up 10.6 per cent, so that total exports were down 2.3 per cent.
Evidence: Institut de la statistique du Québec: Québec's international merchandise exports up 2.9% in December 2025
Historical contextCanada Economic Development for Quebec Regions says Quebec has over 1700 aluminum processing businesses with 30,000 jobs and 11.6 billion dollars in annual sales, and that 27 organizations in the sector have received 20,275,574 dollars under the Regional Tariff Response Initiative.
Evidence: Canada Economic Development for Quebec Regions: Tariff response: Over $20M in Government of Canada support for aluminum processors
Historical contextFinance Canada says the United States imposed a 50 per cent tariff on 27.6 billion dollars of Canadian goods effective August 22, 2026, and that Canada's matching counter-tariffs include steel and aluminum products. This is a national announcement; it does not give a Quebec share.
Evidence: Department of Finance Canada: Canada announces targeted countermeasures and substantive support for workers and businesses in response to U.S. tariffs
Historical contextThe March 2026 budget provided more than 365 million dollars for the forestry sector, which it said was in difficulty mainly because of the intensifying softwood lumber dispute with the United States.
Evidence: Gouvernement du Québec, ministère des Finances: Budget 2026-2027 - Press release no. 3 of 3 - More than $1.7 billion to accelerate Québec's economic transformation
Historical contextCMHC says Central Canada is more affected by trade risks and is likely to lag.
Evidence: CMHC: Summer Update: 2026 Housing Market Outlook
OpinionQuebec's US export share is close to Ontario's and far below New Brunswick's or Alberta's, and its energy share is small, so its exposure runs through manufactured goods, aluminum and lumber rather than oil. The sources show the exposures and the support measures but give no estimate of tariff effects on Quebec output.
What to watch
The next Quebec budget will show whether the path to balance by 2029-2030 holds; the Institut de la statistique du Québec and Statistics Canada release monthly output and labour data; Finance Canada's next Equalization renewal is due before March 31, 2029; Hydro-Québec's regulatory approvals and rate rules will show the pace of its build-out.
Not cited and so not described here: the public accounts beyond the 2024-25 deficit, gross debt, a revenue breakdown including resource royalties, the rating agencies' own reports, the full Quebec budget plan and pre-election report, Major Projects Office text on Quebec projects, a Quebec-only tariff exposure estimate and wage explanations.