GlobalCanadaCities
Nunavut · territory · data profile

Nunavut: territorial economy at a glance

Latest values, rankings and charts for Nunavut, all computed from Statistics Canada data held by this platform. The economic story below explains with attributed statements from official sources; the profile only computes. Forecasts quoted are their publishers' and Northline publishes none.

Analyze Nunavut in Intelligence Studio

Opens a workspace prepared from the published Nunavut measures, with what is missing stated.

The economy

What drives Nunavut's economy, how does housing constrain it, and why do forecasts differ so widely?

The territorial government says mining is almost half of Nunavut's economy, the highest share in Canada, while it has a severe housing shortage, the country's highest poverty rate and a government that depends on federal transfers, and forecasts for 2026 growth range from 6.9 to over 11 per cent

What happened

Nunavut's unemployment rate (three-month average, territorial survey) was 12.2% in October 2026 and its employment rate 54.4%. Real output across all industries was 24.3% above 2019 in 2025. Average weekly earnings were C$1,922 a week in August 2026, and net interprovincial migration over the latest four quarters was 298 people (negative is an outflow).

Why it happened

Historical context

The Government of Nunavut's finance department says mining now accounts for almost 50% of the economy, by far the industry's highest share in Canada, and forecasts that the public sector will account for roughly 28% of all goods and services produced in 2026. Statistics Canada's real output series, in chained 2017 dollars, puts mining, quarrying and oil and gas extraction at 34.0% in 2025. The government's chart of shares by sector cites Statistics Canada table 36-10-0400-01, which gives each industry's share at current prices, so the two figures are measured on different bases.

Evidence: Government of Nunavut, Department of Finance: Budget 2026-27 Fiscal and Economic Indicators; Statistics Canada: Table 36-10-0400-01: Gross domestic product (GDP) at basic prices, by industry, provinces and territories, percentage share

Historical context

CMHC says Nunavut's growth in 2024, its fastest in five years, was supported by elevated gold prices, higher output at existing mines and major capital projects, and that mining contracted in 2025 as Baffinland Iron Mines reduced production at Mary River by roughly one third amid weaker iron ore prices.

Evidence: Canada Mortgage and Housing Corporation: Northern Housing Report

Historical context

Statistics Canada reported in May 2026 that Nunavut's mining activity was down as iron ore declined by 27.2 per cent in 2025 while construction increased 21.8 per cent on a new gold mine and reconstruction after the Whale Cove facility fire; its revised series of 5 November 2026 puts the rise in construction at 20.8%.

Evidence: Statistics Canada: The Daily: Gross domestic product by industry: Provinces and territories, 2025

Why it matters

Historical context

The territory's finance department expects real GDP to grow by over 11% in 2026 and says B2Gold's Goose property achieved its first gold pour in June 2025, but names financial trouble at Baffinland as a downside risk.

Evidence: Government of Nunavut, Department of Finance: Budget 2026-27 Fiscal and Economic Indicators

Historical context

Job Bank relays a private Signal49 forecast of strong growth for Nunavut, and the territory's own forecast is higher still. Statistics Canada's revised accounts of 5 November 2026 say GDP rose in Nunavut in 2025, and its revised industry series shows 0.8% at basic prices; the market-price series held here, measured at 2017 constant prices rather than chained dollars, shows -2.7%. The forecasts are not reconciled here.

Evidence: Employment and Social Development Canada (Job Bank): Economic Scan - Yukon, Northwest Territories and Nunavut: 2026; Statistics Canada: The Daily: Provincial and territorial economic accounts, 2025

History

Historical context

Statistics Canada reported in November 2025 that Nunavut almost doubled its growth in 2024, increasing 7.5 per cent after rising 3.8 per cent in 2023, with mining contributing most; its revised series now puts the two years at 6.7% and 3.3%.

Evidence: Statistics Canada: Gross domestic product by industry: Provinces and territories, 2024

Historical context

The Nunavut Bureau of Statistics reports that the unemployment rate increased from 8.3 per cent to 10.3 per cent in 2025, that the Inuit unemployment rate rose from 11.4 per cent to 13.8 per cent, and that employment grew modestly by 200 jobs.

Evidence: Nunavut Bureau of Statistics (Statistics Canada Labour Force Survey): Nunavut Statistical Brief: Labour Force Survey, January 2026 (annual 2025)

Across geographies

Historical context

Statistics Canada reports that Nunavut continued to have the highest poverty rate in Canada in 2024, at 31.7 per cent, reflecting the higher cost of living in the North.

Evidence: Statistics Canada: The Daily: Canadian Income Survey, 2024

Historical context

Job Bank says Nunavut has the youngest population in Canada, with a median age of 27.1 years.

Evidence: Employment and Social Development Canada (Job Bank): Economic Scan - Yukon, Northwest Territories and Nunavut: 2026

Historical context

CMHC says population growth continues to be driven by natural increase, supported by Canada's highest fertility rate, but that Nunavut continued to lose working-age residents to other parts of Canada amid severe affordability and housing pressures. Nunavut is not a province: its surveys, GDP basis and fiscal arrangements differ.

Evidence: Canada Mortgage and Housing Corporation: Northern Housing Report

What it influences

Historical context

The Auditor General reports that the government committed to building 3,000 homes by 2030, including 1,400 public housing units, and found that the Nunavut Housing Corporation did not know whether publicly funded units were being allocated to the applicants with the greatest need.

Evidence: Office of the Auditor General of Canada: The government must act to provide Nunavummiut with access to suitable public housing

Historical context

CMHC reports that nearly half of Nunavut Housing Corporation households were living in overcrowded conditions in January 2025, that new residential construction there remained overwhelmingly social housing, and that Iqaluit's rental vacancy rate stayed at 0.3% for a third year.

Evidence: Canada Mortgage and Housing Corporation: Northern Housing Report

Historical context

The territory's finance department says tight housing does much to discourage workers from entering or staying in the workforce.

Evidence: Government of Nunavut, Department of Finance: Budget 2026-27 Fiscal and Economic Indicators

Historical context

The federal government announced in July 2026 that at least 750 new housing units will be built across Nunavut, with 425 public housing units among them.

Evidence: Housing, Infrastructure and Communities Canada: Canada and Nunavut partner to build essential infrastructure and more homes

Historical context

The federal Major Projects Office describes the proposed Grays Bay Road and Port as an all-season road of about 230 kilometres to a deepwater port, with a process towards possible listing under the Building Canada Act begun on June 24, 2026; it is not a designated project.

Evidence: Government of Canada, Major Projects Office: Grays Bay Road and Port

Risks

Historical context

CMHC says that in Nunavut effects of tariffs should track national trends with greater sensitivity because of less economic diversification, and that utility costs are higher in the North, partly because of isolated grids and reliance on diesel generation.

Evidence: Canada Mortgage and Housing Corporation: Northern Housing Report

Historical context

The territory's finance department says Baffinland's planned railway to a new port would be one of the largest industrial infrastructure projects in northern Canada's history if it proceeds, and that provision of public services is more costly than in the rest of Canada because of climate, remoteness and a small, monopolistic commercial market.

Evidence: Government of Nunavut, Department of Finance: Budget 2026-27 Fiscal and Economic Indicators

What to watch

Historical context

The territory forecasts revenues of 3,503 million dollars in 2026-27, of which federal transfers are 2,468 million dollars, with expenses up 12% producing a significant deficit, and says the federal government limits borrowing to 1.05 billion dollars.

Evidence: Government of Nunavut, Department of Finance: 2026-27 Budget Highlights

Historical context

The federal government says the Nunavut Lands and Resources Devolution Agreement was signed on January 18, 2024, with the transfer of responsibilities to be completed by April 1, 2027, from which the territory will receive royalties on public lands. These are the publishers' figures and forecasts, not Northline's. The Nunavut Bureau of Statistics' releases, Statistics Canada's GDP and population estimates (release calendar) and Baffinland's financial position show how the outlook is resolved.

Evidence: Crown-Indigenous Relations and Northern Affairs Canada: Nunavut devolution
Fiscal position, investment and comparisons

How strong are the Government of Nunavut's finances, what do its investment plans depend on, how exposed is its trade, and how does it differ from the other territories and from the national picture?

Nunavut's government runs a planned deficit on small borrowing under a federal debt cap and a high rating, its biggest projects depend on federal money and on Baffinland's finances, and it differs from the Northwest Territories and Yukon in being a gold-and-iron-ore economy with high unemployment and a very young population

What happened

For the fiscal year that began in April 2024, Statistics Canada's accounts show the Government of Nunavut with a net operating balance of C$64 million, grants from other governments equal to 82.8% of its revenue and liabilities of C$962 million. The unemployment rate (three-month average, territorial survey) was 12.2% in October 2026, against 6.7% for Canada in October 2026. Average weekly earnings were C$1,922 a week in August 2026, against C$1,355 a week nationally, and real output across all industries was 24.3% above 2019 in 2025.

Why it happened

Fiscal position

Historical context

The Government of Nunavut forecasts an operational deficit of 169 million dollars in 2026-27, assuming the money set aside for contingencies is fully spent; as of March 31, 2026, total borrowing stood at 303 million dollars, mostly capital leases, the Qulliq Energy Corporation and the Iqaluit airport. The Government of Canada limits that borrowing to 1.05 billion dollars, leaving 747 million dollars of room.

Evidence: Government of Nunavut, Department of Finance: 2026-27 Budget Highlights

Historical context

The territory's finance department says federal transfers, led by Territorial Formula Financing of 2,347.9 million dollars in 2026-27, together make up 70 per cent of revenues, against around 36 per cent in New Brunswick and 16 per cent in British Columbia, because territories with small economies and narrow tax bases are not able to raise sufficient revenue on their own to provide public services comparable to elsewhere in Canada.

Evidence: Government of Nunavut, Department of Finance: Budget 2026-27 Fiscal and Economic Indicators

Historical context

Finance Canada says each territory's grant is the gap between a proxy of its expenditure needs and its capacity to raise revenue, that 30 per cent of measured revenue capacity is excluded to reward territories that grow their own revenues, and that natural resource revenues are not part of eligible revenues for these calculations. This is the territorial arrangement; provinces are instead equalized.

Evidence: Department of Finance Canada: Territorial Formula Financing

Historical context

The finance department reports that interest takes under 1 per cent of revenue, against 6 per cent for provinces and territories as a group, and that in March 2026 the government received an AA rating with a stable trend from DBRS Morningstar, an upgrade from AA low. These are the government's own reports of the rating, not the agency's, and the same document's comparison table prints a different grade.

Evidence: Government of Nunavut, Department of Finance: Budget 2026-27 Fiscal and Economic Indicators

Historical context

The federal government says the Nunavut Lands and Resources Devolution Agreement was signed in January 2024 and that the territory will receive royalties on public lands once responsibilities are transferred.

Evidence: Crown-Indigenous Relations and Northern Affairs Canada: Nunavut devolution
Opinion

How large those royalties will be, and how much of them the territory keeps rather than loses through the formula, is not answered by any source cited here; the Finance Canada page predates the signing and still says negotiations are ongoing, and none gives a royalty estimate.

Investment, projects and infrastructure

Historical context

The finance department reports that the capital plan approved for 2026-27 is 373.2 million dollars in projects for the first year, with 2,038.7 million dollars proposed over the five years to 2030-31 and 56 projects under construction, up from 48. It names ongoing labour shortages in skilled trades and inflationary pressures as continuing to delay and raise the cost of capital projects.

Evidence: Government of Nunavut, Department of Finance: Budget 2026-27 Fiscal and Economic Indicators

Historical context

The budget address says the Nunavut Housing Corporation's operating budget rises to approximately 296 million dollars and that 87.2 million dollars is provided in housing capital investments this year.

Evidence: Government of Nunavut, Premier and Minister of Finance: 2026-2027 Budget Address

Historical context

The federal government announced in July 2026 that at least 750 new housing units will be built across Nunavut, so these homes depend on federal funding alongside the territory's own.

Evidence: Housing, Infrastructure and Communities Canada: Canada and Nunavut partner to build essential infrastructure and more homes

Historical context

The finance department says a lack of physical assets is one of the territory's chief barriers to further investment and growth, and that total capital spending in the territory, public and private, was 1,661 million dollars in 2024. It says Qulliq Energy Corporation and a subsidiary of the Qikiqtani Inuit Association signed an MOU on a possible hydro project of 15 to 30 megawatts outside Iqaluit; the project is potential, not committed.

Evidence: Government of Nunavut, Department of Finance: Budget 2026-27 Fiscal and Economic Indicators

Historical context

The Canada Energy Regulator says the Qulliq Energy Corporation operates 25 diesel plants in 25 communities, that there are no regional or territorial electricity grids, and that almost all electricity comes from diesel fuel imported in summer and stored for the year.

Evidence: Canada Energy Regulator: Provincial and territorial energy profiles: Nunavut

Historical context

The finance department says that Baffinland's expansion would raise annual output at Mary River from 4.2 million to 22 million tonnes, but only subject to financing and logistics and at a time when the company was seeking creditor protection.

Evidence: Government of Nunavut, Department of Finance: Budget 2026-27 Fiscal and Economic Indicators

Historical context

The Major Projects Office describes the proposed Grays Bay Road and Port as an all-season road of about 230 kilometres delivered through West Kitikmeot Resources Corporation, a partnership of the Kitikmeot Inuit Association and private investors, with federal funding announced for planning and preconstruction; it is not a designated project.

Evidence: Government of Canada, Major Projects Office: Grays Bay Road and Port

Trade and tariff exposure

Opinion

No source cited here gives the share of Nunavut's exports that go to the United States or a breakdown of exports by destination, so that share is not stated.

Historical context

CMHC says that in Nunavut the effects of tariffs should track national trends, with greater sensitivity because of less economic diversification.

Evidence: Canada Mortgage and Housing Corporation: Northern Housing Report

Historical context

The finance department reports that after the U.S. Supreme Court struck down emergency tariffs in February 2026 the White House implemented a global 10 per cent tariff alongside sectoral tariffs including 50 per cent on steel and aluminum, and that mining now accounts for almost half of the economy.

Evidence: Government of Nunavut, Department of Finance: Budget 2026-27 Fiscal and Economic Indicators

Opinion

Reading these together, the exposure the sources describe is to a mining economy's prices and to import costs for a territory that relies on shipped fuel and goods, not a measured share of sales to the United States; that reading is the research desk's, not a source's.

Labour, productivity, wages, demographics, housing and migration

Historical context

The finance department reports that unemployment rose to over 10 per cent in 2025 (nationally 6.8 per cent), that participation was 60 per cent against 65 per cent Canada-wide, and that the employment rate was unchanged at 54 per cent against 61 per cent nationally. It says tight housing conditions do much to discourage workers from entering or staying in the workforce.

Evidence: Government of Nunavut, Department of Finance: Budget 2026-27 Fiscal and Economic Indicators

Historical context

It also reports a wage premium of 58 per cent over a national average of $1,126 a week, which it attributes to a growing economy, a shortage of skilled labour and the high cost of living in the north. Statistics Canada's monthly earnings series averaged C$1,330 a week a week nationally over the latest twelve months, against C$1,854 a week in Nunavut, which implies a smaller premium; the department does not define its national figure. It says each worker produced roughly $180,000 of GDP in 2024 and that output per hour worked is about 1.4 times the national average, names the territory's mineral wealth as much of the reason, and warns that productivity depends on capital investment rather than worker skill.

Evidence: Government of Nunavut, Department of Finance: Budget 2026-27 Fiscal and Economic Indicators

Historical context

It estimates fly-in, fly-out workers at almost 7,400 in 2025, and annual migration at a net loss of 255.

Evidence: Government of Nunavut, Department of Finance: Budget 2026-27 Fiscal and Economic Indicators

Historical context

CMHC says that Nunavut continued to lose working-age residents to other parts of Canada amid severe affordability and housing pressures, and that the Iqaluit vacancy rate stayed at 0.3 per cent for a third year.

Evidence: Canada Mortgage and Housing Corporation: Northern Housing Report

Historical context

The Auditor General reports that the government committed to building 3,000 homes by 2030, including 1,400 public housing units, and that the Nunavut Housing Corporation did not know whether units were going to the applicants with the greatest need.

Evidence: Office of the Auditor General of Canada: The government must act to provide Nunavummiut with access to suitable public housing

Why it matters

Opinion

The territory's budget and its economy move on separate clocks: revenue follows federal formulas and agreements that rose in 2026-27, while output follows gold and iron-ore prices and the fortunes of a few mines. The sources cited describe both but do not link them, and no source reports that mine output changes the transfer.

History

Real output at basic prices in Nunavut (chained 2017 dollars, Statistics Canada table 36-10-0711-01) was C$4.2 billion in 2025, a change of 66.2% over ten years. Over the same ten years goods-producing industries changed 146.5% and services-producing industries 25.3%; mining, quarrying and oil and gas changed 176.1%, manufacturing -10.0% and the public sector 17.6%. These are changes in real output, not in income or jobs, and the table gives no reason for the differences; the sourced paragraphs in this section and in the story give the explanations that named sources offer.

Real output by industry in Nunavut, indexed

Real GDP at basic prices, chained 2017 dollars, annual (Statistics Canada table 36-10-0711-01); first year shown = 100. Goods and services against the total, with mining and oil and gas, manufacturing and the public sector. Chained-dollar levels are not additive, so only changes are compared.

Chart loads when it comes into view.

Latest values: All industries 4,152,000,000 (2025); Goods-producing industries 2,042,000,000 (2025); Services-producing industries 2,084,000,000 (2025); Mining, quarrying and oil and gas 1,412,000,000 (2025); and 2 more in the data table.

Labour productivity, meaning real value added per hour worked in chained 2017 dollars (Statistics Canada table 36-10-0713-01), was C$88.30 an hour in Nunavut in 2025, a change of 18.4% over ten years. In goods-producing industries it was C$114.30 an hour (a change of 23.4% over ten years) and in services-producing industries C$71.00 an hour (a change of 4.9%). A high level can reflect capital-intensive industries such as oil, gas and mining rather than the efficiency of the whole economy, and the table says nothing about why levels or changes differ.

Labour productivity in Nunavut: goods and services

Real value added per hour worked, chained 2017 dollars, annual (Statistics Canada table 36-10-0713-01). Goods-producing industries include mining and oil and gas, so their level reflects capital-intensive resource extraction as well as manufacturing and construction.

Chart loads when it comes into view.

Latest values: All industries 88.3 (2025); Goods-producing industries 114.3 (2025); Services-producing industries 71 (2025).

Historical context

The finance department says the first credit rating, issued in August 2012 by Moody's, was Aa1, and that DBRS Morningstar first issued its grade in December 2018 and confirmed it each year, until the March 2026 upgrade.

Evidence: Government of Nunavut, Department of Finance: Budget 2026-27 Fiscal and Economic Indicators

Across geographies

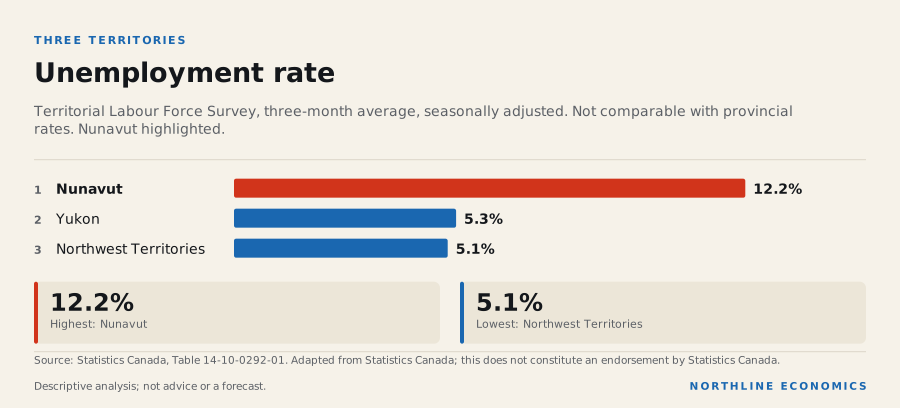
Among the three territories in October 2026, Nunavut's unemployment rate was 12.2% against 5.1% in the Northwest Territories and 5.3% in Yukon (Nunavut ranks 1st of 3 for the highest rate), and its employment rate was 54.4% against 67.8% and 68.9%. Territorial surveys are small and smoothed, and these are not ranked against provinces.

On public finances, in Statistics Canada's accounts for the fiscal year that began in April 2024, grants were 82.8% of revenue in Nunavut, 74.0% in the Northwest Territories and 85.0% in Yukon. Net operating balance was C$64 million in Nunavut, C$252 million in the Northwest Territories and C$20 million in Yukon; liabilities were C$962 million, C$1.8 billion and C$795 million.

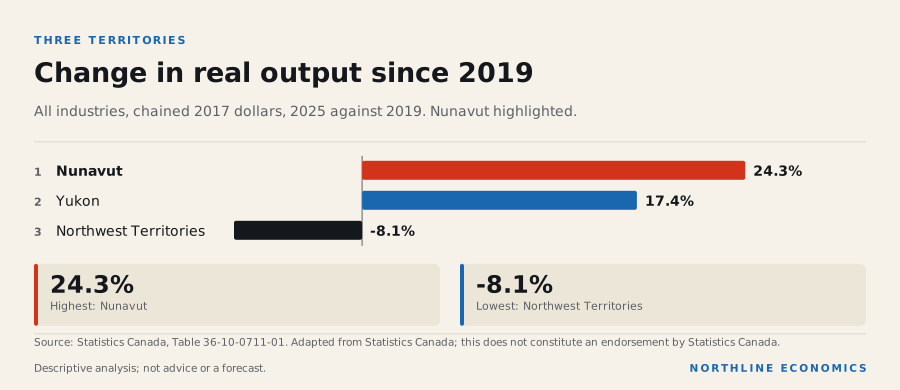
In August 2026 weekly earnings were C$1,922 a week in Nunavut, C$1,792 a week in the Northwest Territories and C$1,554 a week in Yukon. Real output across all industries changed 24.3% between 2019 and 2025 in Nunavut, -8.1% in the Northwest Territories and 17.4% in Yukon. Net interprovincial migration over the latest four quarters was 298 people for Nunavut, -801 for the Northwest Territories and 503 for Yukon.

Historical context

Statistics Canada reported in May 2026 that the Northwest Territories was the only jurisdiction where GDP declined in 2025, a second consecutive year, though its revised series now shows a small rise in 2024, while Nunavut's mining fell as iron ore declined but construction rose on a new gold mine and the Whale Cove rebuild.

Evidence: Statistics Canada: The Daily: Gross domestic product by industry: Provinces and territories, 2025

Historical context

Job Bank says the Northwest Territories' economy contracted in 2025 on reduced diamond production, with the Diavik mine closing in March 2026, that Yukon's contracted after the Eagle Gold Mine closed (Statistics Canada's revised accounts of 5 November 2026 say instead that GDP rose in Yukon in 2025), and that Nunavut was the only territory whose unemployment rate rose, to the highest in Canada. It also says net interprovincial migration was negative in both the Northwest Territories and Nunavut over five years, but positive in Yukon. Job Bank counts four operating gold mines in Nunavut, while the territory's finance department counts two operating gold mines with one in redevelopment; the counts are not reconciled.

Evidence: Employment and Social Development Canada (Job Bank): Economic Scan - Yukon, Northwest Territories and Nunavut: 2026; Statistics Canada: The Daily: Provincial and territorial economic accounts, 2025

Opinion

Taken together, the sources suggest the three territories differ by which mines they lean on: diamonds in the Northwest Territories, a closed gold mine in Yukon, and gold plus iron ore in Nunavut. No source tests this comparison, and Nunavut's much younger population and housing shortage are separate stated factors.

What it influences

Historical context

Finance Canada says Territorial Formula Financing is the largest federal transfer to the three territorial governments and recognizes the high cost of providing public services in the North.

Evidence: Department of Finance Canada: Territorial Formula Financing

Historical context

Job Bank says Nunavut has the youngest population in Canada, with a median age of 27.1 years.

Evidence: Employment and Social Development Canada (Job Bank): Economic Scan - Yukon, Northwest Territories and Nunavut: 2026

Risks

Historical context

The finance department names financial trouble at Baffinland, owner of the Mary River iron mine, as a downside risk to its forecast of GDP growth of over 11 per cent in 2026; a private forecaster cited by Job Bank puts it lower, and the forecasts are not reconciled.

Evidence: Government of Nunavut, Department of Finance: Budget 2026-27 Fiscal and Economic Indicators

Historical context

CMHC says utility costs are higher in the North, partly because of isolated grids and reliance on diesel generation.

Evidence: Canada Mortgage and Housing Corporation: Northern Housing Report

What to watch

Historical context

The federal government says the transfer of responsibilities is to be completed by April 1, 2027. The Nunavut Public Accounts for 2026-27, Baffinland's financing outcome, the Major Projects Office decision on Grays Bay, the royalty estimates once devolution is complete and Statistics Canada's territorial export data show how these questions are resolved. These are the publishers' figures and forecasts, not Northline's.

Evidence: Crown-Indigenous Relations and Northern Affairs Canada: Nunavut devolution
Written profile

What do the data show about the Nunavut economy?

Nunavut had 43 thousand residents on 1 July 2026, and its government's net operating balance, on Statistics Canada's basis, was C$64 million in the fiscal year that began in April 2024

Nunavut against the other territories

Nunavut has the highest unemployment rate and the lowest participation rate of the three territories, and the fastest output growth. In October 2026 the unemployment rate was 12.2%, the participation rate 62.0% and the employment rate 54.4%, from a small survey that is not comparable with provincial rates. Real output across all industries is 24.3% above 2019, the fastest of the three, and real GDP at market prices, measured at 2017 constant prices, is 20.8% above 2019, against 17.7% for Yukon. Output growth and the share of people with jobs measure different things, and the data here do not show which industries employ people.

Unemployment rate. Nunavut 12.2%; Yukon 5.3%; Northwest Territories 5.1%.
The data behind this graphic
Unemployment rate
ItemValue
Nunavut12.2%
Yukon5.3%
Northwest Territories5.1%

Download this graphic (SVG, with source)

Growth from mining and health care

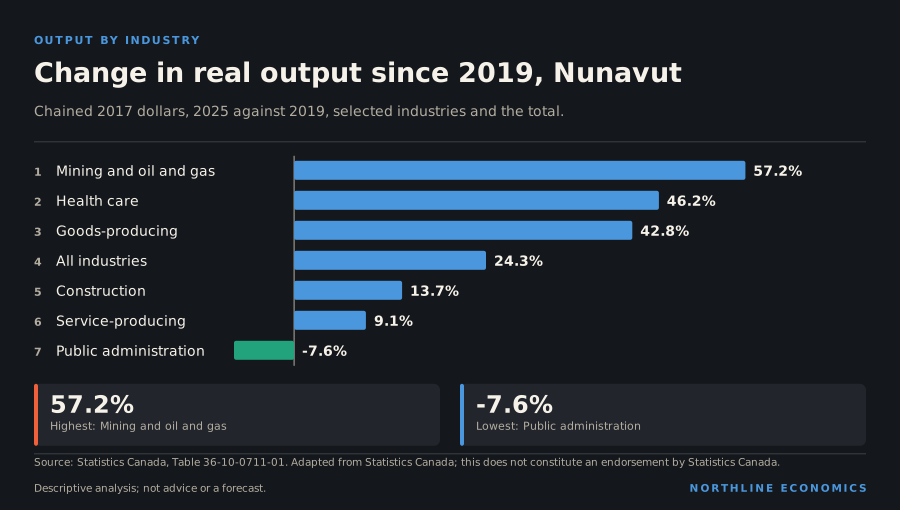
Between 2019 and 2025, goods-producing output grew 42.8% and mining, quarrying and oil and gas extraction grew 57.2%. Health care grew 46.2%, construction 13.7% and service-producing output 9.1%, while public administration changed by -7.6%. Labour productivity, real value added per hour worked, was C$88.30 an hour in 2025, the highest of the three territories, up 6.1% since 2019. Output per hour worked is an average of value added and does not indicate the earnings of most residents.

Change in real output since 2019, Nunavut. Mining and oil and gas 57.2%; Health care 46.2%; Goods-producing 42.8%; All industries 24.3%; Construction 13.7%; Service-producing 9.1%; Public administration -7.6%.
The data behind this graphic
Change in real output since 2019, Nunavut
ItemValue
Mining and oil and gas57.2%
Health care46.2%
Goods-producing42.8%
All industries24.3%
Construction13.7%
Service-producing9.1%
Public administration-7.6%

Download this graphic (SVG, with source)

Change in real output since 2019. Nunavut 24.3%; Yukon 17.4%; Northwest Territories -8.1%.
The data behind this graphic
Change in real output since 2019
ItemValue
Nunavut24.3%
Yukon17.4%
Northwest Territories-8.1%

Download this graphic (SVG, with source)

People, pay and spending

The population was 43 thousand on 1 July 2026, 2.3% higher than a year earlier and 55.0% higher than on 1 January 2001. Net movement to and from the provinces was 298 persons and immigrants numbered 102, which together account for only part of the increase; births and deaths are not in these series. Average weekly earnings of C$1,922 a week in August 2026 were the highest of the three territories and 4.2% higher than a year earlier; retail sales in August 2026 were 8.7% higher than a year earlier. These nominal figures are not adjusted for Nunavut's high cost of living, and no consumer price series is published for it in this library.

The public accounts

In Statistics Canada's government finance statistics for the fiscal year that began in April 2024, the territorial government had revenue of C$3.3 billion, of which C$2.7 billion was grants from other governments, 82.8% of revenue. The net operating balance was C$64 million, liabilities were 0.29 times revenue, the lowest of any province or territory, and net worth of C$5.2 billion is the largest of the three territories. Transfers fund most of the government's spending, so the fiscal position depends heavily on federal policy.

What it means for decisions

Opinion

For a business, Nunavut is a small and growing market with the highest pay of the three territories and a low employment rate. For a lender or investor, the output growth is tied to mining, and the data here do not show whether it will continue. For a policymaker, the contrast between rising output and an unemployment rate of 12.2% is the central finding.

What the data cannot say: they do not describe individual communities, mining projects or the cost of living, the survey is small, and a few operations can move percentage changes. Nothing here is a forecast.

Labour market

In the territorial Labour Force Survey (three-month average, seasonally adjusted, a smaller survey than the provincial one), the unemployment rate was 12.2% in October 2026, the participation rate 62.0% and the employment rate 54.4%. These rates are not comparable with the provincial monthly rates and are not ranked against them.

Unemployment rate in the territories

Percent, three-month moving average, seasonally adjusted, 15 years and over (territorial Labour Force Survey; not comparable with the provincial monthly rates).

Chart loads when it comes into view.

Latest values: Nunavut 12.2 (2026-10); Yukon 5.3 (2026-10); Northwest Territories 5.1 (2026-10).

People and output

The population was 2.3% higher than four quarters earlier, with net interprovincial migration of 298 persons over the latest four quarters. Real GDP at 2017 constant prices was C$4.1 billion in 2025. Average weekly earnings were C$1,922 a week in August 2026.

Population of the territories, indexed

Quarterly estimates; start of period = 100.

Chart loads when it comes into view.

Latest values: Nunavut 43,090 (2026 Q3); Yukon 50,360 (2026 Q3); Northwest Territories 45,900 (2026 Q3).

Long-run perspective

Population is 55.0% higher on 1 July 2026 than on 1 January 2001, against 35.6% for Canada as a whole.

Average weekly earnings, in current dollars and not seasonally adjusted, are 120.9% higher in August 2026 than in the same month twenty-five years earlier (106.8% for Canada). These are nominal figures: they include the effect of price increases over twenty-five years and are not a measure of the change in purchasing power.

These comparisons describe the size of changes between two dates. They do not say why this jurisdiction differs from Canada, and the end points can matter: a different starting year changes the percentage.

Public finances

In Statistics Canada's government finance statistics for the fiscal year that began in April 2024, the territorial government's revenue was C$3.3 billion and its expense C$3.3 billion, leaving a net operating balance of C$64 million. Grants received from other governments were C$2.7 billion, 82.8% of revenue (mostly federal transfers; not split by payer in the table). Liabilities were C$962 million and net worth C$5.2 billion. These are past-year accounts, not the current budget.

What is not assessed

Consumer prices (published for capital cities only), housing, industry structure, exports, the current budget, major projects and policy changes, and why Nunavut differs from other places. This profile cites no source that explains these differences, and nothing here is a forecast.

1 · Where it ranks

Nunavut among the places with data

Same values as the Canada atlas layers. Rank 1 is the highest value, which is not always the most favourable outcome. A measure the source does not publish for a place is simply absent.

MeasureLatestPeriodRank (1 = highest)
Population growth
% change over 4 quarters
2.3%2026 Q32 of 13
Average weekly earnings
C$ per week
$1,9222026-081 of 13
Job vacancy rate
%, unadjusted
2.6%2026-0810 of 13 (tied)
Retail sales growth
% change, latest 12 months vs the 12 before
8.2%2026-081 of 13
Building construction investment growth
% change, latest 12 months vs the 12 before
62.2%2026-082 of 13
Real GDP growth (annual)
% change, annual, chained 2017 dollars
-2.7%202513 of 13
Immigrants per 1,000 residents
persons per 1,000 residents, latest 4 quarters
2.42026 Q213 of 13
Non-permanent residents, net change per 1,000
persons per 1,000 residents, latest 4 quarters
0.82026 Q23 of 13
Net interprovincial migration per 1,000
persons per 1,000 residents, latest 4 quarters
7.02026 Q22 of 13
Provincial government net operating balance
% of revenue, fiscal year beginning in April
1.9%20245 of 13
Grants received from other governments
% of revenue, fiscal year beginning in April
82.8%20242 of 13

See Nunavut on the atlas →

2 · Labour market

Unemployment, participation, employment and earnings

Nunavut is emphasised; the other territories are shown for context. The territorial survey is a different, smoothed table: do not compare these rates with provincial charts.

Unemployment rate in the territories

Percent, three-month moving average, seasonally adjusted, 15 years and over (territorial Labour Force Survey; not comparable with the provincial monthly rates).

Chart loads when it comes into view.

Latest values: Nunavut 12.2 (2026-10); Yukon 5.3 (2026-10); Northwest Territories 5.1 (2026-10).

Participation rate in the territories

Percent of the population aged 15 and over, three-month moving average, seasonally adjusted.

Chart loads when it comes into view.

Latest values: Nunavut 62 (2026-10); Yukon 73 (2026-10); Northwest Territories 71.4 (2026-10).

Employment rate in the territories

Percent of the population aged 15 and over, three-month moving average, seasonally adjusted.

Chart loads when it comes into view.

Latest values: Nunavut 54.4 (2026-10); Yukon 68.9 (2026-10); Northwest Territories 67.8 (2026-10).

Average weekly earnings in the territories

Current dollars per week, industrial aggregate incl. overtime, not seasonally adjusted.

Chart loads when it comes into view.

Latest values: Nunavut 1,922 (2026-08); Yukon 1,554 (2026-08); Northwest Territories 1,792 (2026-08).

3 · People

Population and immigration

Quarterly population estimates and four-quarter immigration totals.

Population of the territories, indexed

Quarterly estimates; start of period = 100.

Chart loads when it comes into view.

Latest values: Nunavut 43,090 (2026 Q3); Yukon 50,360 (2026 Q3); Northwest Territories 45,900 (2026 Q3).

Immigrants to the territories (4-quarter total)

New permanent residents arriving over the previous four quarters.

Chart loads when it comes into view.

Latest values: Nunavut 102 (2026 Q2); Yukon 759 (2026 Q2); Northwest Territories 520 (2026 Q2).

4 · Output and activity

GDP, retail and construction

Annual real GDP and monthly activity indicators, indexed so the start of the period equals 100.

Real GDP of the territories, indexed

Annual, 2017 constant prices (not chained); start of the period = 100. Expenditure-based.

Chart loads when it comes into view.

Latest values: Nunavut 4,139,000,000 (2025); Yukon 3,425,000,000 (2025); Northwest Territories 4,168,000,000 (2025).

Retail sales in the territories, indexed

Seasonally adjusted; start of period = 100.

Chart loads when it comes into view.

Latest values: Nunavut 65,900,000 (2026-08); Yukon 107,000,000 (2026-08); Northwest Territories 85,900,000 (2026-08).

Investment in new building construction in the territories, indexed

Current dollars, not seasonally adjusted, 12-month sum; start of the period = 100.

Chart loads when it comes into view.

Latest values: Nunavut 341,300,000 (2026-08); Yukon 502,900,000 (2026-08); Northwest Territories 138,100,000 (2026-08).

Real output by industry in Nunavut, indexed

Real GDP at basic prices, chained 2017 dollars, annual (Statistics Canada table 36-10-0711-01); first year shown = 100. Goods and services against the total, with mining and oil and gas, manufacturing and the public sector. Chained-dollar levels are not additive, so only changes are compared.

Chart loads when it comes into view.

Latest values: All industries 4,152,000,000 (2025); Goods-producing industries 2,042,000,000 (2025); Services-producing industries 2,084,000,000 (2025); Mining, quarrying and oil and gas 1,412,000,000 (2025); and 2 more in the data table.

Labour productivity in the territories

Real value added per hour worked, all industries, chained 2017 dollars (Statistics Canada table 36-10-0713-01), annual. Territorial output per hour reflects mining and public administration and small populations, and is not comparable with provinces.

Chart loads when it comes into view.

Latest values: Nunavut 88.3 (2025); Yukon 66.5 (2025); Northwest Territories 83.2 (2025).

Labour productivity in Nunavut: goods and services

Real value added per hour worked, chained 2017 dollars, annual (Statistics Canada table 36-10-0713-01). Goods-producing industries include mining and oil and gas, so their level reflects capital-intensive resource extraction as well as manufacturing and construction.

Chart loads when it comes into view.

Latest values: All industries 88.3 (2025); Goods-producing industries 114.3 (2025); Services-producing industries 71 (2025).

Change in real output by industry in the territories, 2015 to 2025

Percent change in real GDP at basic prices (chained 2017 dollars, annual) over ten years. Each industry is compared with itself; chained-dollar levels are not additive, so shares of the total are not shown. A measure of the change in output, not of income or employment.

Chart loads when it comes into view.

Top values: Nunavut 66.2%; Yukon 30%; Northwest Territories -9.1%.

5 · Public finances

The provincial or territorial government's accounts

Statistics Canada government finance statistics (public-accounts basis), fiscal years ended 31 March. Annual, and about two years behind: past position, not this year's budget.

MeasureLatestFiscal year beginning in AprilYear before
RevenueC$3.3 billion2024C$3.2 billion
Grants received from other governments (part of revenue)C$2.7 billion2024C$2.7 billion
ExpenseC$3.3 billion2024C$3.0 billion
Net operating balance (revenue minus expense)C$0.1 billion2024C$0.2 billion
Liabilities (end of fiscal year)C$1.0 billion2024C$0.9 billion
Net worth (end of fiscal year; negative = liabilities exceed assets)C$5.2 billion2024C$5.1 billion

Computed: grants from other governments were 82.8% of revenue in the fiscal year that began in April 2024; the table does not say which government paid them, and most are federal transfers. Compare on the atlas →

Computed: the net operating balance was 1.9% of revenue in the fiscal year that began in April 2024. Compare on the atlas →

6 · Not assessed

What this profile does not cover

Listed so that silence is not mistaken for absence of an issue.