
Nova Scotia: provincial economy at a glance
Latest values, rankings and charts for Nova Scotia, all computed from Statistics Canada data held by this platform. The economic story below explains with attributed statements from official sources; the profile only computes. Forecasts quoted are their publishers' and Northline publishes none.
Opens a workspace prepared from the published Nova Scotia measures, with what is missing stated.
What do the data show about the Nova Scotia economy?
Nova Scotia's unemployment rate was 6.2% in October 2026, its prices were up 5.6% in the year to September 2026 and its government's net operating balance, on Statistics Canada's basis, was 3.0% of revenue in the fiscal year that began in April 2024
Nova Scotia against the other nine
Nova Scotia has one of the strongest growth records among the provinces and a labour market that is moderate rather than tight. Real GDP grew 16.8% from 2019 to 2025, third of ten (22.4% from 2020, when the pandemic depressed output, also third), and output across all industries is 15.9% above 2019, also third. Employment changed by 4.1% from a year earlier, the strongest of the ten. The unemployment rate of 6.2% is down from 6.7% a year earlier, seventh of ten, and the participation rate of 62.4% is eighth.
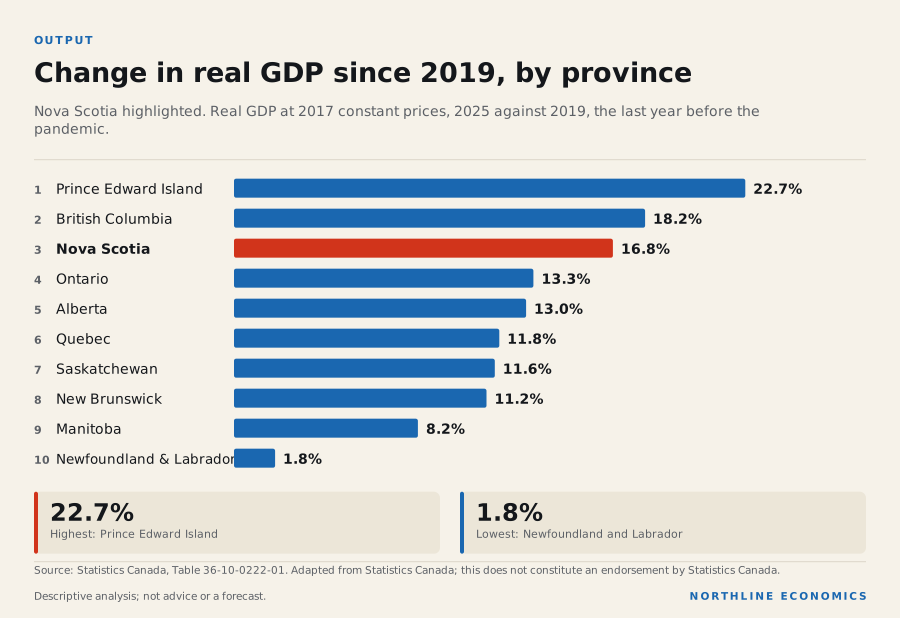
The data behind this graphic
| Item | Value |
|---|---|
| Prince Edward Island | 22.7% |
| British Columbia | 18.2% |
| Nova Scotia | 16.8% |
| Ontario | 13.3% |
| Alberta | 13.0% |
| Quebec | 11.8% |
| Saskatchewan | 11.6% |
| New Brunswick | 11.2% |
| Manitoba | 8.2% |
| Newfoundland and Labrador | 1.8% |
Prices are the offsetting fact. Consumer prices rose 5.6% in the twelve months to September 2026, the second highest of the ten provinces, and average weekly earnings growth of 3.6% in the twelve months to August 2026, sixth of ten, fell short of inflation. The population grew 0.8% in the year to 1 July 2026, level with Prince Edward Island at one decimal and behind Alberta, New Brunswick and Saskatchewan; net movement to and from other provinces over the latest four quarters was 3,863 persons, third highest, and non-permanent residents changed by -357.
Construction and services, not resources
Among the industries shown, output grew fastest between 2019 and 2025 in professional services (42.1%), construction (36.5%, third of ten) and health care (24.3%). Measured by the change in chained 2017 dollars, the largest gains were in real estate and rental and leasing (C$1.3 billion) and health care (C$1.1 billion), against C$917 million for construction. Manufacturing grew 4.7%, one of only four provinces where factory output is above its 2019 level. Agriculture changed by -12.8% and mining and oil and gas extraction by -44.2%, the weakest mining figure among the provinces, in industries that employ few people here: in 2025 mining and oil and gas extraction employed 0.5% of workers.
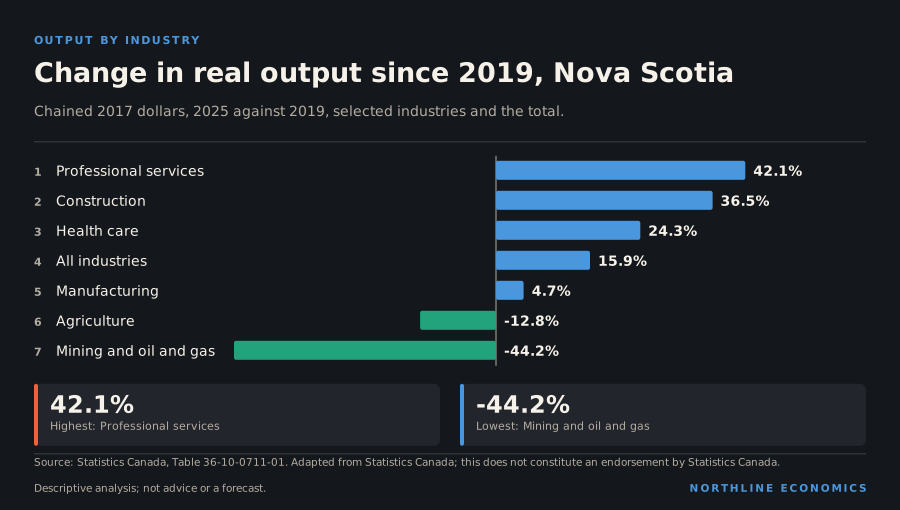
The data behind this graphic
| Item | Value |
|---|---|
| Professional services | 42.1% |
| Construction | 36.5% |
| Health care | 24.3% |
| All industries | 15.9% |
| Manufacturing | 4.7% |
| Agriculture | -12.8% |
| Mining and oil and gas | -44.2% |
Domestic goods exports were C$6.6 billion in 2025, 69.4% of them to the United States and 0.8% energy products. In 2025 the largest employers were health care (16.4% of jobs), retail (12.4%), construction and education.
Building at a steady pace, with the lowest liabilities relative to revenue
Housing starts over the latest twelve months were 7.0 per thousand residents, fifth of ten, against a five-year rate of 6.8: the pace is close to its recent norm. In the fiscal year that began in April 2024 the government's net operating balance was C$520 million on revenues of C$17.6 billion, a surplus of 3.0% of revenue, and its liabilities were 1.30 times revenue, the lowest multiple of the ten provinces. The basis is Statistics Canada's, not the province's own accounts.
The province's own public accounts reported a surplus of $264.8 million for fiscal 2024-25 and a deficit of $1.4 billion for 2025-26.
Evidence: Government of Nova Scotia (Finance and Treasury Board): News release: First Budget 2025-26 Update, Public Accounts 2024-25 Released (22 September 2025); Government of Nova Scotia (Finance and Treasury Board): News release: First Budget 2026-27 Update, Public Accounts for 2025-26 Released (24 September 2026)
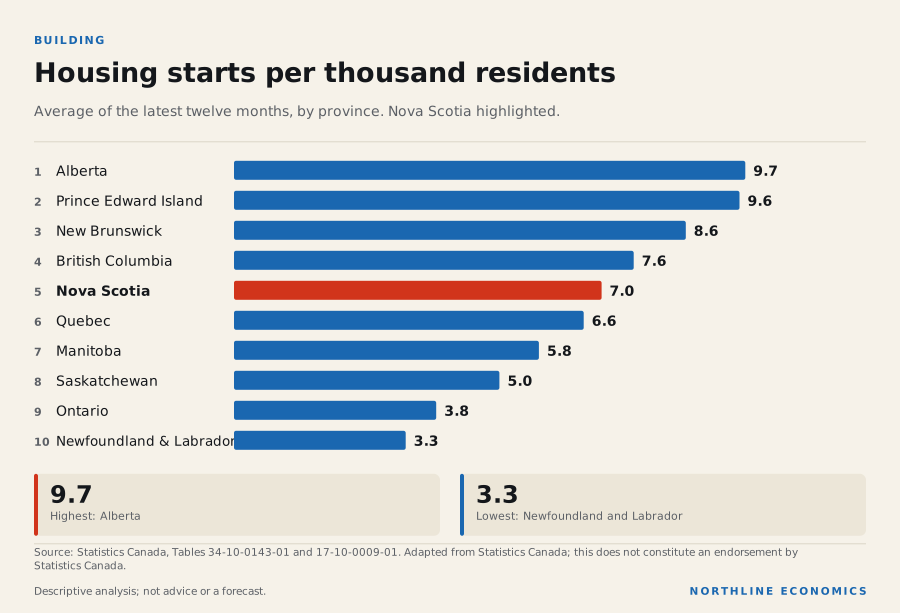
The data behind this graphic
| Item | Value |
|---|---|
| Alberta | 9.7 |
| Prince Edward Island | 9.6 |
| New Brunswick | 8.6 |
| British Columbia | 7.6 |
| Nova Scotia | 7.0 |
| Quebec | 6.6 |
| Manitoba | 5.8 |
| Saskatchewan | 5.0 |
| Ontario | 3.8 |
| Newfoundland and Labrador | 3.3 |
What it means for decisions
For a business, Nova Scotia is a small but growing market in which construction, professional services and health care have expanded and the main local cost pressure is prices. For a lender, liabilities are the lowest of the ten provinces relative to revenue on one year's evidence. For a household, jobs have grown but over the latest year earnings have not kept pace with prices.
What the data cannot say: they do not separate Halifax from the rest of the province, they do not explain why prices have risen faster than in most provinces, and the labour survey is a sample. Nothing here is a forecast.
Labour market and prices
The unemployment rate was 6.2% in October 2026, ranking 7th of 10 among the ten provinces (1st = highest). Employment changed by 4.1% over the year and the participation rate was 62.4%. Average weekly earnings were C$1,223 a week in August 2026, ranking 9th of 10. Consumer prices were up 5.6% in September 2026 on a year earlier, ranking 2nd of 10.
Unemployment rate by province
Percent, seasonally adjusted, monthly. Province series, Labour Force Survey.
Chart loads when it comes into view.
Latest values: Nova Scotia 6.2 (2026-10); British Columbia 6.3 (2026-10); Alberta 7.3 (2026-10); Saskatchewan 5.9 (2026-10); and 6 more in the data table.
Related relationships: Alberta · British Columbia · Saskatchewan · Manitoba
People and output
The population was 0.8% higher than four quarters earlier. Net interprovincial migration over the latest four quarters was 3,863 persons (negative = net outflow), and non-permanent residents changed by -357. Real GDP changed 22.4% from 2020, when the pandemic depressed output, to 2025, and 16.8% from 2019. Retail sales in August 2026 were 8.5% higher than a year earlier.
Population by province, indexed
Quarterly estimates; start of period = 100.
Chart loads when it comes into view.
Latest values: Nova Scotia 1,103,000 (2026 Q3); British Columbia 5,711,000 (2026 Q3); Alberta 5,101,000 (2026 Q3); Saskatchewan 1,278,000 (2026 Q3); and 6 more in the data table.
Related relationships: Alberta · British Columbia · Saskatchewan · Manitoba
Real GDP by province, indexed
Annual, 2017 constant prices (not chained); start of the period = 100. Expenditure-based.
Chart loads when it comes into view.
Latest values: Nova Scotia 53,070,000,000 (2025); British Columbia 356,100,000,000 (2025); Alberta 382,600,000,000 (2025); Saskatchewan 90,590,000,000 (2025); and 6 more in the data table.
Economic structure and trade exposure
In 2025 (the year of the table's latest annual average), health care and social assistance employed 16.4% of Nova Scotia's workers, retail trade 12.4%, construction 8.3% and public administration 7.4%. Among goods-producing groups, agriculture 0.7%; forestry, fishing, mining, quarrying, oil and gas 2.1%; and manufacturing 6.7%. Finance and insurance employed 4.4% and professional, scientific and technical services 7.1%.
How much of each province’s employment is in one industry
Share of provincial employment, 2025 annual average (Labour Force Survey). A measured exposure to an industry, not an estimate of how much output or income depends on it. “Resources” combines forestry, fishing, mining, quarrying and oil and gas.
Chart loads when it comes into view.
Top values: Newfoundland and Labrador 6.37%; Alberta 5.58%; Saskatchewan 3.76%.
Domestic merchandise exports were C$6.6 billion in calendar year 2025. 69% went to the United States and energy products were 1% of the total; energy products sent to the United States were 0.3% of all the province's domestic exports. These are customs-basis goods exports assigned to the province of origin as Statistics Canada defines it; they exclude services, which are a large part of some provincial economies, and the province of export clearance can differ from the province of production for some commodities.
Where each province’s goods exports go, and what they are, 2025
Share of each province’s domestic merchandise exports (customs basis). A measured exposure of export value to one market or one commodity group, not an estimate of how much income or employment depends on it.
Chart loads when it comes into view.
Top values: New Brunswick 90.4%; Alberta 85.43%; Prince Edward Island 80.05%.
Employment shares and export shares describe the structure of the economy; they do not by themselves show which industries drive growth, incomes or public revenue, or how exposed the province is to a given shock.
Long-run perspective
Population is 29.3% higher on 1 July 2026 than on 1 January 1981, against 69.5% for Canada as a whole. Real GDP (at 2017 constant prices) is 132.7% higher in 2025 than in 1981; this is a level comparison between two years, not an average annual rate, and it is not compared with a national figure here because the national real GDP series is monthly and on a different basis.
Employment is 46.8% higher in October 2026 than in June 1993, the start of the national series used here (65.1% for Canada). Over the past forty years the unemployment rate has ranged from 5.4% (January 2023) to 15.7% (December 1993); it was 6.2% in October 2026, against 6.7% for Canada.
Employment by province, indexed
Seasonally adjusted; start of period = 100.
Chart loads when it comes into view.
Latest values: Nova Scotia 543,000 (2026-10); British Columbia 2,941,000 (2026-10); Alberta 2,660,000 (2026-10); Saskatchewan 624,600 (2026-10); and 6 more in the data table.
Related relationships: Alberta · British Columbia · Saskatchewan · Manitoba · 2 relationships use this data as evidence
Average weekly earnings, in current dollars and not seasonally adjusted, are 111.2% higher in August 2026 than in the same month twenty-five years earlier (106.8% for Canada). These are nominal figures: they include the effect of price increases over twenty-five years and are not a measure of the change in purchasing power.
These comparisons describe the size of changes between two dates. They do not say why this jurisdiction differs from Canada, and the end points can matter: a different starting year changes the percentage.
Public finances
For the fiscal year that began in April 2024, on Statistics Canada's basis, the provincial government's revenue was C$17.6 billion and its expense C$17.1 billion, leaving a net operating balance of C$520 million (3.0% of revenue). Grants received from other governments (mostly federal transfers; the table does not split them by payer) were C$6.1 billion, 34.6% of revenue. Liabilities at the end of the year were C$22.8 billion and net worth -C$755 million. These are past-year accounts, not the current budget.
What is not assessed
Why these figures differ from other provinces, industry structure beyond the latest employment shares, housing prices and rents, exports by destination over time, the current budget and credit ratings, major projects, and policy changes. This profile cites no source that explains Nova Scotia's position, and nothing here is a forecast.
Nova Scotia among the ten provinces
Same values as the Canada atlas layers. Rank 1 is the highest value, which is not always the most favourable outcome. A measure the source does not publish for a place is simply absent.
| Measure | Latest | Period | Rank (1 = highest) |
|---|---|---|---|
| Unemployment rate %, seasonally adjusted, monthly | 6.2% | 2026-10 | 7 of 10 |
| Participation rate %, seasonally adjusted | 62.4% | 2026-10 | 8 of 10 |
| Inflation (CPI) % change, 12 months | 5.6% | 2026-09 | 2 of 10 |
| Population growth % change over 4 quarters | 0.8% | 2026 Q3 | 6 of 13 (tied) |
| Average weekly earnings C$ per week | $1,223 | 2026-08 | 12 of 13 |
| Job vacancy rate %, unadjusted | 3.3% | 2026-08 | 5 of 13 |
| Housing starts (12-month average, annual rate) units, annual rate | 7,701 | 2026-09 | 6 of 10 |
| Retail sales growth % change, latest 12 months vs the 12 before | 4.8% | 2026-08 | 6 of 13 |
| Manufacturing shipments growth % change, latest 12 months vs the 12 before | 0.9% | 2026-08 | 10 of 10 |
| Building construction investment growth % change, latest 12 months vs the 12 before | 3.3% | 2026-08 | 11 of 13 |
| Real GDP growth (annual) % change, annual, chained 2017 dollars | 3.1% | 2025 | 5 of 13 |
| Average hourly wage rate C$ per hour | $34.02 | 2026-10 | 6 of 10 |
| Immigrants per 1,000 residents persons per 1,000 residents, latest 4 quarters | 8.7 | 2026 Q2 | 10 of 13 |
| Non-permanent residents, net change per 1,000 persons per 1,000 residents, latest 4 quarters | -0.3 | 2026 Q2 | 4 of 13 |
| Net interprovincial migration per 1,000 persons per 1,000 residents, latest 4 quarters | 3.5 | 2026 Q2 | 4 of 13 |
| Provincial government net operating balance % of revenue, fiscal year beginning in April | 3.0% | 2024 | 4 of 13 |
| Grants received from other governments % of revenue, fiscal year beginning in April | 34.6% | 2024 | 7 of 13 |
Jobs, unemployment and wages
Nova Scotia is emphasised; the other provinces are shown for context. Click legend items to hide lines.
Unemployment rate by province
Percent, seasonally adjusted, monthly. Province series, Labour Force Survey.
Chart loads when it comes into view.
Latest values: Nova Scotia 6.2 (2026-10); British Columbia 6.3 (2026-10); Alberta 7.3 (2026-10); Saskatchewan 5.9 (2026-10); and 6 more in the data table.
Related relationships: Alberta · British Columbia · Saskatchewan · Manitoba
Employment by province, indexed
Seasonally adjusted; start of period = 100.
Chart loads when it comes into view.
Latest values: Nova Scotia 543,000 (2026-10); British Columbia 2,941,000 (2026-10); Alberta 2,660,000 (2026-10); Saskatchewan 624,600 (2026-10); and 6 more in the data table.
Related relationships: Alberta · British Columbia · Saskatchewan · Manitoba · 2 relationships use this data as evidence
Average hourly wage by province
Current dollars per hour, all industries, employees aged 15 and over, not seasonally adjusted.
Chart loads when it comes into view.
Latest values: Nova Scotia 34.02 (2026-10); British Columbia 39.54 (2026-10); Alberta 39 (2026-10); Saskatchewan 34.21 (2026-10); and 6 more in the data table.
Average weekly earnings by province
Current dollars per week, industrial aggregate incl. overtime, not seasonally adjusted.
Chart loads when it comes into view.
Latest values: Nova Scotia 1,223 (2026-08); British Columbia 1,366 (2026-08); Alberta 1,410 (2026-08); Saskatchewan 1,303 (2026-08); and 6 more in the data table.
Inflation
12-month change in the all-items CPI, derived by this project from the index.
Consumer price inflation by province
12-month change in the all-items CPI (derived by this project from the index).
Chart loads when it comes into view.
Latest values: Nova Scotia 5.63 (2026-09); British Columbia 2.96 (2026-09); Alberta 3.6 (2026-09); Saskatchewan 3.3 (2026-09); and 6 more in the data table.
Related relationships: Alberta · British Columbia · Saskatchewan · Manitoba
Population and migration
Quarterly population estimates and four-quarter migration flows.
Population by province, indexed
Quarterly estimates; start of period = 100.
Chart loads when it comes into view.
Latest values: Nova Scotia 1,103,000 (2026 Q3); British Columbia 5,711,000 (2026 Q3); Alberta 5,101,000 (2026 Q3); Saskatchewan 1,278,000 (2026 Q3); and 6 more in the data table.
Related relationships: Alberta · British Columbia · Saskatchewan · Manitoba
Immigrants by province (4-quarter total)
New permanent residents arriving over the previous four quarters.
Chart loads when it comes into view.
Latest values: Nova Scotia 9,564 (2026 Q2); British Columbia 45,800 (2026 Q2); Alberta 50,160 (2026 Q2); Saskatchewan 14,390 (2026 Q2); and 6 more in the data table.
Net interprovincial migration (4-quarter total)
In-migrants minus out-migrants over the previous four quarters (derived).
Chart loads when it comes into view.
Latest values: Nova Scotia 19,320 (2026 Q2); British Columbia 58,490 (2026 Q2); Alberta 78,320 (2026 Q2); Saskatchewan 18,270 (2026 Q2); and 6 more in the data table.
GDP, retail, manufacturing, construction, housing starts
Annual real GDP and monthly activity indicators, indexed so the start of the period equals 100 where noted.
Real GDP by province, indexed
Annual, 2017 constant prices (not chained); start of the period = 100. Expenditure-based.
Chart loads when it comes into view.
Latest values: Nova Scotia 53,070,000,000 (2025); British Columbia 356,100,000,000 (2025); Alberta 382,600,000,000 (2025); Saskatchewan 90,590,000,000 (2025); and 6 more in the data table.
Retail sales by province, indexed
Seasonally adjusted; start of period = 100.
Chart loads when it comes into view.
Latest values: Nova Scotia 2,005,000,000 (2026-08); British Columbia 9,970,000,000 (2026-08); Alberta 9,649,000,000 (2026-08); Saskatchewan 2,315,000,000 (2026-08); and 6 more in the data table.
Manufacturing sales by province, indexed
Seasonally adjusted shipments; start of period = 100.
Chart loads when it comes into view.
Latest values: Nova Scotia 1,056,000,000 (2026-08); British Columbia 6,093,000,000 (2026-08); Alberta 10,510,000,000 (2026-08); Saskatchewan 2,300,000,000 (2026-08); and 6 more in the data table.
Investment in new building construction by province, indexed
Current dollars, not seasonally adjusted, 12-month sum; start of the period = 100.
Chart loads when it comes into view.
Latest values: Nova Scotia 3,403,000,000 (2026-08); British Columbia 26,550,000,000 (2026-08); Alberta 21,980,000,000 (2026-08); Saskatchewan 3,138,000,000 (2026-08); and 6 more in the data table.
Housing starts by province (12-month average)
Seasonally adjusted annual rate, averaged over 12 months (smoothed); units per year. CMHC data distributed by Statistics Canada.
Chart loads when it comes into view.
Latest values: Nova Scotia 7,701 (2026-09); British Columbia 43,320 (2026-09); Alberta 49,530 (2026-09); Saskatchewan 6,443 (2026-09); and 6 more in the data table.
Related relationships: Alberta · British Columbia · Saskatchewan · Manitoba
Industry and export exposure
Latest shares only. A measured exposure, not an estimate of how much output or income depends on an industry.
| Industry | Share of provincial employment | Period |
|---|---|---|
| Health care and social assistance | 16.4% | 2025 |
| Construction | 8.3% | 2025 |
| Professional, scientific and technical services | 7.1% | 2025 |
| Manufacturing | 6.7% | 2025 |
| Finance, insurance, real estate, rental and leasing | 5.8% | 2025 |
| Transportation and warehousing | 4.6% | 2025 |
| Forestry, fishing, mining, quarrying, oil and gas | 2.1% | 2025 |
| Agriculture | 0.7% | 2025 |
Real output by industry in Nova Scotia, indexed
Real GDP at basic prices, chained 2017 dollars, annual (Statistics Canada table 36-10-0711-01); first year shown = 100. Goods and services against the total, with mining and oil and gas, manufacturing and the public sector. Chained-dollar levels are not additive, so only changes are compared.
Chart loads when it comes into view.
Latest values: All industries 48,020,000,000 (2025); Goods-producing industries 8,878,000,000 (2025); Services-producing industries 39,140,000,000 (2025); Mining, quarrying and oil and gas 165,200,000 (2025); and 2 more in the data table.
Labour productivity by province
Real value added per hour worked, all industries, chained 2017 dollars (Statistics Canada table 36-10-0713-01), annual. A level, not an index: it compares output per hour across provinces, and is high where capital-intensive industries such as oil and gas or mining weigh heavily in the economy.
Chart loads when it comes into view.
Latest values: Nova Scotia 52.3 (2025); Newfoundland and Labrador 72 (2025); Prince Edward Island 47.6 (2025); New Brunswick 51.9 (2025); and 6 more in the data table.
Labour productivity in Nova Scotia: goods and services
Real value added per hour worked, chained 2017 dollars, annual (Statistics Canada table 36-10-0713-01). Goods-producing industries include mining and oil and gas, so their level reflects capital-intensive resource extraction as well as manufacturing and construction.
Chart loads when it comes into view.
Latest values: All industries 52.3 (2025); Goods-producing industries 49 (2025); Services-producing industries 53.2 (2025).
Change in real output by industry in each province, 2015 to 2025
Percent change in real GDP at basic prices (chained 2017 dollars, annual) over ten years. Each industry is compared with itself; chained-dollar levels are not additive, so shares of the total are not shown. A measure of the change in output, not of income or employment.
Chart loads when it comes into view.
Top values: Prince Edward Island 38.2%; British Columbia 32.5%; Nova Scotia 26.3%.
How much of each province’s employment is in one industry
Share of provincial employment, 2025 annual average (Labour Force Survey). A measured exposure to an industry, not an estimate of how much output or income depends on it. “Resources” combines forestry, fishing, mining, quarrying and oil and gas.
Chart loads when it comes into view.
Top values: Newfoundland and Labrador 6.37%; Alberta 5.58%; Saskatchewan 3.76%.
Where each province’s goods exports go, and what they are, 2025
Share of each province’s domestic merchandise exports (customs basis). A measured exposure of export value to one market or one commodity group, not an estimate of how much income or employment depends on it.
Chart loads when it comes into view.
Top values: New Brunswick 90.4%; Alberta 85.43%; Prince Edward Island 80.05%.
Metropolitan areas in Nova Scotia
City pages use metropolitan data; this province page must not be read as any of them.
- Halifax (dashboard and analysis)
Recorded relationships
From the relationship graph, each with its evidence class.
The provincial or territorial government's accounts
Statistics Canada government finance statistics (public-accounts basis), fiscal years ended 31 March. Annual, and about two years behind: past position, not this year's budget.
| Measure | Latest | Fiscal year beginning in April | Year before |
|---|---|---|---|
| Revenue | C$17.6 billion | 2024 | C$16.2 billion |
| Grants received from other governments (part of revenue) | C$6.1 billion | 2024 | C$5.6 billion |
| Expense | C$17.1 billion | 2024 | C$16.0 billion |
| Net operating balance (revenue minus expense) | C$0.5 billion | 2024 | C$0.2 billion |
| Liabilities (end of fiscal year) | C$22.8 billion | 2024 | C$22.1 billion |
| Net worth (end of fiscal year; negative = liabilities exceed assets) | −C$0.8 billion | 2024 | −C$1.8 billion |
Computed: grants from other governments were 34.6% of revenue in the fiscal year that began in April 2024; the table does not say which government paid them, and most are federal transfers. Compare on the atlas →
Computed: the net operating balance was 3.0% of revenue in the fiscal year that began in April 2024. Compare on the atlas →
What this profile does not cover
Listed so that silence is not mistaken for absence of an issue.
- The current budget, credit ratings and fiscal plan (only past fiscal years are held)
- Housing prices and rents
- Employment by industry over time (only the latest provincial shares are held)
- Exports by destination over time (only the latest year is held)
- Major projects and investment
- Policy changes
- Written outlook or forecast