GlobalCanadaCities
Newfoundland and Labrador · province · data profile

Newfoundland and Labrador: provincial economy at a glance

Latest values, rankings and charts for Newfoundland and Labrador, all computed from Statistics Canada data held by this platform. The economic story below explains with attributed statements from official sources; the profile only computes. Forecasts quoted are their publishers' and Northline publishes none.

Analyze Newfoundland and Labrador in Intelligence Studio

Opens a workspace prepared from the published Newfoundland and Labrador measures, with what is missing stated.

The economy

What is driving Newfoundland and Labrador's growth, how much of it reaches jobs and incomes, and how fragile are its public finances?

Newfoundland and Labrador had the fastest real GDP growth of any province in 2025 on rising offshore oil output, but its employment barely changed, its capital investment fell and its budget depends on oil royalties

What happened

Newfoundland and Labrador's unemployment rate was 8.7% in October 2026, employment changed by 1.8% from a year earlier and the population by 0.4% from four quarters earlier. Real GDP changed 1.8% from 2019 to 2025, and 7.7% from 2020, when the pandemic depressed output.

Why it happened

Historical context

In its preliminary estimates of 1 May 2026, Statistics Canada reported that real GDP growth in 2025 was strongest in Newfoundland and Labrador, at 3.5 per cent, with oil and gas extraction output up 14.8 per cent and copper, nickel, lead and zinc ore mining up 62.0 per cent, while construction fell on engineering and non-residential building.

Evidence: Statistics Canada: The Daily: Gross domestic product by industry: Provinces and territories, 2025

Historical context

The provincial budget puts the province's own estimate of 2025 growth higher, at 4.8 per cent, a different vintage and measure. Statistics Canada's revised estimates, released on 5 November 2026, put 2025 growth at 4.3 per cent, still the fastest among the provinces, and real output at basic prices rose 4.4%.

Evidence: Government of Newfoundland and Labrador, Department of Finance: Budget 2026: The Economy; Statistics Canada: The Daily: Provincial and territorial economic accounts, 2025

Historical context

The budget says offshore oil production rose 14.6 per cent in 2025, reflecting higher Hebron output and the return of the SeaRose vessel after a refit, yet the value of production stayed about level at 8.4 billion dollars because of lower Brent prices.

Evidence: Government of Newfoundland and Labrador, Department of Finance: Budget 2026: The Economy

Historical context

The Canada Energy Regulator says all of Canada's offshore oil comes from five fields across four projects off the province, and that production has risen in recent years as investment and vessel refits extended the life of mature fields.

Evidence: Canada Energy Regulator: Market Snapshot: Canada-Newfoundland and Labrador Offshore Oil Production: Mature Fields and New Frontiers

Why it matters

Historical context

Employment averaged 244,800 in 2025, little changed from 2024, with the largest goods-sector losses in mining and oil and gas extraction and in construction, and capital investment fell 14.2 per cent to 7.5 billion dollars as major construction at the Voisey's Bay underground mines and the Valentine Gold Mine finished.

Evidence: Government of Newfoundland and Labrador, Department of Finance: Budget 2026: The Economy

Historical context

The province's September 2026 labour release reports employment up 2.3 per cent from a year earlier and an unemployment rate of 7.7 per cent, which differs from the seasonally adjusted 9.1% for the same month in the series used here.

Evidence: Government of Newfoundland and Labrador, Department of Finance (Economics Division), from Statistics Canada Labour Force Survey: Employment Up 2.3% in September 2026

History

Historical context

The budget says iron ore, the second-largest export, fell in value in 2025 on weak Chinese steel demand tied to its property downturn, that the Valentine gold mine poured its first gold in September 2025, and that fish landed value reached a historical peak with snow crab landed value up 62.3 per cent.

Evidence: Government of Newfoundland and Labrador, Department of Finance: Budget 2026: The Economy

Across geographies

Historical context

Crude oil was 52.8 per cent of the province's international exports in 2025, and average weekly earnings were 1,282.39 dollars against 1,302.86 dollars nationally. The average home price was the lowest of any province.

Evidence: Government of Newfoundland and Labrador, Department of Finance: Budget 2026: The Economy

Historical context

The province's finance department reports that population rose by 2,260 in the year to July 2026, the sixth consecutive annual increase, on near-record immigration partly offset by a decline in non-permanent residents, with natural population loss accelerating for ten years as the population ages.

Evidence: Government of Newfoundland and Labrador, Department of Finance (Economics Division), from Statistics Canada estimates: Population stood at 552,462 as of July 1, 2026

What it influences

Historical context

The budget says an agreement with Equinor and BP advances the Bay du Nord project, that capital investment should rise sharply to a 2029 peak as wind-energy projects and Bay du Nord begin construction, and that no bids were received in the November 2025 offshore call for bids.

Evidence: Government of Newfoundland and Labrador, Department of Finance: Budget 2026: The Economy

Historical context

The province's August 2026 release describes new Churchill Falls and Gull Island agreements as worth 49 billion dollars in present value, with binding agreements still to come.

Evidence: Government of Newfoundland and Labrador: News release: new deal to develop Churchill Falls and Gull Island (17 August 2026)

Risks

Historical context

The 2026-27 budget projects a deficit of 688.5 million dollars and net debt of 20.8 billion dollars, says oil royalties are about 19 per cent of revenue, and assumes an oil price of US$79 a barrel.

Evidence: Government of Newfoundland and Labrador, Department of Finance: Budget 2026 Delivers Opportunity For All of Us (news release and backgrounder)

Historical context

Its forecast assumes current US tariffs on Canadian exports stay in place.

Evidence: Government of Newfoundland and Labrador, Department of Finance: Budget 2026: The Economy

Historical context

The Canada Energy Regulator adds that most producing fields are mature and decline gradually, and that new development depends on costs, market conditions and competitiveness against Guyana, Brazil, the US Gulf of Mexico and Norway.

Evidence: Canada Energy Regulator: Market Snapshot: Canada-Newfoundland and Labrador Offshore Oil Production: Mature Fields and New Frontiers

What to watch

The province forecasts real GDP growth of 5.5 per cent in 2026, the highest of any province, driven by higher oil and mineral production, with employment up only 0.2 per cent and a population that stays steady. These are the province's forecasts, not Northline's. The province's monthly labour and population releases and the Canada Energy Regulator's production data (release calendar) show how much of the output gain reaches jobs.

Fiscal position, investment and comparisons

How does Newfoundland and Labrador pay for itself, what does its investment pipeline depend on, how exposed is its trade, and how does it differ from Nova Scotia, Saskatchewan and Alberta?

Newfoundland and Labrador's budget leans on offshore royalties worth about a fifth of revenue and a federal Equalization payment that has only just reappeared; its projects are large but mostly not yet built, and it sells a smaller share of its goods exports to the United States than Nova Scotia, Saskatchewan or Alberta

What happened

The Government of Newfoundland and Labrador closed 2025-26 with a deficit and projects another for 2026-27. In the Statistics Canada accounts for the fiscal year that began in April 2024, its net operating balance was -C$312 million, -3.3% of revenue.

Historical context

The Budget Speech in April said the province "ended up with revenues of $10.7 billion and expenses of $11.4 billion", a deficit of $729 million, down from a projected deficit of $948 million. The audited Public Accounts, released on 16 October 2026, put the 2025-26 deficit at $377.6 million.

Evidence: Government of Newfoundland and Labrador: Budget 2026: Budget Speech; Government of Newfoundland and Labrador, Department of Finance: News release: Minister Pardy Tables 2025-26 Public Accounts (16 October 2026)

Historical context

For 2026-27 the Statements and Schedules forecast a net debt of $20.8 billion ($19.5 billion at 31 March 2026), a different measure from the public sector debt the same document lists at 35,196,166 (in thousands of dollars, as read here), which includes Crown corporation, guaranteed and municipal debt but excludes unfunded pensions and post-retirement benefits.

Evidence: Government of Newfoundland and Labrador, Department of Finance: Budget 2026: Statements and Schedules

Historical context

Debt expenses are 10% of 2026-27 expense, the schedule's line for interest and related costs.

Evidence: Government of Newfoundland and Labrador, Department of Finance: Budget 2026: Statements and Schedules

Why it happened

Historical context

The Schedule of revenue by source lists offshore royalties at 19% of 2026-27 revenue, or 2,030,413 against 1,687,611 the year before (thousands of dollars, as read here). The Health Transfer is 755,146 and Equalization 181,888, up from 113,405.

Evidence: Government of Newfoundland and Labrador, Department of Finance: Budget 2026: Statements and Schedules

Historical context

Finance Canada says the province will receive $1.2 billion through the major transfers in 2026-27. Its table shows Equalization at nothing in each year to 2023-24, then 218, 113 and 182 million dollars in 2024-25, 2025-26 and 2026-27.

Evidence: Department of Finance Canada: Federal transfers to provinces and territories: major federal transfers, 2017-18 to 2026-27

Historical context

Finance Canada explains that fiscal capacity "is not based on its actual tax revenues, but on those it could raise with national average tax rates", and that for natural resources it is "assessed based on partial inclusion of actual revenue collected by the province". Its chart, in dollars per capita, lists a natural resource fiscal capacity of 2,964 for Newfoundland and Labrador, against 2,533 for Saskatchewan and 4,778 for Alberta, and non-resource fiscal capacity of 8,833.

Evidence: Department of Finance Canada: Equalization Program (2026-27); Finance Canada: Chart 1: Equalization 2026-27 (chart on the Equalization program page)

Opinion

Read together, the sources are consistent with this reading: offshore oil lifts the province's resource fiscal capacity while its non-resource capacity stays low, so it sits at the margin of Equalization and its payment rises or falls with how the formula treats resource revenue. No source states that explanation for Newfoundland and Labrador; it is the research desk's reading.

Why it matters

Historical context

Net acquisitions of tangible capital assets are printed at (1,037,376) for 2026-27 against (776,450) the year before, thousands of dollars as read here. The Budget Highlights put the infrastructure total at "$1.1 billion in responsible infrastructure investments" across health care facilities, schools, housing, roads and municipal infrastructure.

Evidence: Government of Newfoundland and Labrador, Department of Finance: Budget 2026: Statements and Schedules; Government of Newfoundland and Labrador: Budget 2026: Highlights

Historical context

Beyond the provincial capital plan, the Speech names the offshore: the government is investing $90 million to support offshore exploration, and says the Bay du Nord agreement leveraged $200 million of private money toward a floating dry-dock. It also welcomes a federal $8 billion investment at 5 Wing Goose Bay and says it is waiting for details.

Evidence: Government of Newfoundland and Labrador: Budget 2026: Budget Speech

Historical context

The Canada Energy Regulator says Equinor submitted its Development Plan Application for Bay du Nord on May 5, 2026, with a 2027 final investment decision and potential first oil by 2031, and that advancement depends on costs, market conditions and competitiveness against Guyana, Brazil, the US Gulf of Mexico and Norway.

Evidence: Canada Energy Regulator: Market Snapshot: Canada-Newfoundland and Labrador Offshore Oil Production: Mature Fields and New Frontiers

Historical context

The province's own forecast has capital investment falling by 2.6% to $7.3 billion in 2026 because construction at West White Rose and the Valentine Gold Mine finished, then rising sharply to a 2029 peak as larger projects are built. The projects therefore depend on a final investment decision, a regulator's approval and oil prices, not on provincial spending alone.

Evidence: Government of Newfoundland and Labrador, Department of Finance (Economics Division): Selected Economic Indicators Table and Major Forecast Assumptions, April 2026

Historical context

The August 2026 release adds that the Gull Island, Churchill Falls upgrade and Labrador transmission projects would be referred to the federal Major Projects Office once binding agreements are concluded, so on the province's own account they are not yet there.

Evidence: Government of Newfoundland and Labrador: News release: new deal to develop Churchill Falls and Gull Island (17 August 2026)

History

Real output at basic prices in Newfoundland and Labrador (chained 2017 dollars, Statistics Canada table 36-10-0711-01) was C$30.9 billion in 2025, a change of 2.5% over ten years. Over the same ten years goods-producing industries changed -7.1% and services-producing industries 12.6%; mining, quarrying and oil and gas changed 31.1%, manufacturing -31.8% and the public sector 15.8%. These are changes in real output, not in income or jobs, and the table gives no reason for the differences; the sourced paragraphs in this section and in the story give the explanations that named sources offer.

Real output by industry in Newfoundland and Labrador, indexed

Real GDP at basic prices, chained 2017 dollars, annual (Statistics Canada table 36-10-0711-01); first year shown = 100. Goods and services against the total, with mining and oil and gas, manufacturing and the public sector. Chained-dollar levels are not additive, so only changes are compared.

Chart loads when it comes into view.

Latest values: All industries 30,950,000,000 (2025); Goods-producing industries 12,030,000,000 (2025); Services-producing industries 19,400,000,000 (2025); Mining, quarrying and oil and gas 7,638,000,000 (2025); and 2 more in the data table.

Labour productivity, meaning real value added per hour worked in chained 2017 dollars (Statistics Canada table 36-10-0713-01), was C$72.00 an hour in Newfoundland and Labrador in 2025, ranking 3rd of 10 (highest = 1), a change of 2.1% over ten years. In goods-producing industries it was C$130.10 an hour (a change of 25.8% over ten years) and in services-producing industries C$57.10 an hour (a change of 0.5%). A high level can reflect capital-intensive industries such as oil, gas and mining rather than the efficiency of the whole economy, and the table says nothing about why levels or changes differ.

Labour productivity in Newfoundland and Labrador: goods and services

Real value added per hour worked, chained 2017 dollars, annual (Statistics Canada table 36-10-0713-01). Goods-producing industries include mining and oil and gas, so their level reflects capital-intensive resource extraction as well as manufacturing and construction.

Chart loads when it comes into view.

Latest values: All industries 72 (2025); Goods-producing industries 130.1 (2025); Services-producing industries 57.1 (2025).

Historical context

Finance Canada describes the 1985 Atlantic Accord as allowing the province to "tax these resources as if it were the owner", with transitional protection from Equalization reductions that would otherwise follow as offshore revenue grew, and the 2005 Arrangement as providing "100 per cent protection" for a time-limited period. This is why the interaction between oil revenue and Equalization is a long-standing federal-provincial question, not a new one.

Evidence: Department of Finance Canada: Newfoundland and Labrador Offshore Arrangements

Historical context

The Budget Speech, tabled before the August Churchill release, says "not a dime of assumed revenue from a Churchill Falls deal will be included on our books until a deal is signed", and that without it "the numbers in our out years, in their current form, are bracing and the deficit will grow". The Overview's own projections show the deficit at (1,095) million dollars in 2027-28.

Evidence: Government of Newfoundland and Labrador: Budget 2026: Budget Speech; Government of Newfoundland and Labrador, Department of Finance: Budget 2026: Overview (presentation)

Across geographies

The three peers differ by how they earn resource money and how federal transfers treat them.

Unemployment in Newfoundland and Labrador was 8.7% in October 2026 (1st of 10 among provinces, highest first), against 6.2% in Nova Scotia, 5.9% in Saskatchewan and 7.3% in Alberta. Average weekly earnings were C$1,314 a week (4th of 10), against C$1,223 a week, C$1,303 a week and C$1,410 a week. The population changed 0.4% over four quarters in Newfoundland and Labrador, 0.8% in Nova Scotia, 1.0% in Saskatchewan and 1.5% in Alberta.

In the Statistics Canada accounts for the fiscal year that began in April 2024, net operating balance was -3.3% of revenue in Newfoundland and Labrador, 3.0% in Nova Scotia, -9.3% in Saskatchewan and 8.5% in Alberta. Grants from other governments were 25.5% of Newfoundland and Labrador's revenue, against 34.6% in Nova Scotia, 17.2% in Saskatchewan and 14.3% in Alberta.

Historical context

Finance Canada's per capita federal support for 2026-27 is 2,121 dollars for Newfoundland and Labrador, against 4,998 for Nova Scotia, which receives Equalization of 3,538 million dollars, and 1,792 for each of Alberta and Saskatchewan, which receive no Equalization.

Evidence: Department of Finance Canada: Federal transfers to provinces and territories: major federal transfers, 2017-18 to 2026-27

Historical context

Alberta's first-quarter fiscal update forecasts non-renewable resource revenue of 22,955 million dollars in 2026-27, more than a quarter of its total revenue of 86,279 million, against about a fifth for Newfoundland and Labrador's offshore royalties alone.

Evidence: Government of Alberta (Treasury Board and Finance): 2026-27 First Quarter Fiscal Update and Economic Statement

Historical context

Saskatchewan's government says Moody's, Morningstar DBRS and S&P Global affirmed its ratings at Aa1 (Moody's), AA (low) (Morningstar DBRS) and AA (S&P Global), all with a stable outlook. No corresponding ratings for Newfoundland and Labrador are given here (see limitations).

Evidence: Government of Saskatchewan (Finance): Strong and Steady: Saskatchewan Maintains Top Provincial Credit Rating

Opinion

The pattern across the four is that Alberta and Saskatchewan receive no Equalization, Nova Scotia receives a large payment, and Newfoundland and Labrador sits between: a large resource royalty and a small payment that resumed in 2024-25. That is the desk's summary of the sourced figures, not a finding by any named source.

What it influences

Historical context

The province's labour release reports employment of 251,400 persons in September 2026, up 5,600 from a year earlier, with goods-sector employment up 8.1%.

Evidence: Government of Newfoundland and Labrador, Department of Finance (Economics Division), from Statistics Canada Labour Force Survey: Employment Up 2.3% in September 2026

Historical context

The City of St. John's says real GDP in the metropolitan area rose 4.4 per cent in 2025 mainly on higher oil production, and 1.0 per cent excluding oil and gas, with growth outside oil expected at only 0.3 per cent in 2026.

Evidence: City of St. John's: Economic Outlook 2026 (St. John's CMA), June 2026

Historical context

The Budget says the average home price was $344,826 in 2025, the lowest of all provinces, up 7.9 per cent, while the average two-bedroom rent rose to $1,208 and "limited supply and population growth have tightened vacancy rates in the residential rental market in recent years", though it also records the provincial apartment vacancy rate rising between October 2024 and October 2025.

Evidence: Government of Newfoundland and Labrador, Department of Finance: Budget 2026: The Economy

Historical context

The Department of Finance reports a near-record 5,311 immigrants in the year to July 2026, offset by falling non-permanent residents, and natural population loss that has been accelerating for ten years as the population ages.

Evidence: Government of Newfoundland and Labrador, Department of Finance (Economics Division), from Statistics Canada estimates: Population stood at 552,462 as of July 1, 2026

Historical context

Average weekly earnings were $1,282.39 in 2025 against a national $1,302.86.

Evidence: Government of Newfoundland and Labrador, Department of Finance: Budget 2026: The Economy

Risks

Domestic merchandise exports to the United States were 35% of the province's total in 2025, against 69% for Nova Scotia, 54% for Saskatchewan and 85% for Alberta. Energy was 54% of the province's exports, and energy sold to the United States 18%.

Historical context

The Budget's economic forecast assumes "current U.S. tariffs on Canadian exports will remain in place throughout the projection period", and it records crude oil at 52.8 per cent of international exports and iron ore at 17.5 per cent.

Evidence: Government of Newfoundland and Labrador, Department of Finance: Budget 2026: The Economy

Opinion

The data show a lower United States share than the three peers, but no source cited here says where Newfoundland and Labrador's crude and iron ore are sold or what tariffs apply to them, so the exposure to the United States tariffs is not assessed; the sources offer only that the forecast assumes current tariffs stay.

Historical context

The Budget attributes the 2025 fall in iron ore value to prices lowered by "weak Chinese steel demand stemming from the country's ongoing property sector downturn", and the unchanged value of crude exports, despite higher production, to "lower Brent crude oil prices".

Evidence: Government of Newfoundland and Labrador, Department of Finance: Budget 2026: The Economy

What to watch

The province's monthly labour releases, the Canada Energy Regulator's Bay du Nord and White Rose updates, Finance Canada's next Equalization determination, and any binding Churchill Falls and Gull Island agreement, which the province says would be referred to the Major Projects Office. These are the publishers' forecasts and plans, not Northline's.

Written profile

What do the data show about the Newfoundland and Labrador economy?

Newfoundland and Labrador's unemployment rate was 8.7% in October 2026, its prices were up 4.7% in the year to September 2026 and its government's net operating balance, on Statistics Canada's basis, was -3.3% of revenue in the fiscal year that began in April 2024

Newfoundland and Labrador against the other nine

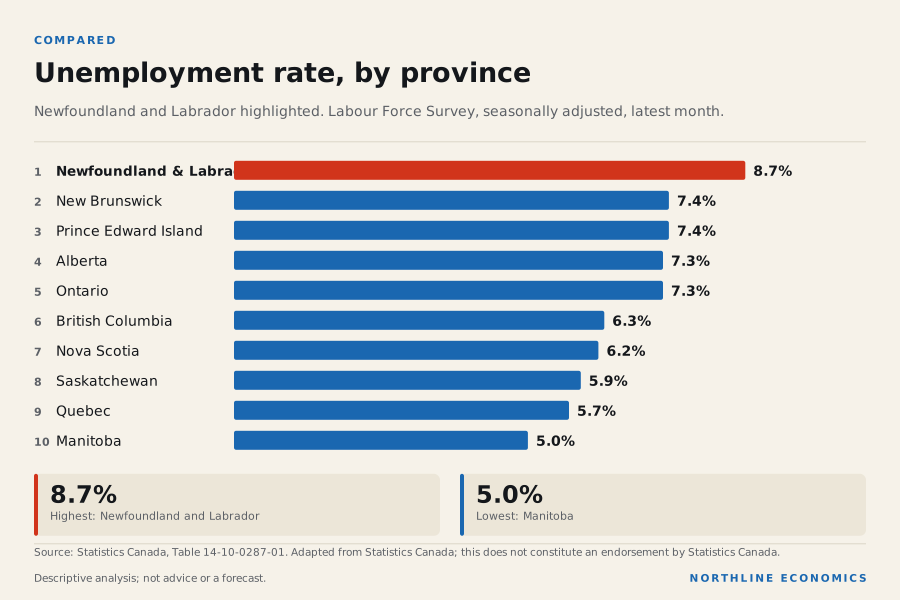
Newfoundland and Labrador has the highest unemployment rate and the lowest participation rate of the ten provinces, and it is the only province whose real output by industry is below its 2019 level. The unemployment rate is 8.7% against 10.2% a year earlier, the participation rate is 57.4%, and real GDP at market prices grew 1.8% from 2019 to 2025 (7.7% from 2020, when the pandemic depressed output), the slowest of the ten. Output across all industries, measured at basic prices, is -1.3% against 2019, the weakest of the ten; the two measures differ, and only the second is below its 2019 level.

Unemployment rate, by province. Newfoundland and Labrador 8.7%; New Brunswick 7.4%; Prince Edward Island 7.4%; Alberta 7.3%; Ontario 7.3%; British Columbia 6.3%; Nova Scotia 6.2%; Saskatchewan 5.9%.
The data behind this graphic
Unemployment rate, by province
ItemValue
Newfoundland and Labrador8.7%
New Brunswick7.4%
Prince Edward Island7.4%
Alberta7.3%
Ontario7.3%
British Columbia6.3%
Nova Scotia6.2%
Saskatchewan5.9%
Quebec5.7%
Manitoba5.0%

Download this graphic (SVG, with source)

The recent labour and spending figures are better than the output record. Employment changed by 1.8% from a year earlier, fourth of ten, and retail sales in August 2026 were up 8.1%, also fourth. Net movement to and from other provinces over the latest four quarters was 932 persons, a net inflow, and non-permanent residents changed by -560; the population grew 0.4% in the year to 1 July 2026. Average weekly earnings rose 2.6% in the twelve months to August 2026, eighth of ten, against price growth of 4.7% in the twelve months to September 2026, so average earnings lost purchasing power even as retail sales grew.

An energy exporter that sells less to the United States than any other province

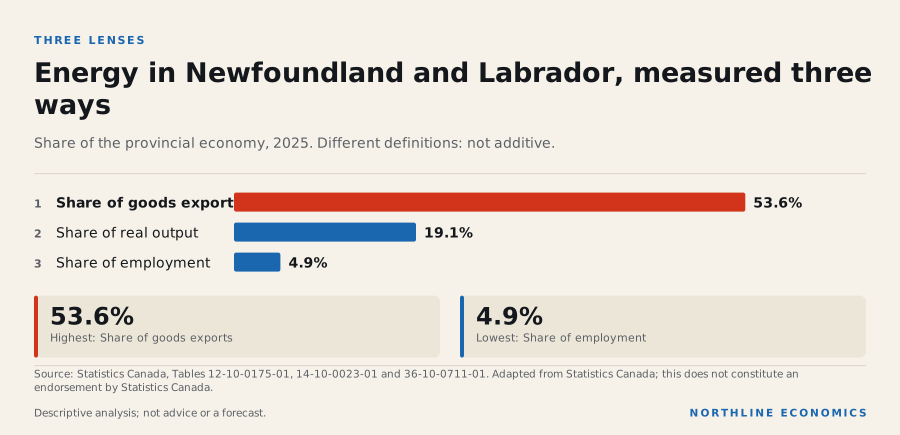
In 2025 energy products were 53.6% of the province's C$13.7 billion of domestic goods exports, the second-highest share after Alberta, yet only 34.8% of goods exports went to the United States, the lowest share of any province. The energy sector produced 19.1% of real output and mining and oil and gas extraction employed 4.9% of workers, the second-highest share after Alberta. On a rough scale real output per worker in that industry is about 5.1 times the all-industry average, the largest ratio of any province, which means a small group of workers produces much of the province's measured output. The ratio divides two different surveys and is not a productivity measure.

Energy in Newfoundland and Labrador, measured three ways. Share of goods exports 53.6%; Share of real output 19.1%; Share of employment 4.9%.
The data behind this graphic
Energy in Newfoundland and Labrador, measured three ways
ItemValue
Share of goods exports53.6%
Share of real output19.1%
Share of employment4.9%

Download this graphic (SVG, with source)

Where output fell and where it grew

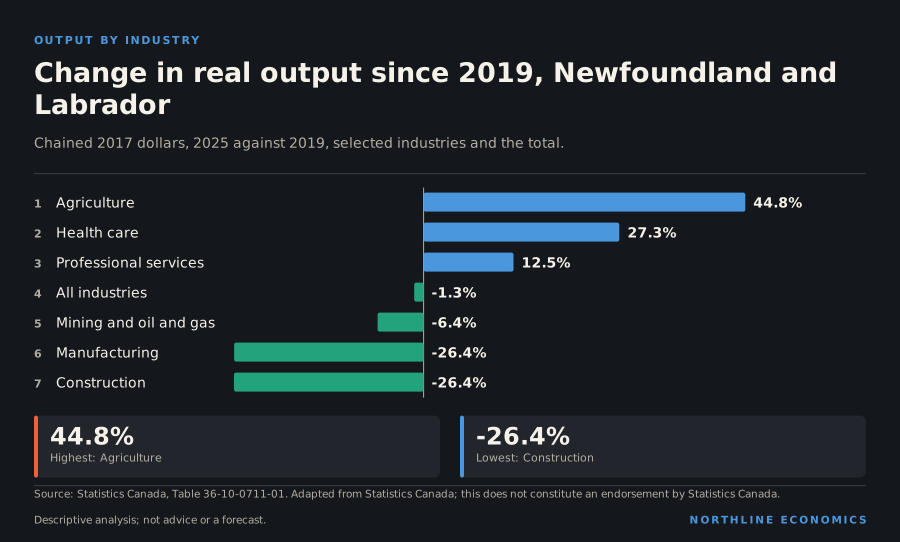
The decline since 2019 is concentrated in a few industries. Manufacturing changed by -26.4% and construction by -26.4%, the weakest figures among the ten provinces for each. Mining and oil and gas extraction changed by -6.4%. Health care grew 27.3%, professional services 12.5% and agriculture 44.8%; agriculture employs only 0.4% of workers, so its rapid growth is a large percentage on a small base and cannot offset the losses elsewhere.

Change in real output since 2019, Newfoundland and Labrador. Agriculture 44.8%; Health care 27.3%; Professional services 12.5%; All industries -1.3%; Mining and oil and gas -6.4%; Manufacturing -26.4%; Construction -26.4%.
The data behind this graphic
Change in real output since 2019, Newfoundland and Labrador
ItemValue
Agriculture44.8%
Health care27.3%
Professional services12.5%
All industries-1.3%
Mining and oil and gas-6.4%
Manufacturing-26.4%
Construction-26.4%

Download this graphic (SVG, with source)

In 2025 health care and social assistance employed 19.3% of workers, the highest share of any province, and retail trade 13.5%, also the highest.

The public accounts

On Statistics Canada's basis, in the fiscal year that began in April 2024 the government's net operating balance was -C$312 million on revenues of C$9.4 billion, a balance equal to -3.3% of revenue (negative is a deficit). Liabilities were 2.95 times revenue, the second-highest multiple of the ten provinces after Manitoba. Housing starts over the latest twelve months were 3.3 per thousand residents, the lowest rate of the ten provinces.

What it means for decisions

Opinion

For a business, Newfoundland and Labrador is a small market whose output record is weak and whose recent spending and employment figures are firmer than that record suggests. The job base is weighted toward health care, retail and the public sector. For an investor, the large share of a small economy produced by energy extraction makes the province sensitive to a few projects and to energy prices. For a household, the unemployment and participation rates are the clearest signs of how hard it is to find work.

What the data cannot say: provincial totals hide differences between the St. John's area, Labrador and rural communities; the series do not show project-level investment or oil production volumes; and the labour survey is a sample. Nothing here is a forecast.

Labour market and prices

The unemployment rate was 8.7% in October 2026, ranking 1st of 10 among the ten provinces (1st = highest). Employment changed by 1.8% over the year and the participation rate was 57.4%. Average weekly earnings were C$1,314 a week in August 2026, ranking 4th of 10. Consumer prices were up 4.7% in September 2026 on a year earlier, ranking 4th of 10.

Unemployment rate by province

Percent, seasonally adjusted, monthly. Province series, Labour Force Survey.

Chart loads when it comes into view.

Latest values: Newfoundland and Labrador 8.7 (2026-10); British Columbia 6.3 (2026-10); Alberta 7.3 (2026-10); Saskatchewan 5.9 (2026-10); and 6 more in the data table.

People and output

The population was 0.4% higher than four quarters earlier. Net interprovincial migration over the latest four quarters was 932 persons (negative = net outflow), and non-permanent residents changed by -560. Real GDP changed 7.7% from 2020, when the pandemic depressed output, to 2025, and 1.8% from 2019. Retail sales in August 2026 were 8.1% higher than a year earlier.

Population by province, indexed

Quarterly estimates; start of period = 100.

Chart loads when it comes into view.

Latest values: Newfoundland and Labrador 552,500 (2026 Q3); British Columbia 5,711,000 (2026 Q3); Alberta 5,101,000 (2026 Q3); Saskatchewan 1,278,000 (2026 Q3); and 6 more in the data table.

Real GDP by province, indexed

Annual, 2017 constant prices (not chained); start of the period = 100. Expenditure-based.

Chart loads when it comes into view.

Latest values: Newfoundland and Labrador 34,590,000,000 (2025); British Columbia 356,100,000,000 (2025); Alberta 382,600,000,000 (2025); Saskatchewan 90,590,000,000 (2025); and 6 more in the data table.

Economic structure and trade exposure

In 2025 (the year of the table's latest annual average), health care and social assistance employed 19.3% of Newfoundland and Labrador's workers, retail trade 13.5%, construction 7.4% and public administration 8.9%. Among goods-producing groups, agriculture 0.4%; forestry, fishing, mining, quarrying, oil and gas 6.4%; and manufacturing 3.9%. Finance and insurance employed 2.2% and professional, scientific and technical services 4.8%.

How much of each province’s employment is in one industry

Share of provincial employment, 2025 annual average (Labour Force Survey). A measured exposure to an industry, not an estimate of how much output or income depends on it. “Resources” combines forestry, fishing, mining, quarrying and oil and gas.

Chart loads when it comes into view.

Top values: Newfoundland and Labrador 6.37%; Alberta 5.58%; Saskatchewan 3.76%.

Domestic merchandise exports were C$13.7 billion in calendar year 2025. 35% went to the United States and energy products were 54% of the total; energy products sent to the United States were 18% of all the province's domestic exports. These are customs-basis goods exports assigned to the province of origin as Statistics Canada defines it; they exclude services, which are a large part of some provincial economies, and the province of export clearance can differ from the province of production for some commodities.

Where each province’s goods exports go, and what they are, 2025

Share of each province’s domestic merchandise exports (customs basis). A measured exposure of export value to one market or one commodity group, not an estimate of how much income or employment depends on it.

Chart loads when it comes into view.

Top values: New Brunswick 90.4%; Alberta 85.43%; Prince Edward Island 80.05%.

Employment shares and export shares describe the structure of the economy; they do not by themselves show which industries drive growth, incomes or public revenue, or how exposed the province is to a given shock.

Long-run perspective

Population is 3.7% lower on 1 July 2026 than on 1 January 1981, against a rise of 69.5% for Canada as a whole. Real GDP (at 2017 constant prices) is 120.3% higher in 2025 than in 1981; this is a level comparison between two years, not an average annual rate, and it is not compared with a national figure here because the national real GDP series is monthly and on a different basis.

Employment is 26.2% higher in October 2026 than in June 1993, the start of the national series used here (65.1% for Canada). Over the past forty years the unemployment rate has ranged from 8.2% (June 2026) to 22.1% (November 1992); it was 8.7% in October 2026, against 6.7% for Canada.

Employment by province, indexed

Seasonally adjusted; start of period = 100.

Chart loads when it comes into view.

Latest values: Newfoundland and Labrador 249,700 (2026-10); British Columbia 2,941,000 (2026-10); Alberta 2,660,000 (2026-10); Saskatchewan 624,600 (2026-10); and 6 more in the data table.

Average weekly earnings, in current dollars and not seasonally adjusted, are 121.5% higher in August 2026 than in the same month twenty-five years earlier (106.8% for Canada). These are nominal figures: they include the effect of price increases over twenty-five years and are not a measure of the change in purchasing power.

These comparisons describe the size of changes between two dates. They do not say why this jurisdiction differs from Canada, and the end points can matter: a different starting year changes the percentage.

Public finances

For the fiscal year that began in April 2024, on Statistics Canada's basis, the provincial government's revenue was C$9.4 billion and its expense C$9.7 billion, leaving a net operating balance of -C$312 million (-3.3% of revenue). Grants received from other governments (mostly federal transfers; the table does not split them by payer) were C$2.4 billion, 25.5% of revenue. Liabilities at the end of the year were C$27.7 billion and net worth C$9.1 billion. These are past-year accounts, not the current budget.

What is not assessed

Why these figures differ from other provinces, industry structure beyond the latest employment shares, housing prices and rents, exports by destination over time, the current budget and credit ratings, major projects, and policy changes. This profile cites no source that explains Newfoundland and Labrador's position, and nothing here is a forecast.

1 · Where it ranks

Newfoundland and Labrador among the ten provinces

Same values as the Canada atlas layers. Rank 1 is the highest value, which is not always the most favourable outcome. A measure the source does not publish for a place is simply absent.

MeasureLatestPeriodRank (1 = highest)
Unemployment rate
%, seasonally adjusted, monthly
8.7%2026-101 of 10
Participation rate
%, seasonally adjusted
57.4%2026-1010 of 10
Inflation (CPI)
% change, 12 months
4.7%2026-094 of 10
Population growth
% change over 4 quarters
0.4%2026 Q39 of 13
Average weekly earnings
C$ per week
$1,3142026-087 of 13
Job vacancy rate
%, unadjusted
2.3%2026-0813 of 13
Housing starts (12-month average, annual rate)
units, annual rate
1,8002026-099 of 10
Retail sales growth
% change, latest 12 months vs the 12 before
2.7%2026-0810 of 13
Manufacturing shipments growth
% change, latest 12 months vs the 12 before
24.4%2026-081 of 10
Building construction investment growth
% change, latest 12 months vs the 12 before
7.8%2026-086 of 13 (tied)
Real GDP growth (annual)
% change, annual, chained 2017 dollars
4.8%20251 of 13
Average hourly wage rate
C$ per hour
$33.912026-107 of 10
Immigrants per 1,000 residents
persons per 1,000 residents, latest 4 quarters
9.62026 Q28 of 13 (tied)
Non-permanent residents, net change per 1,000
persons per 1,000 residents, latest 4 quarters
-1.02026 Q26 of 13
Net interprovincial migration per 1,000
persons per 1,000 residents, latest 4 quarters
1.72026 Q25 of 13
Provincial government net operating balance
% of revenue, fiscal year beginning in April
-3.3%20247 of 13
Grants received from other governments
% of revenue, fiscal year beginning in April
25.5%20248 of 13

See Newfoundland and Labrador on the atlas → · Compare provinces →

2 · Labour market

Jobs, unemployment and wages

Newfoundland and Labrador is emphasised; the other provinces are shown for context. Click legend items to hide lines.

Unemployment rate by province

Percent, seasonally adjusted, monthly. Province series, Labour Force Survey.

Chart loads when it comes into view.

Latest values: Newfoundland and Labrador 8.7 (2026-10); British Columbia 6.3 (2026-10); Alberta 7.3 (2026-10); Saskatchewan 5.9 (2026-10); and 6 more in the data table.

Employment by province, indexed

Seasonally adjusted; start of period = 100.

Chart loads when it comes into view.

Latest values: Newfoundland and Labrador 249,700 (2026-10); British Columbia 2,941,000 (2026-10); Alberta 2,660,000 (2026-10); Saskatchewan 624,600 (2026-10); and 6 more in the data table.

Average hourly wage by province

Current dollars per hour, all industries, employees aged 15 and over, not seasonally adjusted.

Chart loads when it comes into view.

Latest values: Newfoundland and Labrador 33.91 (2026-10); British Columbia 39.54 (2026-10); Alberta 39 (2026-10); Saskatchewan 34.21 (2026-10); and 6 more in the data table.

Average weekly earnings by province

Current dollars per week, industrial aggregate incl. overtime, not seasonally adjusted.

Chart loads when it comes into view.

Latest values: Newfoundland and Labrador 1,314 (2026-08); British Columbia 1,366 (2026-08); Alberta 1,410 (2026-08); Saskatchewan 1,303 (2026-08); and 6 more in the data table.

3 · Prices

Inflation

12-month change in the all-items CPI, derived by this project from the index.

Consumer price inflation by province

12-month change in the all-items CPI (derived by this project from the index).

Chart loads when it comes into view.

Latest values: Newfoundland and Labrador 4.72 (2026-09); British Columbia 2.96 (2026-09); Alberta 3.6 (2026-09); Saskatchewan 3.3 (2026-09); and 6 more in the data table.

4 · People

Population and migration

Quarterly population estimates and four-quarter migration flows.

Population by province, indexed

Quarterly estimates; start of period = 100.

Chart loads when it comes into view.

Latest values: Newfoundland and Labrador 552,500 (2026 Q3); British Columbia 5,711,000 (2026 Q3); Alberta 5,101,000 (2026 Q3); Saskatchewan 1,278,000 (2026 Q3); and 6 more in the data table.

Immigrants by province (4-quarter total)

New permanent residents arriving over the previous four quarters.

Chart loads when it comes into view.

Latest values: Newfoundland and Labrador 5,311 (2026 Q2); British Columbia 45,800 (2026 Q2); Alberta 50,160 (2026 Q2); Saskatchewan 14,390 (2026 Q2); and 6 more in the data table.

Net interprovincial migration (4-quarter total)

In-migrants minus out-migrants over the previous four quarters (derived).

Chart loads when it comes into view.

Latest values: Newfoundland and Labrador 7,224 (2026 Q2); British Columbia 58,490 (2026 Q2); Alberta 78,320 (2026 Q2); Saskatchewan 18,270 (2026 Q2); and 6 more in the data table.

5 · Output and activity

GDP, retail, manufacturing, construction, housing starts

Annual real GDP and monthly activity indicators, indexed so the start of the period equals 100 where noted.

Real GDP by province, indexed

Annual, 2017 constant prices (not chained); start of the period = 100. Expenditure-based.

Chart loads when it comes into view.

Latest values: Newfoundland and Labrador 34,590,000,000 (2025); British Columbia 356,100,000,000 (2025); Alberta 382,600,000,000 (2025); Saskatchewan 90,590,000,000 (2025); and 6 more in the data table.

Retail sales by province, indexed

Seasonally adjusted; start of period = 100.

Chart loads when it comes into view.

Latest values: Newfoundland and Labrador 1,107,000,000 (2026-08); British Columbia 9,970,000,000 (2026-08); Alberta 9,649,000,000 (2026-08); Saskatchewan 2,315,000,000 (2026-08); and 6 more in the data table.

Manufacturing sales by province, indexed

Seasonally adjusted shipments; start of period = 100.

Chart loads when it comes into view.

Latest values: Newfoundland and Labrador 692,100,000 (2026-08); British Columbia 6,093,000,000 (2026-08); Alberta 10,510,000,000 (2026-08); Saskatchewan 2,300,000,000 (2026-08); and 6 more in the data table.

Investment in new building construction by province, indexed

Current dollars, not seasonally adjusted, 12-month sum; start of the period = 100.

Chart loads when it comes into view.

Latest values: Newfoundland and Labrador 702,900,000 (2026-08); British Columbia 26,550,000,000 (2026-08); Alberta 21,980,000,000 (2026-08); Saskatchewan 3,138,000,000 (2026-08); and 6 more in the data table.

Housing starts by province (12-month average)

Seasonally adjusted annual rate, averaged over 12 months (smoothed); units per year. CMHC data distributed by Statistics Canada.

Chart loads when it comes into view.

Latest values: Newfoundland and Labrador 1,800 (2026-09); British Columbia 43,320 (2026-09); Alberta 49,530 (2026-09); Saskatchewan 6,443 (2026-09); and 6 more in the data table.

6 · Economic structure

Industry and export exposure

Latest shares only. A measured exposure, not an estimate of how much output or income depends on an industry.

IndustryShare of provincial employmentPeriod
World oil price (WTI)53.6%2025
Health care and social assistance19.3%2025
Construction7.4%2025
Forestry, fishing, mining, quarrying, oil and gas6.4%2025
Transportation and warehousing5.2%2025
Professional, scientific and technical services4.8%2025
Manufacturing3.9%2025
Finance, insurance, real estate, rental and leasing3.4%2025
Agriculture0.4%2025

Real output by industry in Newfoundland and Labrador, indexed

Real GDP at basic prices, chained 2017 dollars, annual (Statistics Canada table 36-10-0711-01); first year shown = 100. Goods and services against the total, with mining and oil and gas, manufacturing and the public sector. Chained-dollar levels are not additive, so only changes are compared.

Chart loads when it comes into view.

Latest values: All industries 30,950,000,000 (2025); Goods-producing industries 12,030,000,000 (2025); Services-producing industries 19,400,000,000 (2025); Mining, quarrying and oil and gas 7,638,000,000 (2025); and 2 more in the data table.

Labour productivity by province

Real value added per hour worked, all industries, chained 2017 dollars (Statistics Canada table 36-10-0713-01), annual. A level, not an index: it compares output per hour across provinces, and is high where capital-intensive industries such as oil and gas or mining weigh heavily in the economy.

Chart loads when it comes into view.

Latest values: Newfoundland and Labrador 72 (2025); Prince Edward Island 47.6 (2025); Nova Scotia 52.3 (2025); New Brunswick 51.9 (2025); and 6 more in the data table.

Labour productivity in Newfoundland and Labrador: goods and services

Real value added per hour worked, chained 2017 dollars, annual (Statistics Canada table 36-10-0713-01). Goods-producing industries include mining and oil and gas, so their level reflects capital-intensive resource extraction as well as manufacturing and construction.

Chart loads when it comes into view.

Latest values: All industries 72 (2025); Goods-producing industries 130.1 (2025); Services-producing industries 57.1 (2025).

Change in real output by industry in each province, 2015 to 2025

Percent change in real GDP at basic prices (chained 2017 dollars, annual) over ten years. Each industry is compared with itself; chained-dollar levels are not additive, so shares of the total are not shown. A measure of the change in output, not of income or employment.

Chart loads when it comes into view.

Top values: Prince Edward Island 38.2%; British Columbia 32.5%; Nova Scotia 26.3%.

How much of each province’s employment is in one industry

Share of provincial employment, 2025 annual average (Labour Force Survey). A measured exposure to an industry, not an estimate of how much output or income depends on it. “Resources” combines forestry, fishing, mining, quarrying and oil and gas.

Chart loads when it comes into view.

Top values: Newfoundland and Labrador 6.37%; Alberta 5.58%; Saskatchewan 3.76%.

Where each province’s goods exports go, and what they are, 2025

Share of each province’s domestic merchandise exports (customs basis). A measured exposure of export value to one market or one commodity group, not an estimate of how much income or employment depends on it.

Chart loads when it comes into view.

Top values: New Brunswick 90.4%; Alberta 85.43%; Prince Edward Island 80.05%.

7 · Cities

Metropolitan areas in Newfoundland and Labrador

City pages use metropolitan data; this province page must not be read as any of them.

No metropolitan area in Newfoundland and Labrador is configured yet.

9 · Public finances

The provincial or territorial government's accounts

Statistics Canada government finance statistics (public-accounts basis), fiscal years ended 31 March. Annual, and about two years behind: past position, not this year's budget.

MeasureLatestFiscal year beginning in AprilYear before
RevenueC$9.4 billion2024C$8.9 billion
Grants received from other governments (part of revenue)C$2.4 billion2024C$2.3 billion
ExpenseC$9.7 billion2024C$9.7 billion
Net operating balance (revenue minus expense)−C$0.3 billion2024−C$0.8 billion
Liabilities (end of fiscal year)C$27.7 billion2024C$24.7 billion
Net worth (end of fiscal year; negative = liabilities exceed assets)C$9.1 billion2024C$7.8 billion

Computed: grants from other governments were 25.5% of revenue in the fiscal year that began in April 2024; the table does not say which government paid them, and most are federal transfers. Compare on the atlas →

Computed: the net operating balance was -3.3% of revenue in the fiscal year that began in April 2024. Compare on the atlas →

10 · Not assessed

What this profile does not cover

Listed so that silence is not mistaken for absence of an issue.