Latest values, rankings and charts for Manitoba, all computed from Statistics Canada data held by this platform. The economic story below explains with attributed statements from official sources; the profile only computes. Forecasts quoted are their publishers' and Northline publishes none.
Data profile with a sourced economic storyEvery statement in the data profile below is computed from a published series and links to its source in the chart footers. Rankings compare places on the same definition and period; they describe differences and do not explain them. The three territories have their own profiles.
The economy
What explains Manitoba's steady labour market and below-average growth, and what are the pressures on its finances and trade?
Manitoba has the lowest unemployment rate of any province, but Manitoba Hydro has taken losses from drought, and the province's non-permanent resident population is shrinking
What happened
Manitoba's unemployment rate was 5.0% in October 2026, employment changed by 2.2% from a year earlier and the population by 0.6% from four quarters earlier. Real GDP changed 8.2% from 2019 to 2025, and 13.0% from 2020, when the pandemic depressed output.
Why it happened
Historical context
The province describes its economy as one of the most stable among the provinces, characterised by a diversified base of predominantly medium-sized sectors, and reports that the goods-producing sector generated 25.7 per cent of GDP in 2024.
Its 2025-26 annual report says real GDP grew 1.3 per cent in 2025, below Canada's 1.7 per cent, with agriculture the strongest-growing industry (up 8.8 per cent), construction growing on public-sector capital investment, and manufacturing and utilities declining. Statistics Canada's revised figures, released on 5 November 2026, put 2025 growth at 2.0% at market prices in 2017 constant prices and 1.6% at basic prices.
The Manitoba Bureau of Statistics reports that Manitoba had the lowest unemployment rate among the provinces in August 2026 at 5.0 per cent and that employment rose 2.6 per cent over the year.
Manitoba Hydro reports that 2025-26 was the fourth year of low water conditions in the past five, that severe drought reduced generation and forced larger, higher-priced power imports, and that more than 97 per cent of Manitoba's electricity comes from renewable hydroelectric resources.
The budget reports that farm cash receipts reached a record 10.4 billion dollars in 2025, up six per cent, but that the crop sector anticipates tighter margins in 2026, and that 2025 was the worst wildfire season in thirty years.
The province's March budget said Manitoba was forecast to outperform manufacturing-intensive economies such as Ontario and Quebec while the fastest-growing provinces in 2025 and 2026 were oil-rich. For 2025, Statistics Canada's revised figures put growth in real output at basic prices at 1.6% in Manitoba, 1.7% in Ontario and 0.9% in Quebec.
The budget reports an unprecedented net outflow of 10,489 non-permanent residents between October 2024 and September 2025, that the Provincial Nominee Program accounted for 56.7 per cent of immigration in 2024-25, and that slower population growth due to federal immigration policy has begun to constrain labour supply and domestic demand. Statistics Canada has since revised its non-permanent resident estimates back to July 2021: its current series shows a much smaller net outflow over those twelve months, and a net change of -6,814 over the four quarters to Q2 2026.
The federal Major Projects Office describes a project with the province to upgrade the Port of Churchill, the only tidewater access on the Prairies, with a rail upgrade and an all-weather road.
The province says softening US demand because of tariff uncertainty has weighed on export-oriented sectors, particularly agriculture and manufacturing, and that China imposed retaliatory tariffs on canola in 2025.
CMHC adds that a significant portion of Manitoba's agricultural exports is directed to the United States and China, leaving the province more exposed to external shocks, and that US tariffs have likely weakened confidence in US-reliant industries (its word is "likely": an inference).
The province's September first-quarter report expects real GDP growth of 1.1 per cent in 2026, down from 1.3 per cent at the time of the budget, and 1.7 per cent in 2027, and forecasts a 2026-27 deficit of 496 million dollars, against 498 million in the budget. These are the publishers' forecasts, not Northline's. The Manitoba Bureau of Statistics' monthly Labour Force Survey release and Statistics Canada's population estimates (release calendar) show how the migration reversal develops.
Fiscal position, investment and comparisons
How is Manitoba's fiscal position built, what do its major investments depend on, how exposed is its trade, and how does it differ from Saskatchewan, Alberta and Quebec?
Manitoba's finances lean on federal transfers rather than resource royalties, its large investment plans include Manitoba Hydro's capital program and a proposed Churchill corridor, and in 2025 two thirds of its goods exports went to the United States
What happened
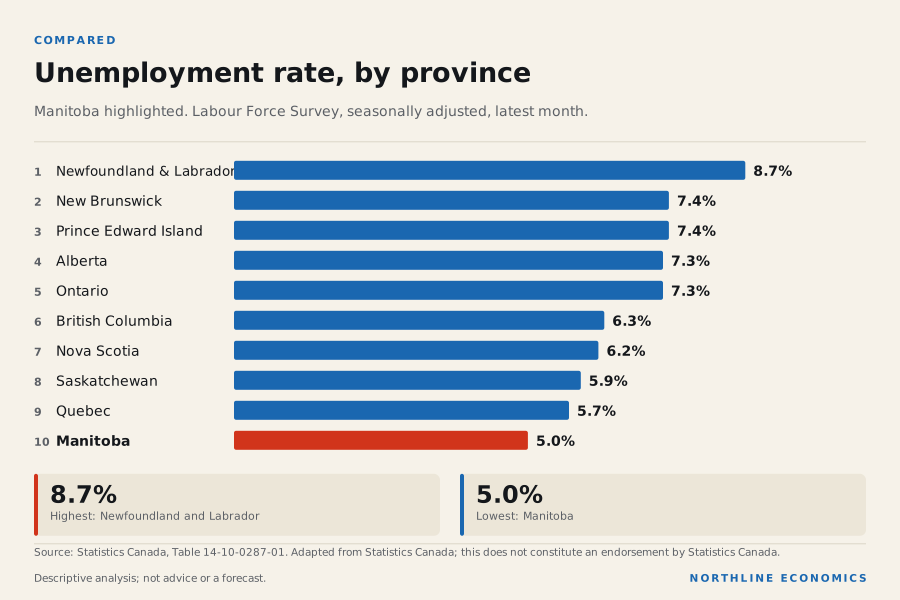
Manitoba's unemployment rate was 5.0% in October 2026, ranking 10th of 10 among the ten provinces (1st = highest), against 6.7% for Canada. Average hourly wages were C$32.46 an hour, ranking 10th of 10.
In Statistics Canada's government-finance series for the fiscal year that began in April 2024, Manitoba's revenue was C$21.9 billion, its net operating balance was -C$1.7 billion, and grants from other governments, mostly federal, were 36.5% of revenue.
Why it happened
Historical context
The province's 2025-26 annual report gives a summary deficit of 832 million dollars, in line with Budget 2025. Revenue was 27 million dollars above budget, with a 629 million dollar decrease in government business enterprise income and a 250 million dollar decrease in federal transfers.
The March 2026 budget attributes the 2025-26 pressure to expenses for wildfires, drought and tariffs, and says dry conditions reduced government business enterprise revenue. It planned a deficit of 498 million dollars for 2026/27 and summary net debt of 39,714 million dollars, a ratio of 38.2 per cent of GDP. The September first-quarter report forecasts a deficit of 496 million dollars, with summary net debt of 38,056 million dollars, 36.4 per cent of GDP.
The annual report puts net debt at 36,539 million dollars at 31 March 2026. The budget's own forecast for the same date was 38,057 million dollars, and its forecast 2025-26 deficit was 1,666 million dollars. Both are the province's figures. The first-quarter report says its lower net-debt forecast mainly reflects an opening balance adjusted to the net debt in the 2025/26 public accounts; no source cited here explains the difference between the two 2025-26 deficits.
On revenue, the province says the Canada Health Transfer, Canada Social Transfer and Equalization together make up approximately 29 per cent of 2026/27 summary revenue, and that Equalization is more than half of federal transfers. Manitoba will receive 5.0 billion dollars of Equalization, up 355 million dollars. Its own taxes are listed as individual income tax of 5,075 million dollars and retail sales tax of 3,037 million dollars, against minerals and petroleum revenue of 26 million dollars and water power rentals of 62 million dollars.
The province says its Equalization increase is mainly due to growth in the overall size of the program and "relatively lower fiscal capacity growth compared to some of the other provinces", and that British Columbia, Alberta and Saskatchewan receive no Equalization in 2026/27.
Finance Canada says fiscal capacity covers five revenue categories including natural resource revenues, and that for natural resources fiscal capacity is assessed on partial inclusion of actual revenue collected by the province.
The province's April 2026 investor presentation lists S&P Global Ratings at A+, Moody's at Aa2 and DBRS Morningstar at A (high), each with a stable outlook. This is the province's account of the ratings, not the agencies' pages.
Read together, these statements describe a budget in which transfers and broad-based taxes carry the revenue and resource royalties are small, so Manitoba's revenue is tied to federal formulas rather than commodity prices. That is the research desk's reading of the tables, not a statement by any source.
Why it matters
Historical context
The province's capital plan will invest 4.3 billion dollars a year on average over five years, with strategic infrastructure spending in 2026/27 over 3.7 billion dollars, including 1.2 billion dollars by Crown corporations. Named items include a Highway 1E twinning to the Ontario border, an interchange at the Perimeter Highway and PTH 3, a Victoria Hospital emergency room redevelopment and four new schools.
The annual report says net debt rose by 1,381 million dollars in 2025-26, reflecting the operating deficit plus 1,163 million dollars of net acquisition of tangible capital assets.
Manitoba Hydro plans to invest nearly 17 billion dollars over the next decade, which it says is intended to support future electricity demand and enable economic development.
The Canada Energy Regulator describes the 695 MW Keeyask station as fully online since 2022, and says the Manitoba-Minnesota line raised export capacity to 3,185 MW and lets Hydro receive electricity in years with low water.
The federal Major Projects Office describes Churchill Plus as a joint project with Manitoba to upgrade the Port of Churchill with an all-weather road, an upgraded rail line, an energy corridor and icebreaking capacity.
The budget says a market-sounding study will engage executives in mining, energy, potash, grain and northern resupply on how extended or year-round shipping supported by icebreaking, a modernized railway, an all-season road and a potential energy corridor could shape private investment; that icebreakers are still needed in the meantime; and that a new Manitoba Crown-Indigenous Corporation, a 50/50 partnership with an interim board, would work with a private proponent once one is selected. It adds a 10 million dollar catalyst fund.
None of the sources cited here gives a total cost or a funding commitment for Churchill Plus beyond 262.5 million dollars over five years for the Hudson Bay rail line and a critical-minerals storage facility. It should be treated as a proposal.
History
Real output at basic prices in Manitoba (chained 2017 dollars, Statistics Canada table 36-10-0711-01) was C$73.5 billion in 2025, a change of 16.7% over ten years. Over the same ten years goods-producing industries changed 4.7% and services-producing industries 21.3%; mining, quarrying and oil and gas changed -23.6%, manufacturing 2.4% and the public sector 16.4%. These are changes in real output, not in income or jobs, and the table gives no reason for the differences; the sourced paragraphs in this section and in the story give the explanations that named sources offer.
Real output by industry in Manitoba, indexed
Real GDP at basic prices, chained 2017 dollars, annual (Statistics Canada table 36-10-0711-01); first year shown = 100. Goods and services against the total, with mining and oil and gas, manufacturing and the public sector. Chained-dollar levels are not additive, so only changes are compared.
Chart loads when it comes into view.
Latest values: All industries 73,550,000,000 (2025); Goods-producing industries 18,200,000,000 (2025); Services-producing industries 55,350,000,000 (2025); Mining, quarrying and oil and gas 1,392,000,000 (2025); and 2 more in the data table.
Labour productivity, meaning real value added per hour worked in chained 2017 dollars (Statistics Canada table 36-10-0713-01), was C$56.60 an hour in Manitoba in 2025, ranking 7th of 10 (highest = 1), a change of 2.7% over ten years. In goods-producing industries it was C$61.80 an hour (a change of 2.0% over ten years) and in services-producing industries C$55.00 an hour (a change of 3.2%). A high level can reflect capital-intensive industries such as oil, gas and mining rather than the efficiency of the whole economy, and the table says nothing about why levels or changes differ.
Labour productivity in Manitoba: goods and services
Real value added per hour worked, chained 2017 dollars, annual (Statistics Canada table 36-10-0713-01). Goods-producing industries include mining and oil and gas, so their level reflects capital-intensive resource extraction as well as manufacturing and construction.
Manitoba Hydro reports a net loss of 446 million dollars for 2025-26, after a 63 million dollar loss in 2024-25, and calls it the fourth year of low water conditions in five.
The budget, written earlier in the year, forecast a Hydro loss of 502 million dollars; the two figures are the Crown corporation's final result and the province's forecast and are not reconciled here.
From 2019 to 2025 real GDP changed 8.2% in Manitoba, against 11.6% in Saskatchewan, 13.0% in Alberta and 11.8% in Quebec; measured from 2020, when the pandemic depressed output, the changes were 13.0%, 17.5%, 22.5% and 17.4%. On Statistics Canada's basis, in the fiscal year that began in April 2024, grants were 36.5% of revenue in Manitoba, 17.2% in Saskatchewan, 14.3% in Alberta and 17.9% in Quebec. Unemployment in October 2026 was 5.0%, 5.9%, 7.3% and 5.7% in the same order. In 2025 energy products were 6% of Manitoba's domestic goods exports, 33% of Saskatchewan's, 76% of Alberta's and 4% of Quebec's.
Interpretation
The province's March budget said Manitoba was forecast to outperform manufacturing-intensive Ontario and Quebec in 2025 and 2026, while the fastest-growing provinces were oil rich; for 2025, Statistics Canada's revised figures put growth in real output at basic prices at 1.6% in Manitoba, 1.7% in Ontario and 0.9% in Quebec. Saskatchewan's budget says non-renewable resources revenue accounts for 11.5 per cent of its 2026-27 expense. Manitoba's energy share of exports is small by comparison, as the shares above show.
Alberta's first-quarter update forecasts a 2 billion dollar surplus, an improvement of 11.4 billion dollars from budget "mainly as a result of higher-than-expected non-renewable resource (NRR) revenue".
Quebec's March budget put its net debt burden at 38.8 per cent of GDP at 31 March 2026; Manitoba's annual report gives a net debt-to-GDP ratio of 36.4 per cent for the same date. The two figures use each government's own definition and are not directly comparable.
The pattern the sources support is that Alberta's fiscal swings come from resource revenue, Saskatchewan's are tied partly to resource prices, and Manitoba's are tied to federal formulas and to Hydro's water supply. The desk draws that from the sources above; no source compares the four provinces' revenue structures directly.
What it influences
Employment in Manitoba changed 2.2% over twelve months and the participation rate was 66.5%. The job vacancy rate was 3.0% in August 2026. Over the last four quarters the net change in non-permanent residents was -6,814 in Manitoba, against -7,957 in Alberta, and net interprovincial migration was -5,291, against 22 thousand.
Historical context
The Manitoba Bureau of Statistics reports average hourly wages of 32.11 dollars in August 2026, against 37.02 dollars for Canada, and goods-producing employment up 8.4 per cent in the year.
The budget says wages grew 4.1 per cent in 2025 against inflation of 2.7 per cent, and describes a new Economic Development Strategy "centred on boosting productivity".
Job Bank links a 7.9 per cent rise in health and social assistance employment in 2025 to the provincial budget, and reports transportation and warehousing employment down 4.7 per cent that year.
The budget reports a record net outflow of 10,489 non-permanent residents in the year to September 2025, and says the provincial nominee program was 56.7 per cent of immigration in 2024/25. Statistics Canada has since revised its non-permanent resident estimates back to July 2021: its current series shows a much smaller net outflow over those twelve months, and a net change of -6,814 over the four quarters to Q2 2026.
CMHC says rental demand in Winnipeg is heavily influenced by immigration, particularly non-permanent residents, and expects rental vacancy to rise to its highest in over 20 years.
The United States took 66% of Manitoba's domestic goods exports in 2025, against 54% for Saskatchewan, 85% for Alberta and 72% for Quebec. The province names agriculture and manufacturing among its top exports to the United States and says they could face risks if tariff schedules or market access change, and CMHC adds that a significant portion of agricultural exports goes to the United States and China.
Saskatchewan says its high CUSMA compliance of around 97 per cent kept the effective US tariff rate at 1.6 per cent. Manitoba's budget gives no equivalent figure for Manitoba.
Manitoba's budget says the CUSMA review creates uncertainty, and credits diversification toward non-US markets with partly offsetting weaker US-bound exports. Its text predates the review. On 1 July 2026 the United States did not agree to renew the agreement, which stays in force with annual joint reviews.
On Equalization, the budget says the program is a fixed pot, so lower fiscal capacity growth in larger provinces could reduce Manitoba's payments, and that the next review must be completed by 31 March 2029.
The Manitoba Bureau of Statistics' monthly Labour Force Survey, Statistics Canada's quarterly population estimates and the provincial and territorial government-finance release show whether the labour, migration and fiscal patterns above persist. Also watch the annual CUSMA joint reviews, Manitoba Hydro's water conditions and rate filings, the Major Projects Office's Churchill Plus market-sounding results and the selection of a private proponent. The province's published forecasts are the publishers', not Northline's.
Written profile
What do the data show about the Manitoba economy?
Manitoba's unemployment rate was 5.0% in October 2026, its prices were up 4.4% in the year to September 2026 and its government's net operating balance, on Statistics Canada's basis, was -7.7% of revenue in the fiscal year that began in April 2024
Manitoba against the other nine
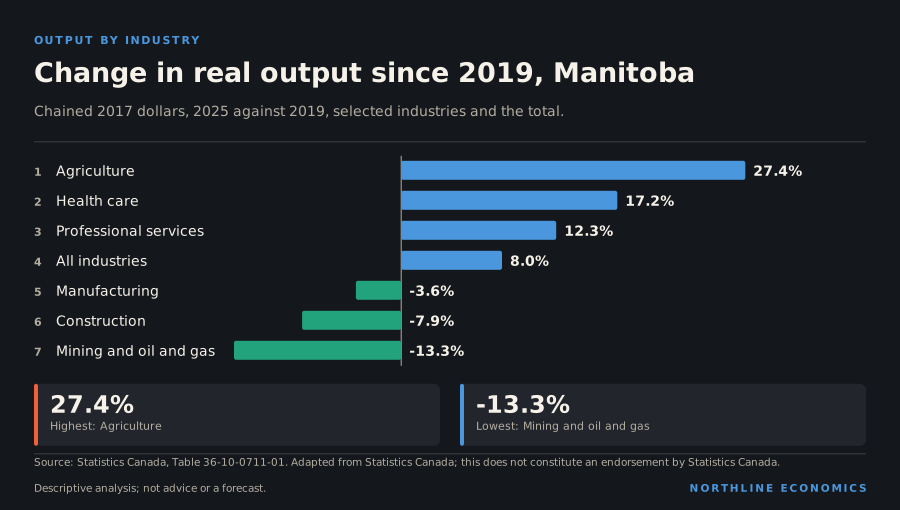
Manitoba has the lowest unemployment rate of the ten provinces, 5.0%, and one of the slowest-growing economies. From 2019 to 2025 real GDP grew 8.2%, ninth of ten (13.0% from 2020, when the pandemic depressed output), and output across all industries is 8.0% above 2019, also ninth. Employment changed by 2.2% from a year earlier, second of ten, and the participation rate of 66.5% ranks 3rd of 10.
In the latest figures pay is a little ahead of prices. Average weekly earnings rose 4.9% in the twelve months to August 2026 while consumer prices rose 4.4% in the twelve months to September 2026, the fifth-highest rate of the ten provinces, so earnings gained a little purchasing power on average over the year. The population grew 0.6% in the year to 1 July 2026, sixth of ten, and the province lost a net 5,291 persons to other provinces, eighth of ten, while non-permanent residents changed by -6,814.
A diversified base without a leading industry
Manitoba's job base does not depend on one industry. In 2025 health care and social assistance employed 16.8% of workers, retail trade 10.3%, educational services 8.7%, construction 8.1% and transportation and warehousing 6.4%. Manufacturing employed 9.6%, the third-highest share of the ten provinces, and energy products were only 5.7% of the province's C$19.6 billion of domestic goods exports, of which 65.9% went to the United States.
Growth since 2019 was modest across most industries: health care and social assistance grew 17.2%, the second-smallest gain of the ten provinces, professional services grew 12.3% and construction changed by -7.9%. Manufacturing changed by -3.6%, close to flat, and agriculture grew 27.4%. Mining, a small industry here, changed by -13.3%.
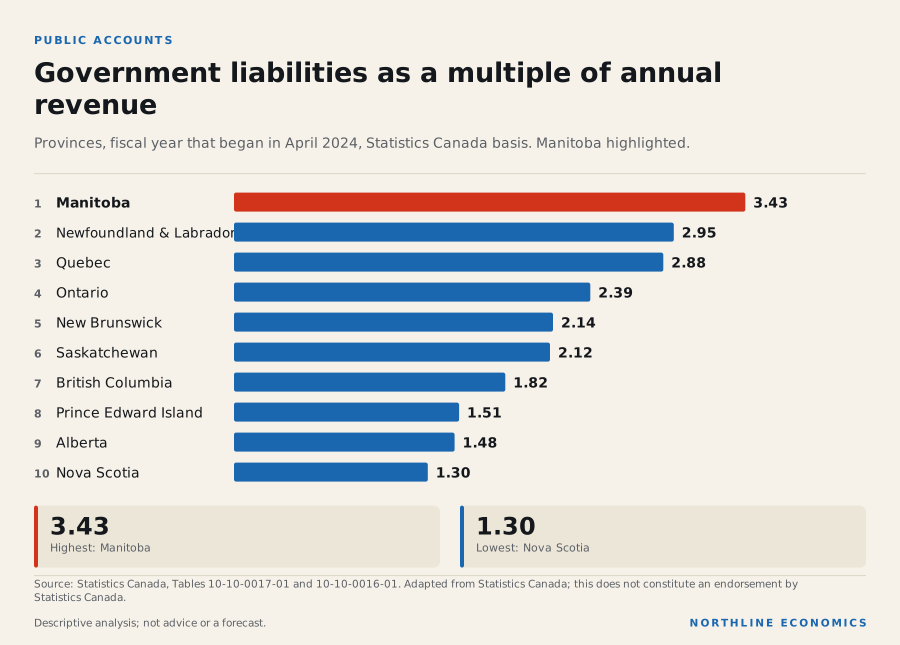
In the fiscal year that began in April 2024 the provincial government's net operating balance was -C$1.7 billion on revenues of C$21.9 billion, a balance equal to -7.7% of revenue (negative is a deficit). Its liabilities were 3.43 times annual revenue, the highest multiple of the ten provinces, against 1.48 for Alberta. The basis is Statistics Canada's and differs from the province's own accounts; liabilities are gross of financial assets, so they are not net debt, and the data here do not break them down.
Historical context
The province's own annual report and public accounts show a deficit of $1,149 million for fiscal 2024-25; its annual report for 2025-26 records a summary deficit of $832 million.
For a business, Manitoba is a lower-growth market with the lowest unemployment rate of the ten provinces, which can make hiring harder, while slow population growth limits demand from new households. Housing starts of 5.8 per thousand residents are seventh of the ten provinces. For a lender or investor, the liabilities multiple is the number to examine against the province's own financial statements.
What the data cannot say: they are provincial totals that do not separate Winnipeg from the rest of the province, they do not show why growth has been slow, and the labour survey is a sample. Nothing here is a forecast.
Labour market and prices
The unemployment rate was 5.0% in October 2026, ranking 10th of 10 among the ten provinces (1st = highest). Employment changed by 2.2% over the year and the participation rate was 66.5%. Average weekly earnings were C$1,248 a week in August 2026, ranking 8th of 10. Consumer prices were up 4.4% in September 2026 on a year earlier, ranking 5th of 10.
Unemployment rate by province
Percent, seasonally adjusted, monthly. Province series, Labour Force Survey.
Chart loads when it comes into view.
Latest values: Manitoba 5 (2026-10); British Columbia 6.3 (2026-10); Alberta 7.3 (2026-10); Saskatchewan 5.9 (2026-10); and 6 more in the data table.
The population was 0.6% higher than four quarters earlier. Net interprovincial migration over the latest four quarters was -5,291 persons (negative = net outflow), and non-permanent residents changed by -6,814. Real GDP changed 13.0% from 2020, when the pandemic depressed output, to 2025, and 8.2% from 2019. Retail sales in August 2026 were 8.5% higher than a year earlier.
Population by province, indexed
Quarterly estimates; start of period = 100.
Chart loads when it comes into view.
Latest values: Manitoba 1,517,000 (2026 Q3); British Columbia 5,711,000 (2026 Q3); Alberta 5,101,000 (2026 Q3); Saskatchewan 1,278,000 (2026 Q3); and 6 more in the data table.
Annual, 2017 constant prices (not chained); start of the period = 100. Expenditure-based.
Chart loads when it comes into view.
Latest values: Manitoba 79,430,000,000 (2025); British Columbia 356,100,000,000 (2025); Alberta 382,600,000,000 (2025); Saskatchewan 90,590,000,000 (2025); and 6 more in the data table.
Economic structure and trade exposure
In 2025 (the year of the table's latest annual average), health care and social assistance employed 16.8% of Manitoba's workers, retail trade 10.3%, construction 8.1% and public administration 5.8%. Among goods-producing groups, agriculture 2.0%; forestry, fishing, mining, quarrying, oil and gas 0.9%; and manufacturing 9.6%. Finance and insurance employed 4.7% and professional, scientific and technical services 5.4%.
How much of each province’s employment is in one industry
Share of provincial employment, 2025 annual average (Labour Force Survey). A measured exposure to an industry, not an estimate of how much output or income depends on it. “Resources” combines forestry, fishing, mining, quarrying and oil and gas.
Chart loads when it comes into view.
Top values: Newfoundland and Labrador 6.37%; Alberta 5.58%; Saskatchewan 3.76%.
Domestic merchandise exports were C$19.6 billion in calendar year 2025. 66% went to the United States and energy products were 6% of the total; energy products sent to the United States were 6% of all the province's domestic exports. These are customs-basis goods exports assigned to the province of origin as Statistics Canada defines it; they exclude services, which are a large part of some provincial economies, and the province of export clearance can differ from the province of production for some commodities.
Where each province’s goods exports go, and what they are, 2025
Share of each province’s domestic merchandise exports (customs basis). A measured exposure of export value to one market or one commodity group, not an estimate of how much income or employment depends on it.
Chart loads when it comes into view.
Top values: New Brunswick 90.4%; Alberta 85.43%; Prince Edward Island 80.05%.
Employment shares and export shares describe the structure of the economy; they do not by themselves show which industries drive growth, incomes or public revenue, or how exposed the province is to a given shock.
Long-run perspective
Population is 46.8% higher on 1 July 2026 than on 1 January 1981, against 69.5% for Canada as a whole. Real GDP (at 2017 constant prices) is 132.8% higher in 2025 than in 1981; this is a level comparison between two years, not an average annual rate, and it is not compared with a national figure here because the national real GDP series is monthly and on a different basis.
Employment is 50.0% higher in October 2026 than in June 1993, the start of the national series used here (65.1% for Canada). Over the past forty years the unemployment rate has ranged from 3.9% (June 2008) to 11.9% (May 2020); it was 5.0% in October 2026, against 6.7% for Canada.
Employment by province, indexed
Seasonally adjusted; start of period = 100.
Chart loads when it comes into view.
Latest values: Manitoba 752,500 (2026-10); British Columbia 2,941,000 (2026-10); Alberta 2,660,000 (2026-10); Saskatchewan 624,600 (2026-10); and 6 more in the data table.
Average weekly earnings, in current dollars and not seasonally adjusted, are 110.3% higher in August 2026 than in the same month twenty-five years earlier (106.8% for Canada). These are nominal figures: they include the effect of price increases over twenty-five years and are not a measure of the change in purchasing power.
These comparisons describe the size of changes between two dates. They do not say why this jurisdiction differs from Canada, and the end points can matter: a different starting year changes the percentage.
Public finances
For the fiscal year that began in April 2024, on Statistics Canada's basis, the provincial government's revenue was C$21.9 billion and its expense C$23.5 billion, leaving a net operating balance of -C$1.7 billion (-7.7% of revenue). Grants received from other governments (mostly federal transfers; the table does not split them by payer) were C$8.0 billion, 36.5% of revenue. Liabilities at the end of the year were C$74.9 billion and net worth -C$13.6 billion. These are past-year accounts, not the current budget.
What is not assessed
Why these figures differ from other provinces, industry structure beyond the latest employment shares, housing prices and rents, exports by destination over time, the current budget and credit ratings, major projects, and policy changes. This profile cites no source that explains Manitoba's position, and nothing here is a forecast.
1 · Where it ranks
Manitoba among the ten provinces
Same values as the Canada atlas layers. Rank 1 is the highest value, which is not always the most favourable outcome. A measure the source does not publish for a place is simply absent.
Latest values: Manitoba 752,500 (2026-10); British Columbia 2,941,000 (2026-10); Alberta 2,660,000 (2026-10); Saskatchewan 624,600 (2026-10); and 6 more in the data table.
Current dollars per hour, all industries, employees aged 15 and over, not seasonally adjusted.
Chart loads when it comes into view.
Latest values: Manitoba 32.46 (2026-10); British Columbia 39.54 (2026-10); Alberta 39 (2026-10); Saskatchewan 34.21 (2026-10); and 6 more in the data table.
Average weekly earnings by province
Current dollars per week, industrial aggregate incl. overtime, not seasonally adjusted.
Chart loads when it comes into view.
Latest values: Manitoba 1,248 (2026-08); British Columbia 1,366 (2026-08); Alberta 1,410 (2026-08); Saskatchewan 1,303 (2026-08); and 6 more in the data table.
3 · Prices
Inflation
12-month change in the all-items CPI, derived by this project from the index.
Consumer price inflation by province
12-month change in the all-items CPI (derived by this project from the index).
Chart loads when it comes into view.
Latest values: Manitoba 4.36 (2026-09); British Columbia 2.96 (2026-09); Alberta 3.6 (2026-09); Saskatchewan 3.3 (2026-09); and 6 more in the data table.
Quarterly population estimates and four-quarter migration flows.
Population by province, indexed
Quarterly estimates; start of period = 100.
Chart loads when it comes into view.
Latest values: Manitoba 1,517,000 (2026 Q3); British Columbia 5,711,000 (2026 Q3); Alberta 5,101,000 (2026 Q3); Saskatchewan 1,278,000 (2026 Q3); and 6 more in the data table.
New permanent residents arriving over the previous four quarters.
Chart loads when it comes into view.
Latest values: Manitoba 19,350 (2026 Q2); British Columbia 45,800 (2026 Q2); Alberta 50,160 (2026 Q2); Saskatchewan 14,390 (2026 Q2); and 6 more in the data table.
Net interprovincial migration (4-quarter total)
In-migrants minus out-migrants over the previous four quarters (derived).
Chart loads when it comes into view.
Latest values: Manitoba 14,610 (2026 Q2); British Columbia 58,490 (2026 Q2); Alberta 78,320 (2026 Q2); Saskatchewan 18,270 (2026 Q2); and 6 more in the data table.
Annual real GDP and monthly activity indicators, indexed so the start of the period equals 100 where noted.
Real GDP by province, indexed
Annual, 2017 constant prices (not chained); start of the period = 100. Expenditure-based.
Chart loads when it comes into view.
Latest values: Manitoba 79,430,000,000 (2025); British Columbia 356,100,000,000 (2025); Alberta 382,600,000,000 (2025); Saskatchewan 90,590,000,000 (2025); and 6 more in the data table.
Retail sales by province, indexed
Seasonally adjusted; start of period = 100.
Chart loads when it comes into view.
Latest values: Manitoba 2,530,000,000 (2026-08); British Columbia 9,970,000,000 (2026-08); Alberta 9,649,000,000 (2026-08); Saskatchewan 2,315,000,000 (2026-08); and 6 more in the data table.
Manufacturing sales by province, indexed
Seasonally adjusted shipments; start of period = 100.
Chart loads when it comes into view.
Latest values: Manitoba 2,367,000,000 (2026-08); British Columbia 6,093,000,000 (2026-08); Alberta 10,510,000,000 (2026-08); Saskatchewan 2,300,000,000 (2026-08); and 6 more in the data table.
Investment in new building construction by province, indexed
Current dollars, not seasonally adjusted, 12-month sum; start of the period = 100.
Chart loads when it comes into view.
Latest values: Manitoba 4,591,000,000 (2026-08); British Columbia 26,550,000,000 (2026-08); Alberta 21,980,000,000 (2026-08); Saskatchewan 3,138,000,000 (2026-08); and 6 more in the data table.
Housing starts by province (12-month average)
Seasonally adjusted annual rate, averaged over 12 months (smoothed); units per year. CMHC data distributed by Statistics Canada.
Chart loads when it comes into view.
Latest values: Manitoba 8,790 (2026-09); British Columbia 43,320 (2026-09); Alberta 49,530 (2026-09); Saskatchewan 6,443 (2026-09); and 6 more in the data table.
Latest shares only. A measured exposure, not an estimate of how much output or income depends on an industry.
Industry
Share of provincial employment
Period
Health care and social assistance
16.8%
2025
Manufacturing
9.6%
2025
Construction
8.1%
2025
Transportation and warehousing
6.4%
2025
Finance, insurance, real estate, rental and leasing
6.4%
2025
World oil price (WTI)
5.7%
2025
Professional, scientific and technical services
5.4%
2025
Agriculture
2.0%
2025
Forestry, fishing, mining, quarrying, oil and gas
0.9%
2025
Real output by industry in Manitoba, indexed
Real GDP at basic prices, chained 2017 dollars, annual (Statistics Canada table 36-10-0711-01); first year shown = 100. Goods and services against the total, with mining and oil and gas, manufacturing and the public sector. Chained-dollar levels are not additive, so only changes are compared.
Chart loads when it comes into view.
Latest values: All industries 73,550,000,000 (2025); Goods-producing industries 18,200,000,000 (2025); Services-producing industries 55,350,000,000 (2025); Mining, quarrying and oil and gas 1,392,000,000 (2025); and 2 more in the data table.
Labour productivity by province
Real value added per hour worked, all industries, chained 2017 dollars (Statistics Canada table 36-10-0713-01), annual. A level, not an index: it compares output per hour across provinces, and is high where capital-intensive industries such as oil and gas or mining weigh heavily in the economy.
Chart loads when it comes into view.
Latest values: Manitoba 56.6 (2025); Newfoundland and Labrador 72 (2025); Prince Edward Island 47.6 (2025); Nova Scotia 52.3 (2025); and 6 more in the data table.
Labour productivity in Manitoba: goods and services
Real value added per hour worked, chained 2017 dollars, annual (Statistics Canada table 36-10-0713-01). Goods-producing industries include mining and oil and gas, so their level reflects capital-intensive resource extraction as well as manufacturing and construction.
Change in real output by industry in each province, 2015 to 2025
Percent change in real GDP at basic prices (chained 2017 dollars, annual) over ten years. Each industry is compared with itself; chained-dollar levels are not additive, so shares of the total are not shown. A measure of the change in output, not of income or employment.
Chart loads when it comes into view.
Top values: Prince Edward Island 38.2%; British Columbia 32.5%; Nova Scotia 26.3%.
How much of each province’s employment is in one industry
Share of provincial employment, 2025 annual average (Labour Force Survey). A measured exposure to an industry, not an estimate of how much output or income depends on it. “Resources” combines forestry, fishing, mining, quarrying and oil and gas.
Chart loads when it comes into view.
Top values: Newfoundland and Labrador 6.37%; Alberta 5.58%; Saskatchewan 3.76%.
Where each province’s goods exports go, and what they are, 2025
Share of each province’s domestic merchandise exports (customs basis). A measured exposure of export value to one market or one commodity group, not an estimate of how much income or employment depends on it.
Chart loads when it comes into view.
Top values: New Brunswick 90.4%; Alberta 85.43%; Prince Edward Island 80.05%.
7 · Cities
Metropolitan areas in Manitoba
City pages use metropolitan data; this province page must not be read as any of them.
The provincial or territorial government's accounts
Statistics Canada government finance statistics (public-accounts basis), fiscal years ended 31 March. Annual, and about two years behind: past position, not this year's budget.
Measure
Latest
Fiscal year beginning in April
Year before
Revenue
C$21.9 billion
2024
C$20.6 billion
Grants received from other governments (part of revenue)
C$8.0 billion
2024
C$7.1 billion
Expense
C$23.5 billion
2024
C$22.2 billion
Net operating balance (revenue minus expense)
−C$1.7 billion
2024
−C$1.7 billion
Liabilities (end of fiscal year)
C$74.9 billion
2024
C$69.3 billion
Net worth (end of fiscal year; negative = liabilities exceed assets)
−C$13.6 billion
2024
−C$10.1 billion
Computed: grants from other governments were 36.5% of revenue in the fiscal year that began in April 2024; the table does not say which government paid them, and most are federal transfers. Compare on the atlas →
Computed: the net operating balance was -7.7% of revenue in the fiscal year that began in April 2024. Compare on the atlas →
10 · Not assessed
What this profile does not cover
Listed so that silence is not mistaken for absence of an issue.
The current budget, credit ratings and fiscal plan (only past fiscal years are held)
Housing prices and rents
Employment by industry over time (only the latest provincial shares are held)
Exports by destination over time (only the latest year is held)